Fluorescence resonance energy transfer (FRET) is an imaging technique for detecting protein interactions in living cells. Here, a FRET protocol is presented to study the association of histone-modifying enzymes with transcription factors that recruit them to the target promoters for epigenetic regulation of gene expression in plant tissues.
Epigenetic regulation of gene expression is commonly affected by histone modifying enzymes (HMEs) that generate heterochromatic or euchromatic histone marks for transcriptional repression or activation, respectively. HMEs are recruited to their target chromatin by transcription factors (TFs). Thus, detecting and characterizing direct interactions between HMEs and TFs are critical for understanding their function and specificity better. These studies would be more biologically relevant if performed in vivo within living tissues. Here, a protocol is described for visualizing interactions in plant leaves between a plant histone deubiquitinase and a plant transcription factor using fluorescence resonance energy transfer (FRET), which allows the detection of complexes between protein molecules that are within <10 nm from each other. Two variations of the FRET technique are presented: SE-FRET (sensitized emission) and AB-FRET (acceptor bleaching), in which the energy is transferred non-radiatively from the donor to the acceptor or emitted radiatively by the donor upon photobleaching of the acceptor. Both SE-FRET and AB-FRET approaches can be adapted easily to discover other interactions between other proteins in planta.
Plant histone deubiquitinases play an important role in controlling gene expression by post-translational modification of histones, specifically by erasing their monoubiquitylation marks1. So far, OTLD1 is one of the only few plant histone deubiquitinases characterized at the molecular level in Arabidopsis2,3. OTLD1 removes monoubiquitin groups from the H2B histone molecules, thereby promoting the removal or addition of euchromatic acetylation and methylation modifications of H3 histones in the target gene chromatin4,5. Moreover, OTLD1 interacts with another chromatin-modifying enzyme, the histone lysine demethylase KDM1C, to affect transcriptional suppression of the target genes6,7.
Most histone-modifying enzymes lack DNA binding capabilities, and thus cannot recognize their target genes directly. One possibility is that they cooperate with DNA-binding transcription factor proteins which bind these enzymes and direct them to their chromatin targets. Specifically, in plants, several major histone-modifying enzymes (i.e., histone methyltransferases8,9, histone acetyltransferases10, histone demethylases11, and Polycomb repressive complexes12,13,14) are known to be recruited by transcription factors. Consistent with this idea, recently, one possible mechanism for OTLD1 recruitment to the target promoters was proposed which is based on specific protein-protein interactions of OTLD1 with a transcription factor LSH1015.
LSH10 belongs to a family of the plant ALOG (Arabidopsis LSH1 and Oryza G1) proteins that function as central developmental regulators16,17,18,19,20,21,22. The fact that the members of the ALOG protein family contain DNA binding motifs23 and exhibit the capacities for transcriptional regulation22, nuclear localization19, and homodimerization24 lends further support to the notion that these proteins, including LSH10, may act as specific transcription factors during epigenetic regulation of transcription. One of the main experimental techniques used to characterize the LSH10-OTLD1 interaction in vivo is fluorescence resonance energy transfer (FRET)15.
FRET is an imaging technique for directly detecting close-range interactions between proteins within <10 nm from each other25 inside living cells. There are two main variations of the FRET approach26: sensitized emission (SE-FRET) (Figure 1A) and acceptor bleaching (AB-FRET) (Figure 1B). In SE-FRET, the interacting proteins-one of which is tagged with a donor fluorochrome (e.g., green fluorescent protein, GFP) and the other with an acceptor fluorochrome (e.g., monomeric red fluorescent protein, mRFP27,28)-non-radiatively transfer the excited state energy from the donor to the acceptor. Because no photons are emitted during this transfer, a fluorescent signal is produced that has a radiative emission spectrum similar to that of the acceptor. In AB-FRET, protein interactions are detected and quantified based on elevated radiative emission of the donor when the acceptor is permanently inactivated by photobleaching, and thus is unable to receive the non-radiative energy transferred from the donor (Figure 1). Importantly, the subcellular location of the FRET fluorescence is indicative of the localization of the interacting proteins in the cell.
The ability to deploy FRET in living tissues and determine the subcellular localization of the interacting proteins simultaneously with detecting this interaction per se, makes FRET the technique of choice for studies and initial characterization of protein-protein interactions in vivo. A comparable in vivo fluorescence imaging methodology, bimolecular fluorescence complementation (BiFC)29,30,31,32, is a good alternative approach, although, unlike FRET, BiFC may produce false positives due to spontaneous assembly of the autofluorescent BiFC reporters33, and quantification of its data is less precise.
This article shares the successful experience in implementing both SE-FRET and AB-FRET techniques and presents a protocol for their deployment to investigate the interactions between OTLD1 and LSH10 in plant cells.
Nicotiana benthamiana, Agrobacterium tumefaciens strain EHA105, or GV3101 were used for the present study.
1. FRET vector construction
2. Agroinfiltration
3. Confocal microscopy
Figure 2 illustrates the typical results of a SE-FRET experiment, in which the cell nuclei were simultaneously recorded in three channels (i.e., donor GFP, acceptor mRFP, and SE-FRET). These data were used to generate images of SE-FRET efficiency coded in a pseudo-color scale. On this scale, the transition from blue to red corresponds to an increase in FRET efficiency, a measure of protein-protein proximity from 0% to 100%. In this representative experiment, the SE-FRET signal was recorded in the cell nucleus, and its intensity following the coexpression of LSH10 and OTLD1 was comparable to that observed after the expression of the mRFP-GFP (i.e., positive control). No SE-FRET was observed in negative controls (i.e., coexpression of OTLD1-mRFP and LSH4-GFP or free mRFP and LSH10-GFP).
The LSH10-OTLD1 interactions were quantified using AB-FRET. To this end, the donor GFP fluorescence was recorded in the cell nucleus before and after the photobleaching of the acceptor mRFP as photobleaching time series of donor and acceptor fluorescence measurements (Supplementary Figure 4). The images of the recorded cell nuclei were presented in pseudo-color to quantify the change in GFP fluorescence. Figure 3 shows that the LSH10-GFP/OTLD1-mRFP coexpression resulted in an increased GFP donor fluorescence after the mRFP acceptor was photobleached and lost its ability to fluoresce. A similar increase in the donor fluorescence was observed in the mRFP-GFP positive control but not in the negative controls of LSH4-GFP/OTLD1-mRFP or LSH10-GFP/mRFP coexpression, whereas the acceptor fluorescence was inactivated in all photobleaching experiments. Figure 4 shows the quantitative analysis of the AB-FRET data, demonstrating the statistically significant increase in the donor fluorescence (%AB-FRET) of approximately 13% after coexpressing LSH10 and OTLD1. The positive mRFP-GFP control produced %AB-FRET of approximately 30%, whereas the negative controls produced no %AB-FRET. Both SE-FRET and AB-FRET images showed the FRET signal in the cell nucleus, consistent with the subcellular localization expected for the transcription factor-histone-modifying enzyme complexes as well as for the nucleocytoplasmic nature of the GFP/mRFP proteins34 (Figure 2 and Figure 3).
In summary, the representative data show that this FRET protocol can be used to demonstrate and quantify interactions between histone-modifying enzymes and transcription factors and determine their subcellular localization in living plant cells.
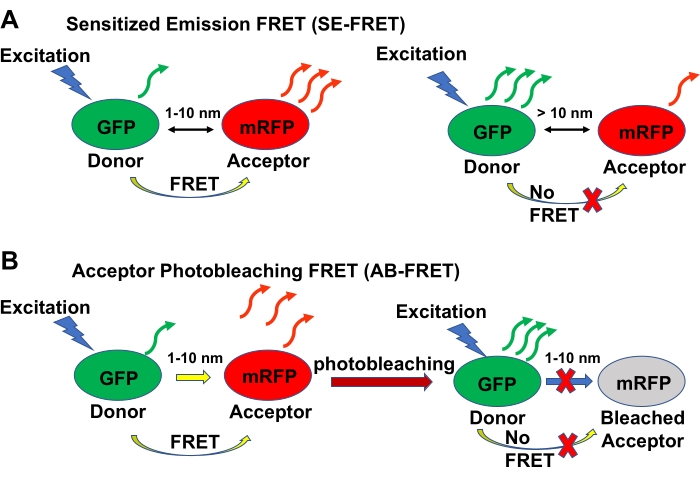
Figure 1: Schematic summary of the SE-FRET and AB-FRET techniques. (A) The basic principle of SE-FRET. One of the tested proteins is tagged with GFP, which acts as a donor fluorochrome, and the other with mRFP, which acts as an acceptor fluorochrome. The donor molecule is excited, and the acceptor emission is recorded. If the tested proteins interact with each other such that they are positioned within 10 nm of each other, the energy from the excited donor is transferred non-radiatively to the acceptor, which then becomes excited and emits fluorescence in the FRET emission channel. If no interaction occurs, no energy is transferred from the donor to the acceptor, and no FRET emission by the acceptor is detected. (B) The basic principle of AB-FRET. The tested proteins are tagged as described in (A) for SE-FRET. The donor molecule is excited, and if the interaction between the tested proteins occurs, the donor excites the acceptor in a non-radiative fashion, resulting in FRET. Then, the acceptor is permanently inactivated by photobleaching, thereby losing its ability to accept non-radiative energy from the donor and emit the FRET fluorescence in the FRET emission channel; the fluorescence emitted by the donor, on the other hand, is increased because the donor loses less energy by the non-radiative transfer. Please click here to view a larger version of this figure.
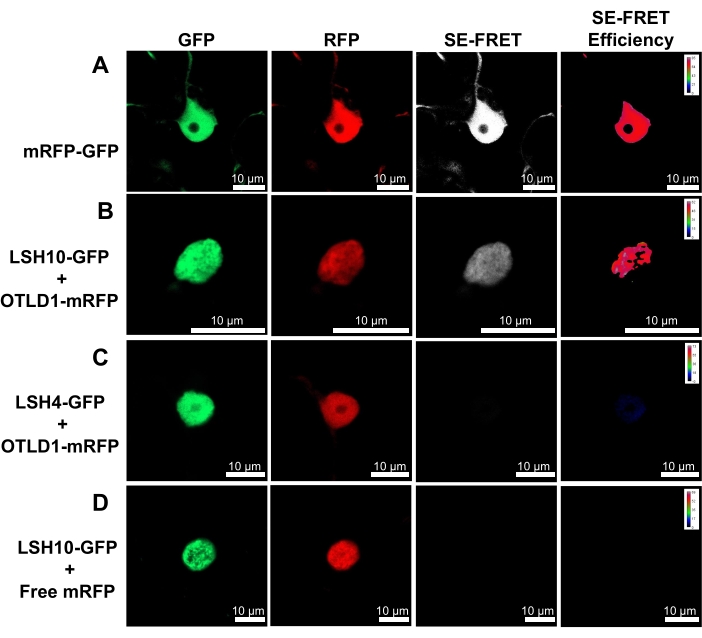
Figure 2: Specific interaction of LSH10 with OTLD1 in N. benthamiana leaves detected by SE-FRET. Images from three detection channels (donor, acceptor, and SE-FRET) are shown for the indicated protein combinations. The SE-FRET efficiency images were calculated by the subtraction of spectral bleed-through (SBT) and are shown in pseudo-color, with the colors red and blue signifying the highest and the lowest signal, respectively. (A) High SE-FRET efficiency signal produced by the mRFP-GFP positive control. (B) Positive SE-FRET efficiency signal produced by the interacting LSH10-GFP and OTLD1-mRFP proteins. (C) Coexpression of the negative control protein LSH4-GFP and OTLD1-mRFP produced no SE-FRET efficiency signal. (D) Coexpression of the negative control-free mRFP protein and LSH10-GFP produced no SE-FRET efficiency signal. Scale bars = 10 µm. Please click here to view a larger version of this figure.
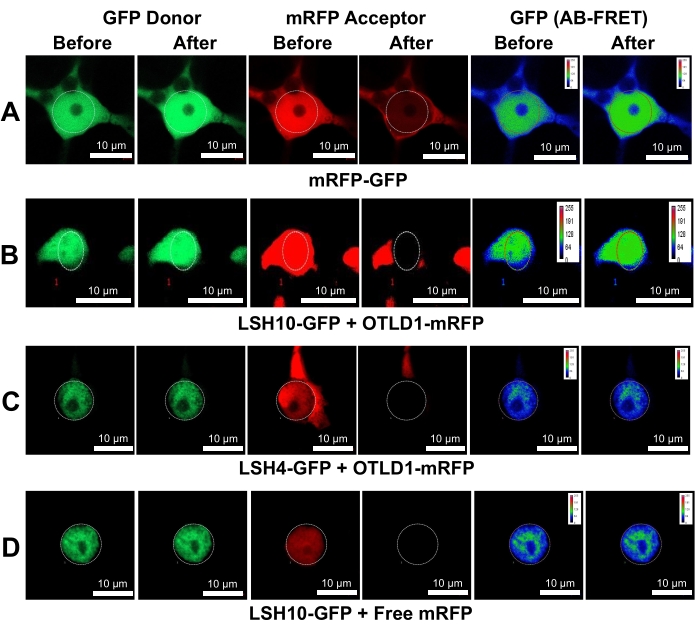
Figure 3: Specific interaction of LSH10 with OTLD1 in N. benthamiana leaves detected by AB-FRET. Images from two detection channels (donor and acceptor) before and after photobleaching are shown for the indicated protein combinations. The circle indicates the photobleached region. AB-FRET, visualized as an increase in GFP fluorescence after mRFP photobleaching, is displayed using pseudo-color with the colors red and blue, signifying the highest and lowest signal, respectively. (A) An increase in the GFP donor fluorescence produced by the mRFP-GFP positive control. (B) An increase in the GFP donor fluorescence produced by the interacting LSH10-GFP and OTLD1-mRFP proteins. (C) Coexpression of the negative control protein LSH4-GFP and OTLD1-mRFP produced negligible changes in the GFP donor fluorescence. (D) Coexpression of the negative control free mRFP protein and LSH10-GFP produced negligible changes in the GFP donor fluorescence. Scale bars = 10 µm. Please click here to view a larger version of this figure.
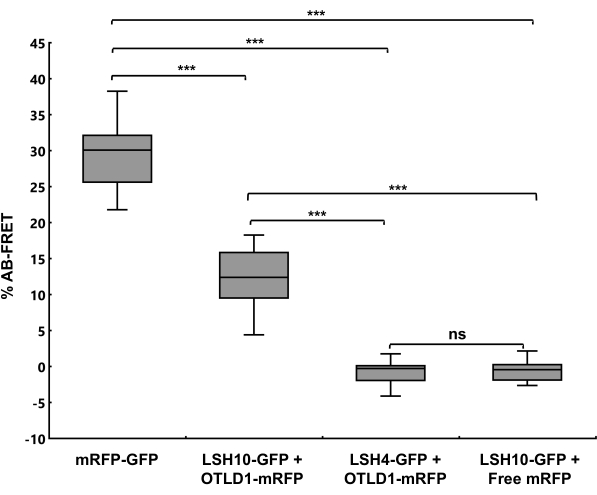
Figure 4: A Quantification of AB-FRET. The percentage increase in the GFP donor fluorescence after mRFP photobleaching (%AB-FRET) is shown for the indicated protein combinations. Error bars represent the mean for n = 13 cells for each measurement. The two-tailed t-test determined that differences between mean values are statistically significant for the p-values *p < 0.05, **p < 0.01, and ***p < 0.001; p≥ 0.05 are not statistically significant (ns). Please click here to view a larger version of this figure.
Primer name | Sequence (5ʹ to 3ʹ) | Purpose | |||||
OTLD1 Fw | ggggacaagtttgtacaaaaaagcaggctcaatgactcggattttggttcaaag | Amplify OTLD1 from cDNA | |||||
OTLD1 Rv | ggggaccactttgtacaagaaagctgggtgttccgtggctttgcctttgcgtc | Amplify OTLD1 from cDNA | |||||
LSH10 Fw | ggggacaagtttgtacaaaaaagcaggctcaatgtcctctccaagagaaagagg | Amplify LSH10 from cDNA | |||||
LSH10 Rv | ggggaccactttgtacaagaaagctgggtgatgtcaacagagactaaagaaac | Amplify LSH10 from cDNA | |||||
LSH4 Fw | ggggacaagtttgtacaaaaaagcaggctcaatggatcatatcatcggctttatg | Amplify LSH4 from cDNA | |||||
LSH4 Rv | ggggaccactttgtacaagaaagctgggtgattagggctacttgaaatcgcc | Amplify LSH4 from cDNA | |||||
mRFP Fw | ggggacaagtttgtacaaaaaagcaggctcaatggcctcctccgaggacgt | Amplify mRFP from pPZP-RCS2A-DEST-mRFP-N1 | |||||
mRFP Rv | ggggaccactttgtacaagaaagctgggtgttggagatctgcggccgcgg | Amplify mRFP from pPZP-RCS2A-DEST-mRFP-N1 | |||||
AttL1 | tcgcgttaacgctagcatggatctc | Confirm sequences in pDONR207 by PCR and DNA sequencing | |||||
AttL2 | gtaacatcagagattttgagacac | Confirm sequences in pDONR207 by PCR and DNA sequencing | |||||
AttB1 Fw | ggggacaagtttgtac aaaaaagcaggct | Confirm sequences in destination vectors by PCR and DNA sequencing | |||||
AttB2 Rv | ggggaccactttgta caagaaagctgggt | Confirm sequences in destination vectors by PCR and DNA sequencing | |||||
35S Promoter Fw | ctatccttcgcaagacccttc | Confirm sequences in destination vectors by PCR |
Table 1: Primers for cloning and confirming the cloned sequences in pDONOR207 and destination vectors. Fw, forward primers; Rv, reverse primers.
Supplementary Figure 1: Setting parameters for confocal channels. (A) Screenshot for the excitation and emission parameter setup for the donor channel (GFP). (B) Screenshot for the excitation and emission parameter setup for the acceptor channel (mRFP). (C) Screenshot for the excitation and emission parameter setup for the FRET channel. Please click here to download this File.
Supplementary Figure 2: Adjusting parameters for the acquisition of SE-FRET images of the sample of interest. (A) Screenshot for the scan area parameter setup (i.e., image size, scan speed, direction, and averaging). (B) Screenshot for the GFP channel parameter setup (i.e., laser, pinhole, master gain, and digital gain). (C) Screenshot for the mRFP channel parameter setup (i.e., laser, pinhole, master gain, and digital gain). (D) Screenshot for the FRET channel parameter setup (i.e., laser, pinhole, master gain, and digital gain). Please click here to download this File.
Supplementary Figure 3: Setting parameters for the acceptor photobleaching. (A) Screenshot for the scan area parameter setup (i.e., image size, scan speed, direction, and averaging). (B) Screenshot for the time series and time bleaching parameter setup. Please click here to download this File.
Supplementary Figure 4: Time series of the donor and acceptor fluorescence measurements during AP-FRET. The kinetics of the acceptor (mRFP) and donor (GFP) fluorescence was determined for the indicated samples before, during, and after the photobleaching period. (A) Positive mRFP-GFP control. (B) LSH10-GFP + OTLD1-mRFP. (C) Negative LSH4-GFP + OTLD1-mRFP control. (D) Negative LSH10-GFP + Free mRFP control. Yellow lines indicate the photobleaching time period. White curves plot the measurements of the fluorescence kinetics. In each panel, the upper and the lower images show the kinetics of the acceptor (mRFP) and donor (GFP) fluorescence, respectively. Note that, naturally, the GFP fluorescence often decreases over time because the laser gradually photobleaches the GFP itself. Please click here to download this File.
This FRET protocol is simple and easy to reproduce; it also requires minimal supply investment and utilizes standard equipment for many modern laboratories. Specifically, five main technical features distinguish the versatility of this procedure. First, the FRET constructs are generated using site-specific recombination, a cloning approach that is easy to use, produces accurate results, and saves time compared to traditional restriction enzyme-based cloning. Second, N. benthamiana plants are simple to grow, produce relatively large amounts of tissue and are available in most laboratories. Third, agroinfiltration results in transient expression of the delivered constructs and, thus, generates data within a relatively short period of time (i.e., 24-36 h) compared to the months required to produce transgenic plants. Fourth, the ability to deliver different combinations of the constructs of interest by co-agroinfiltration allows testing of interactions between any proteins. Lastly, both SE-FRET and AB-FRET can be performed sequentially on the same tissue sample only by turning on/off one of the laser channel settings. It should be noted, however, that microbombardment delivery42 can be used as an alternative approach for construct delivery into the plant tissues instead of agroinfiltration; in this case, the use of binary vectors required for agroinfiltration is unnecessary.
One critical step of this protocol is properly selecting the donor and acceptor fluorochrome pair to optimize the FRET efficiency. The following three factors should be considered: (1) the donor emission spectrum needs to maximally overlap the acceptor absorption spectrum to maximize the amount of transferred energy; (2) the donor's and acceptor's emission spectra must be sufficiently different to be distinguished from each other and to minimize SBT of the signal detected by microscopy; (3) the acceptor must have minimal direct excitation at the absorbance maximum of the donor to minimize excitation of the acceptor during excitation of the donor. Common donor/acceptor FRET pairs used are cyan/yellow and green/red fluorescent proteins (i.e., CFP/YFP and GFP/mRFP, respectively). This protocol utilizes the GFP/mRFP pair because it is suitable for live cell imaging and, unlike the cyan/yellow FRET pairs, exhibits low phototoxicity and low photobleaching43. Conveniently, the translational fusion between the FRET pair (i.e., mRFP-GFP) serves as an ideal FRET positive control.
Another critical step is the selection of the appropriate negative controls. For example, in the case of the LSH10-OTLD1 interaction, the FRET analysis must always include the expression of OTLD1 alone, LSH10 alone, and coexpression of OTLD1 and LSH10 with proteins for which the interaction is not expected (i.e., LSH4 and free mRFP, respectively). In terms of the negative controls' choice, FRET experiments can follow the guidelines on best practices for the use of the BiFC technique44, another fluorescence imaging-based approach adapted for the detection of protein interactions in living plant cells29,30,31,32.
Finally, a factor affecting the FRET experimentation is common to all experiments in living plant tissues, and it derives from the varying physiological conditions of the plant, in general, and the agroinfiltrated transformed cells, in particular, even when maintained under control growth conditions. This physiological variability can contribute to a certain variability of the FRET data between individual experiments, plants, and even leaves. Thus, it is important to use at least two plants and three leaves per plant for each experiment and to select mature, fully expanded leaves for agroinfiltration, as they yield better images.
As with all experimental methodologies, FRET has its technical and usage-based limitations. One such limiting factor is the nature of the autofluorescent tag and its location within the protein of interest (e.g., at the amino- or carboxyl-terminus), which may interfere with the biological properties of this protein, such as its native pattern of subcellular localization or the ability to recognize its natural interactors. Before tagging, each protein of interest must be analyzed, to the extent possible, for its structural features that may be compromised by tagging. In many cases, however, the tagging parameters must be determined empirically based on the known activities of the protein of interest. Another major limitation is the relative technical sophistication of FRET, which requires using confocal microscopy with the appropriate hardware and software. Unlike several other protein interaction methods, such as the yeast two-hybrid system (Y2H)45,46,47, FRET is unsuitable for identifying protein interactions by screening expression libraries, especially high-throughput screens48. In addition, as most assays performed in vivo, FRET is not a biochemically pure system, and thus, it does not detect the potential involvement of other unknown cellular factors in the interaction.
The significance of FRET with respect to other assays of protein interactions lies in its detection of short-distance interactions, reducing the chances for false-positive results, applicability for deployment in vivo in a variety of cells, tissues, and organisms (including plants), and detection of the subcellular localization of the interacting proteins. Many of these characteristics of FRET are found in other in vivo approaches, such as split-luciferase49,50 or BiFC29,30,31,32,33, among which BiFC is perhaps the most commonly used. Another widely used interaction assay is Y2H45,46,47; however, outside of yeast biology research, this assay utilizes a heterologous experimental system, prone to false positives, and its findings require confirmation by another technique. A conceptual variation of Y2H is a split-ubiquitin assay which is better suited for detecting interactions between membrane proteins51,52 and which exhibits limitations relative to FRET that is similar to Y2H. Finally, protein interactions can be detected by co-immunoprecipitation (co-IP), which applies to detection in a complex environment of cell extracts as well as in precisely defined in vitro reactions53,54,55; in our experience, co-IP is most useful as an alternative and independent method to confirm data obtained using the fluorescence-based in vivo approaches.
Whereas this specific FRET protocol was developed to study the interactions between plant transcription factors and histone-modifying enzymes, it can be used to discover and characterize interactions between many other classes of proteins inplanta.
The authors have nothing to disclose.
The work in V.C.'s laboratory is supported by grants from NIH (R35GM144059 and R01GM50224), NSF (MCB1913165 and IOS1758046), and BARD (IS-5276-20) to V.C.
Acetosyringone (3′,5′-Dimethoxy-4′-hydroxyacetophenone) | Sigma-Aldrich | #D134406-1G | |
Bacto Agar | BD Biosciences | #214010 | |
Bacto trypton | BD Biosciences | #211705 | |
Bacto yeast extract | BD Biosciences | #212750 | |
Confocal laser scanning microscope (CLSM) | Zeiss | LSM900 | Any CLSM with similar capabilities is suitable |
EHA105 | VWR | 104013-310 | We use the stock in the Citovsky bacterial lab stock collection |
Gateway BP Clonase II | Invitrogen | #11789100 | |
Gateway LR Clonase II | Invitrogen | #11791020 | |
GV3101 | VWR | 104013-296 | We use the stock in the Citovsky bacterial lab stock collection |
ImageJ | https://imagej.nih.gov/ij/download.html | ||
MES | Sigma-Aldrich | #69889-10G | |
MgCl2 | Sigma-Aldrich | #63068-250G | |
NaCl | Sigma-Aldrich | #S5886-500G | |
Nicotiana benthamiana seeds | Herbalistics Pty | RA4 or LAB | We use the stock in the Citovsky seed lab stock collection |
pDONR207 | Invitrogen | #12213013 | |
pPZP-RCS2A-DEST-EGFP-N1 | N/A | Refs. 15, 28 | |
pPZP-RCS2A-DEST-mRFP-C1 | N/A | Generated based on the pPZP-RCS2A-DEST-EGFP-C1 construct (see refs. 15, 28) | |
pPZP-RCS2A-DEST-mRFP-N1 | N/A | Generated based on the pPZP-RCS2A-DEST-EGFP-N1 construct | |
Rifampicin | Sigma-Aldrich | #R7382-5G | |
Spectinomycin | Sigma-Aldrich | #S4014-5G | |
Syringes without needles | BD | 309659 | |
Zen software for CLSM imaging | Zeiss | ZEN 3.0 version | The software should be compatible with the CLSM used |