Analysis of the dysmenorrhea model experiment
There was no writhing response within 30 min in the control group because these rats were not intraperitoneally injected with oxytocin and estradiol benzoate to cause pain. The rats in the model, CR, and CRV groups displayed substantial writhing reactions following the oxytocin injection. These outcomes demonstrate the efficacy of the estradiol benzoate and oxytocin combination for inducing dysmenorrhea. The differences in the PGF2α, PGE2, and PGF2α/PGE2 levels between the model and the control groups were significant (P < 0.001, P < 0.05), demonstrating the model's efficacy (Figure 1).
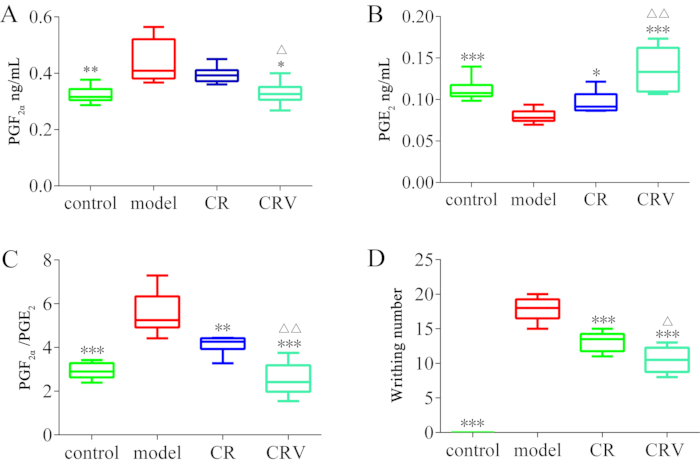
Figure 1: The PGF2α and PGE2 content in the uterine tissue and the writhing number in each group. (A) The PGF2α content in the uterine tissue in each group. (B) The PGE2 content in the uterine tissue in each group. (C) The PGF2α/PGE2 content in the uterine tissue in each group. (D) The writhing number in each group. The columns represent the mean ± SEM from four groups (six mice per group). * P < 0.05 or ** P < 0.01 represent a significant difference compared to the model group, and ΔP < 0.05 or ΔΔP < 0.01 represent a significant difference compared to the CR group. The rats in the model, CR, and CRV groups displayed a substantial writhing reaction following the oxytocin injection. Abbreviations: PG = prostaglandin; CR = Cyperi rhizome; CRV = CR processed with vinegar. Please click here to view a larger version of this figure.
The concentrations of PGF2α and PGF2α/PGE2 were reduced in the CRV and CR groups, and this reduction was more marked in the CRV group. There were also significant (P < 0.001 and P < 0.05) differences in the concentrations of PGF2α and PGF2α/PGE2 between the CRV and the CR groups. Compared to the model group, the PGE2 concentration was significantly greater in the CRV and CR groups (P < 0.001), with the level increasing the most in the CRV group.
Quality control
A good correspondence was observed between the retention times of the BPC chromatographic peaks and signal intensities in the quality control samples, demonstrating a high level of instrument stability and remarkably consistent data quality (Supplementary File 1-Supplementary Figure 1 and Supplementary Figure 2). Furthermore, all the quality control samples were within ±2 standard deviations (Figure 2A,B), and the correlation between the quality control samples was greater than 0.7 (Figure 2C,D). These results suggest that the procedure was reliable and that the results were credible.
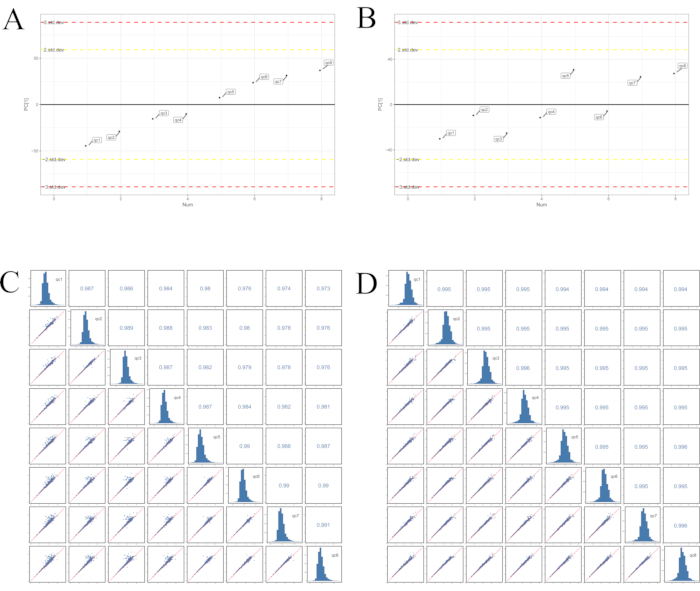
Figure 2: PCA-X one-dimensional distribution of the quality control samples. (A) Positive mode, (B) negative mode; correlation analysis of the quality control samples in (C) positive mode and (D) negative mode. All the quality control samples were within ±2 standard deviations, and the correlations between the quality control samples were greater than 0.7. These results suggested that the procedure was reliable and the information was credible. Abbreviations: PC = principal component; PCA = principal component analysis; quality control; CR = Cyperi rhizome; CRV = CR processed with vinegar. Please click here to view a larger version of this figure.
Principal component analysis
As shown in Figure 3, the abscissa PC (1) indicated the scores of the first principal components, while the ordinate PC (2) indicated the scores of the second principal components. In the figure, the green circle indicates the control group, the red circle represents the model group, the blue circle indicates the CR group, the white circle denotes the CRV group, and the pink circle indicates the quality control group.
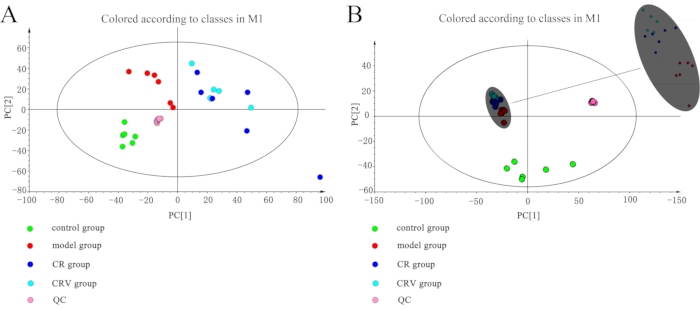
Figure 3: Score scatter plot of the PCA. (A) Positive mode and (B) negative mode. The quality control samples overlap, which indicates that the instrument was very stable. Each group is distributed in its own area, with only the CR group and the CRV group occasionally crossing paths. Abbreviations: PC = principal component; PCA = principal component analysis; QC = quality control; CR = Cyperi rhizome; CRV = CR processed with vinegar. Please click here to view a larger version of this figure.
The PCA analysis results demonstrated that the clusters of the CR and the model groups were significantly separated in both the positive and negative ion modes. The clusters were significantly separated between the CRV and model groups in the positive and negative ion modes. The quality control, model, and control groups were separated from the other treatment groups (CR, CRV). The CR and CRV groups occasionally overlapped in the positive ion mode. In the negative ion mode, each group was separated significantly.
Orthogonal partial least squares method discriminant analysis
OPLS-DA was used to screen for metabolic differences. The OPLS-DA scatter plot showed that all the samples were within the 95% confidence interval (Hotelling's T-square ellipse). Figure4A,C demonstrate that the CR and CRV groups were separated. Model overfitting was tested using the permutation test (n = 200), and the model's statistical significance was assessed. In Figure 4B,D, the ordinate depicts the value of R2Y or the Q2 value, and the abscissa indicates the replacement retention. R2Y is represented by the green dot, Q2 is represented by the blue square dot, and the two dashed lines represent their corresponding regression lines. In the positive and negative modes, the R2Y values were 0.8 and 0.84, and the Q2 values were −0.59 and −0.57, respectively. This demonstrates the model's high reliability and the absence of overfitting.
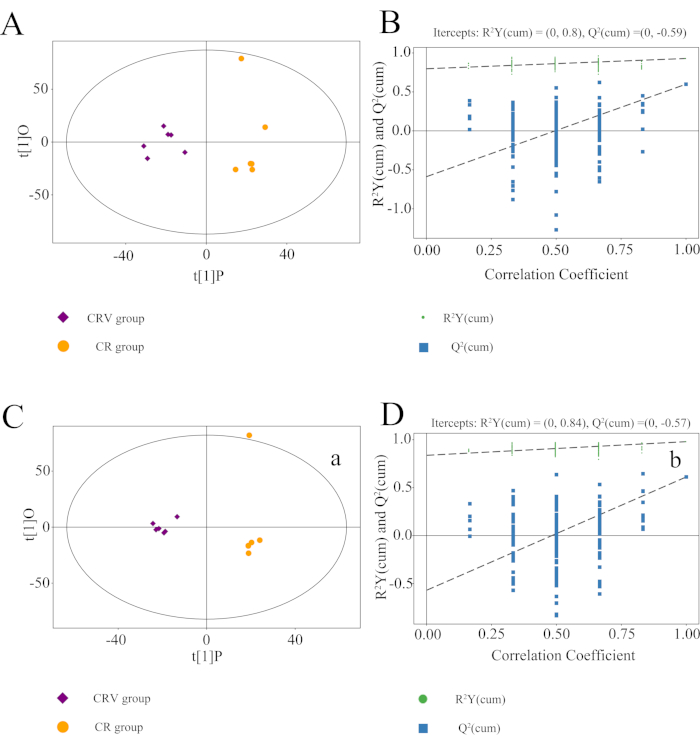
Figure 4: OPLS-DA models for the CR group versus the CRV group. Score scatter plot in (A) positive mode and (C) negative mode. Permutation test of the OPLS-DA model for the CR group versus the CRV group in (B) positive mode and (D) negative mode. R2Y was 0.8 and 0.84, and Q2 was −0.59 and −0.57 in the positive and negative modes, respectively. This demonstrates the model's high reliability and the absence of overfitting behavior. Abbreviations: OPLS-DA = orthogonal partial least squares discriminant analysis; CR = Cyperi rhizome; CRV = CR processed with vinegar. Please click here to view a larger version of this figure.
Univariate statistical analysis
Univariate statistical analyses were performed to identify metabolic variations. Under the standard screening of VIP > 1 and P < 0.05, 339 and 394 potential differential metabolites were detected in the positive and negative ion modes, respectively. A volcano plot is shown in Figure 5, wherein each point corresponds to a different metabolite. The ordinate shows the P value of the Student's t-test, and the abscissa reflects multiple changes in the level of each molecule in the group. The scatter size represents the VIP value of the OPLS-DA model; the VIP value increases with the size of the scatter. The red dots indicate an increase, the blue dots indicate a decrease, and the gray indicates no significant difference.
A qualitative analysis of the candidate differential metabolites was performed using secondary mass spectrometry. Significant changes were observed in 63 metabolites in positive mode (Supplementary File 1-Supplementary Table 1) and in 30 metabolites in negative mode (Supplementary File 1-Supplementary Table 2). The differential metabolites were determined using the KEGG and HDMB databases. The accurately matched compounds were identified as differential metabolites, and these are listed in Table 3 and Table 4.
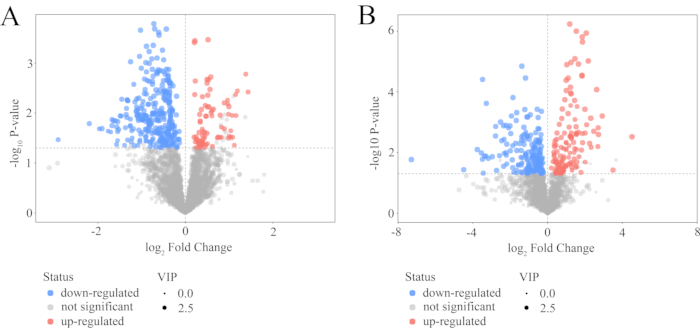
Figure 5: Volcano plot for the CR group versus the CRV group. (A) Positive mode and (B) negative mode. In the volcano graph represented, each point corresponds to a different metabolite. The ordinate shows the P value of the Student's t-test, and the abscissa reflects the multiple changes in each substance in the group. The scatter size represents the VIP value of the OPLS-DA model. The VIP value increases with the size of the scatter. Red dots indicate increases, blue dots indicate decreases, and gray indicates no significant differences. Abbreviations: OPLS-DA = orthogonal partial least squares discriminant analysis; VIP = variable significance in the projection; CR = Cyperi rhizome; CRV = CR processed with vinegar. Please click here to view a larger version of this figure.
Metabolite comparisons
The Euclidean distance matrix of the quantitative values of the differential metabolites between the CR and CRV groups was calculated, and the differential metabolites were clustered using a comprehensive correlation approach.
The abscissa represents different experimental groups, while the ordinate represents the relative level in Figure 6. The placement of the color patches indicates how each metabolite is expressed relative to the others. In the positive ion mode, compared with the CR group, the levels of four differential metabolites in the CRV group increased, while the levels of 11 differential metabolites decreased. In the negative ion mode, compared with the CR group, the levels of four differential metabolites in the CRV group increased, and the levels of 7 differential metabolites decreased.
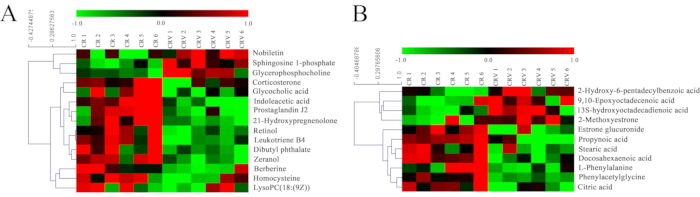
Figure 6: Heatmap analysis for the CRV group versus the CR group. (A) Positive mode and (B) negative mode. The abscissa represents the different experimental groups, and the ordinate represents the relative expression levels. The placement of the color patches indicates how each metabolite is expressed relative to the others. Abbreviations: CR = Cyperi rhizome; CRV = CR processed with vinegar. Please click here to view a larger version of this figure.
Compared with the CR group, the metabolites that increased in the CRV group were sphingosine 1-phosphate, nobiletin, glycerophosphocholine, lysopc(18:1(9z)), 2-hydroxy-6-pentadecylbenzoic acid, 9,10-epoxyoctadecenoic acid, 13s-hydroxyoctadecadienoic acid, and 2-methoxyestrone, while those that decreased were corticosterone, indoleacetic acid, glycocholic acid, berberine, dibutyl phthalate, retinol, leukotriene B4, prostaglandin J2, 21-hydroxypregnenolone, zeranol, homocysteine, propynoic acid, stearic acid, docosahexaenoic acid, phenylacetylglycine, L-phenylalanine, estrone glucuronide, and citric acid (Figure 7).
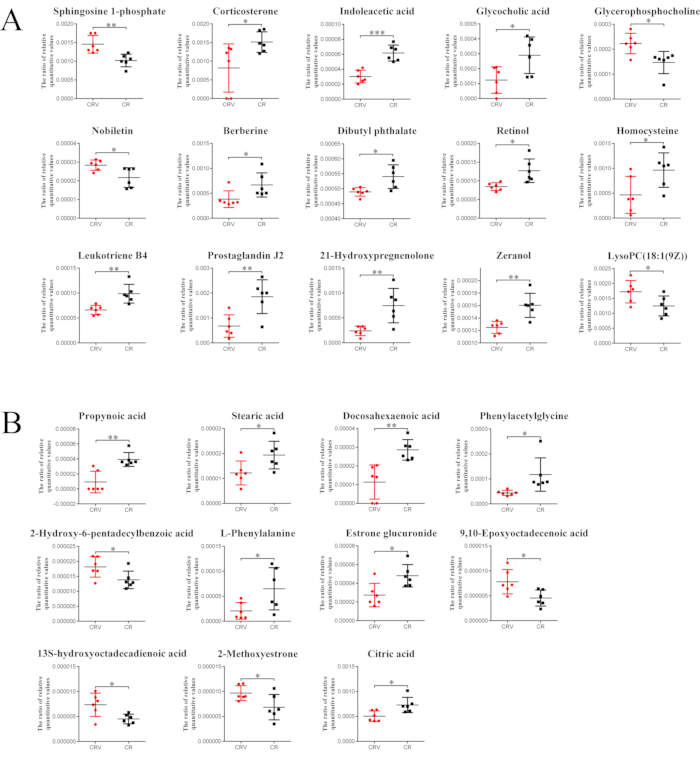
Figure 7: The relative level trends of the potential metabolites in the CRV and CR groups. (A) Positive modeand (B) negative mode. In the positive mode, compared with the CR group, the levels of four differential metabolites increased in the CRV group, and the levels of 11 decreased. In the negative mode, the levels of four differential metabolites increased in the CRV group, and the levels of seven differential metabolites decreased. The columns represent the mean ± SEM from four groups (six mice per group). * P < 0.05, ** P < 0.01, or *** P < 0.01 represent a significant difference between the CRV and CR groups. Abbreviations: CR = Cyperi rhizome; CRV = CR processed with vinegar. Please click here to view a larger version of this figure.
KEGG pathway analysis
The differential metabolites were annotated, and the KEGG pathways were analyzed. The results showed that the differential metabolites were associated with nine pathways in the positive and negative modes, respectively (Table 1 and Table 2). In Figure 8, the metabolic pathways are each represented by a bubble in the bubble chart, with a more significant scale indicating a greater effect factor. The size of the path influencing the factors in the topology analysis is represented by the abscissa of the bubble chart and the bubble size. The ordinate of the bubble chart and the bubble color indicates the P value of the enrichment analysis (taking the negative natural logarithm, i.e., −ln (p)). The degree of enrichment is more significant, the P value is smaller, the ordinate value is more prominent, and the color is darker. The P value and impact value are two very important indicators in the selection of critical pathways. Generally, the P value is more important than the impact value.
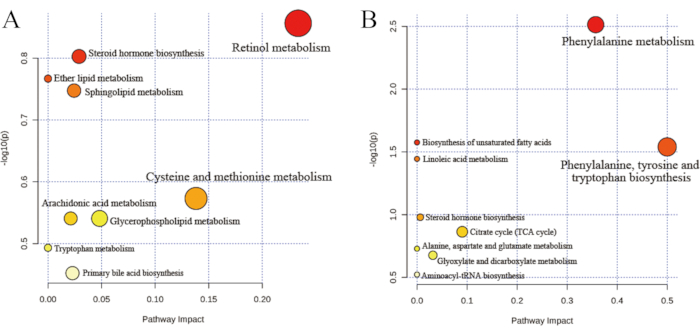
Figure 8: Pathway analysis for the CRV group versus the CR group. (A) Positive mode and (B) negative mode. The metabolic pathways are each represented by a bubble in the bubble chart. The abscissa of the bubble chart and the bubble size indicate the size of the path-influencing factors in the topology analysis. The ordinate of the bubble chart and the bubble color indicate the P value of the enrichment analysis. The key metabolic pathways include the biosynthesis of unsaturated fatty acids and linoleic acid metabolism. Abbreviations: CR = Cyperi rhizome; CRV = CR processed with vinegar. Please click here to view a larger version of this figure.
Table 3 and Table 4 show metabolic pathways with significant differences-phenylalanine metabolism and linoleic acid metabolism, as well as the biosynthesis of unsaturated fatty acids, phenylalanine, tyrosine, and tryptophan. Although the metabolic pathways included steroid hormone biosynthesis, sphingolipid and arachidonic acid metabolism, there were no significant differences, which were related to dysmenorrhea. The results showed that linoleic acid metabolism and the biosynthesis of unsaturated fatty acids were the critical metabolic pathways associated with the enhanced efficacy of CRV.
Constituents absorbed into the blood
Fifteen constituents and two products of metabolism from the CRV and CR extracts were detected in the rat serum in the CR and CRV groups (Table 5). All 17 components were found in positive ion mode.
The relative constituent levels in the blood samples of the two groups were compared using the Student's t-test. The abscissa in Figure 9 displays various experimental groups; the ordinate represents the response value of the mass spectrum. There were two components with significant differences. The analysis showed that the levels of these two components were elevated in the CRV group compared to the CR group, while the levels of 15 elements showed no significant changes.
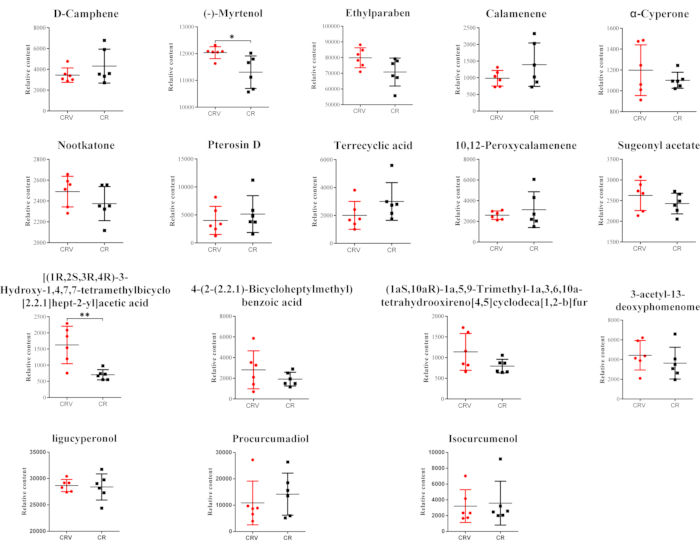
Figure 9: Constituents absorbed into the blood for the CRV group versus the CR group. There were 15 constituents and two products of metabolism from the CRV and CR extracts in the rat serum in the CR and CRV groups. The analysis showed that blood levels of two components were increased in the CRV group compared to the CR group, while the blood levels of 15 components showed no significant changes. Among them, the level of (-)-myrtenol and [(1R,2S,3R,4R)-3-hydroxy-1,4,7,7-tetramethylbicyclo[2.2.1]hept-2-yl]acetic acid in the CRV group was considerably higher than in the CR group. * P < 0.05 or ** P < 0.01 represent a significant difference between the CRV group and the CR group. Abbreviations: CR = Cyperi rhizome; CRV = CR processed with vinegar. Please click here to view a larger version of this figure.
Table 1: Metabolic differences in positive mode. Abbreviations: KEGG = Kyoto Encyclopedia of Genes and Genomes; VIP = variable significance in the projection; RT = retention time. Please click here to download this Table.
Table 2: Metabolic differences in negative mode. Abbreviations: KEGG = Kyoto Encyclopedia of Genes and Genomes; VIP = variable significance in the projection; RT = retention time. Please click here to download this Table.
Table 3: Metabolic pathway analysis in positive mode. Abbreviation: KEGG = Kyoto Encyclopedia of Genes and Genomes. Please click here to download this Table.
Table 4 Metabolic pathway analysis in negative mode. Abbreviation: KEGG = Kyoto Encyclopedia of Genes and Genomes. Please click here to download this Table.
Table 5: Identification of the prototype ingredients and metabolites in rat serum. Note: M1 and M2 are metabolites; other constituents are prototype ingredients. Please click here to download this Table.
Supplementary File 1: BPC diagrams and MS2 chromatogram of the constituents absorbed into the blood of nude mice. BPC diagrams of all the quality control samples in positive and negative modes; MS2 chromatogram of the 17 constituents absorbed into the blood of the rats: D-camphene, (-)-myrtenol, ethylparaben, calamenene, α-cyperone, (+)-nootkatone, (1R,2S,3R,4R)-3-hydroxy-1,4,7,7-tetramethylbicyclo[2.2.1]hept-2-yl]acetic acid, 4-(2-(2.2.1)-bicycloheptylmethyl)benzoic acid, 10,12-peroxycalamenene, (1aS,10aR)-1a,5,9-trimethyl-1a,3,6,10a-tetrahydrooxireno[4,5]cyclodeca[1,2-b]furan-10(2H)-one, pterosin D, terrecyclic acid, sugeonyl acetate, 3-acetyl-13-deoxyphomenome, isocurcumenol, ligucyperonol, procurcumadiol. The differential metabolites identified by secondary mass spectrometry, as well as the HDMB and KEGG databases, in the positive and negative ion modes are also included. Please click here to download this File.
Due to the wide variety and different nature of TCMs, these herbs sometimes do not work in clinical practice, and this may be due to the inappropriate processing and decocting of TCMs. The mechanisms of TCM are becoming more apparent with the use of contemporary science and technology29,30. This study shows that both CR and CRV have therapeutic effects in PD model rats and that the therapeutic effect of CRV is more substantial. The mechanism of action of CRV could be related to the fact that vinegar processing may influence the constituents of CR that are absorbed into the blood and could be associated with linoleic acid metabolism and the biosynthesis of unsaturated fatty acids. Figure 10 depicts the potential pathways of CRV's action in pain relief.
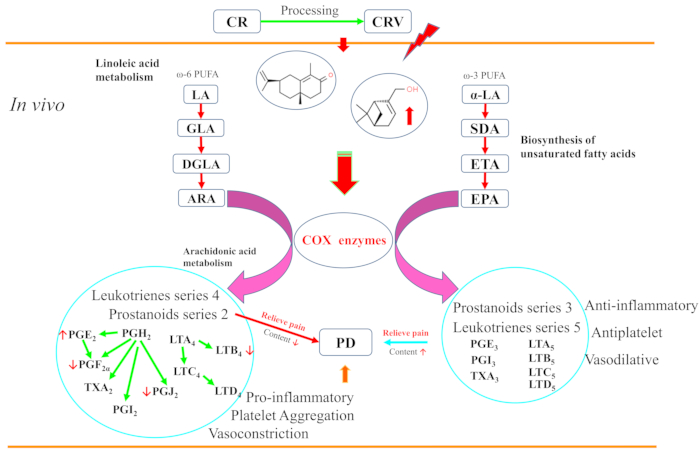
Figure 10: Mechanisms of the enhanced analgesic effect of CRV. The results showed that 15 constituents and two metabolites were found in the blood. Among them, the levels of (-)-myrtenol and [(1R,2S,3R,4R)-3-hydroxy-1,4,7,7-tetramethylbicyclo[2.2.1]hept-2-yl]acetic acid in CRV group were considerably higher than in the CR group. CRV can reduce the level of 2-series prostanoids and 4-series leukotrienes made from ARA and achieve analgesic effects via the modulation of arachidonic acid metabolism, the biosynthesis of unsaturated fatty acids, and linoleic acid metabolism. Abbreviations: ARA = arachidonic acid; COX = cyclooxygenase; LA = linoleic acid; PUFA = polyunsaturated fatty acids; GLA =γ–linolenic acid; DGLA = dihomo-γ-linolenic; PD = primary dysmenorrhea; PG = prostaglandin; LT = leukotrienes; TX = thromboxane; SDA = stearidonic acid; ETA = eicosatetraenoic acid; EPA = eicosapentaenoic acid; CR = Cyperi rhizome; CRV = CR processed with vinegar. Please click here to view a larger version of this figure.
Precautions during the experiment
Since the oil of the effective component of CR is volatile, the time for extracting the CR should not exceed 20 min, and when it boils, it should be on a low heat with a temperature not exceeding 60°C during concentration. To ensure the successful extraction of the effective ingredients, the herbs must be soaked in water for at least 2 h before decoction so that the herbs are wet when soaking is complete. During the CR processing, the vinegar must be well mixed with the herbs so that the vinegar can fully penetrate into them. If the vinegar volume is too low to wet the herbs thoroughly, a small amount of water can be added to dilute the vinegar, and then the vinegar can be fully mixed with the herbs. When mixing is complete, the herbs will absorb all the vinegar. Since vinegar contains acetic acid, the mixture should not come into contact with iron to avoid a chemical reaction.
In the rat experiment, the first intraperitoneal injection of estradiol benzoate is given on day 10, then the intragastric administration of the extract of CR or CRV is given, and, finally, the intraperitoneal injection of oxytocin is administered. After the intraperitoneal injection of oxytocin, the animal is observed for 30 min, and blood is immediately taken. Usually, the blood concentration reaches a peak within 1 h after intragastric administration13, which is the best time to take blood.
When determining the extract and serum samples by LC-MS/MS, they should be determined in the same batch to ensure that the retention time of the same component in different samples is consistent. In this experiment, the identification of the components was a difficult point. Although a relatively mature database can be used for endogenous metabolites, there was no matching database for identifying the constituents absorbed into the blood, so more care should be taken in identification.
Differences in the constituents absorbed into the blood between the CR and CRV groups
To determine the active ingredient of CR, this experiment investigated the constituents absorbed into the blood in dysmenorrhea model rats. In this experiment, it was found that 15 constituents and two metabolites in the blood differed between the CR and CRV groups. Among them, the levels of (-)-myrtenol and [(1R,2S,3R,4R)-3-hydroxy-1,4,7,7-tetramethylbicyclo[2.2.1]hept-2-yl]acetic acid in the CRV group were considerably higher than in the CR group, but the levels of other components were not significantly different. (-)-Myrtenol and [(1R,2S,3R,4R)-3-hydroxy-1,4,7,7-tetramethylbicyclo[2.2.1]hept-2-yl]acetic acid are terpenoids and are considered the effective components of CRV.
Ligucyperonol and procurcumadiol are produced by the oxidation of α-cyperone and isocurcumenol, respectively, and α-cyperone has a strong analgesic effect. The proposed mechanism of action may reduce LPS-induced COX-2 expression and PGE2 synthesis through the negative regulation of NF-kB signaling31. (+)-Nootkatone also inhibits COX-2 activity32,33. Isocurcumenol is the core component of Curcumae rhizoma in treating dysmenorrhea3, and its metabolite procurcumadiol may have an analgesic effect. Compared to the CR group, the CRV group showed considerably higher levels of (-)-myrtenol, which has an analgesic effect34. The possible mechanism of action may be that changes in the expression of COX-235 increase the levels of anti-inflammatory cytokine (IL-10, IFN-γ) and reduce the levels of pro-inflammatory cytokines (TNF-α, IL-1β) levels36. Processing with vinegar improves the levels of the active ingredients in the blood, which may be why products produced with vinegar are more effective.
Differences in the metabolic pathways between the CR and CRV groups
Pathway analysis showed significantly different metabolic pathways between the CR and CRV groups, including in terms of phenylalanine metabolism, the biosynthesis of unsaturated fatty acids, phenylalanine, tyrosine, and tryptophan biosynthesis, and linoleic acid metabolism. However, the metabolic pathways of phenylalanine metabolism and phenylalanine, tyrosine, and tryptophan biosynthesis are not related to PD. These results show that the metabolic pathways associated with the enhanced efficacy of CRV are linoleic acid metabolism and the biosynthesis of unsaturated fatty acids.
Unsaturated fatty acids include two types: omega-3 and omega-637. Three precursors of mediators, including eicosapentaenoic acid (20:5ω3; EPA), docosahexaenoic acid (22:5ω3; DHA), and arachidonic acid (20:5ω6; ARA), are involved in the biosynthesis of unsaturated fatty acids pathway37,38. EPA and ARA metabolism both produce prostaglandins and leukotrienes under the action of COX. ARA produces 2-series prostanoids, including PGF2α, PGE2, PGI2, and thromboxane (TXA2, TXB2), and 4-series leukotrienes, including leukotriene A4 (LTA4) leukotriene B4 (LTB4), leukotriene C4 (LTC4), and leukotriene D4 (LTD4). The 3-series prostanoids include prostaglandin E3 (PGE3), prostacyclin I3 (PGI3), and thromboxane A2 (TXA3), and the 5-series leukotrienes include leukotriene A5 (LTA5) leukotriene B5 (LTB5), leukotriene C5 (LTC5), and leukotriene D5 (LTD5), which are largely produced by EPA.
The transformation process of EPA is the same as that of ARA and is mediated by similar enzymes39. The 2-series prostanoids and 4-series leukotrienes mainly have pro-inflammatory, platelet aggregation, and vasoconstriction effects. In contrast, 3-series prostanoids and 5-series leukotrienes show anti-inflammatory, antiplatelet, and vasodilatory effects38. TXA2 and TXB2 are produced from ARA, causing the blood vessels to narrow. EPA-derived PGI3, PGE3, and TXA3 act only as vasodilators38,40. EPA and ARA compete for conversion into PGs by the COX enzyme. When the membrane EPA/AA ratio is increased, the eicosanoids PGI2 and TXA2, which promote aggregation, can be transformed into TXA3 and PGI3, which promote anti-aggregation, resulting in anti-inflammatory and anti-aggregatory effects40. Additionally, the combined use of EPA, DHA, and linoleic acid (C18:2ω6; LIN) can reduce PGF2α and PGE2 release in bovine endometrium and trophoblasts41,42.
PD is likely caused by the production of PGs and leukotrienes43,44,45, particularly PGs46. Meanwhile, an imbalance in vasopressin, β-endorphins, estrogen, progesterone, neurotransmitters, IL, ET-1, and NO may also be related to dysmenorrhea47. According to the ELISA results, the PGF2α and PGF2α/PGE2 levels in the CRV group decreased, while the PGE2 level increased relative to the CR group. Additionally, leukotriene B4 (C02165) and prostaglandin J2 (C05957) were lower in the CRV group. This indicates that, in the CRV group, there were lower levels of 2-series prostanoids made from ARA, including PGF2α, which is the most important factor for dysmenorrhea. Therapy with PGE2 at high concentrations dilates the blood vessels, and PGE2 causes vasoconstriction at low concentrations48. Therefore, the uterus is relaxed with vasodilation, and dysmenorrhea is relieved.
As the human body cannot synthesize a sufficient amount of C18 unsaturated fatty acids, linoleic acid and α-linolenic acid, which are the only source of C18 unsaturated fatty acids, are very important38. Linoleic acid and α-linolenic acid are the source of omega-6 and omega-3 unsaturated fatty acid metabolism, respectively. In particular, the precursor of prostaglandin synthesis is ARA, and ARA is synthesized from linoleic acid49. Linoleic acid is a precursor, and a series of metabolites are synthesized from it, including ARA, prostaglandins (PGF2α, PGE2), prostacyclin (PGI2), and thromboxane (TXA2)50. Linoleic acid is closely related to the enhanced analgesic effect of CRV. Furthermore, the metabolic pathway of steroid hormone biosynthesis can produce progesterone51,52,53 and sphingosine-1-phosphate (C06124), which are produced by the metabolic pathway of sphingolipid metabolism, induce COX-2, and produce PGE2 through TNF54,55,56,57. These may also be related to PD.
There are some limitations to the protocol. Only the relative levels of the constituents were compared, and the standard sample was not used to quantify the constituents in the herb and those absorbed into the blood. The feces and urine of rats were not collected in the animal experiments, resulting in the discovery of fewer metabolites of CR in vivo. Validation experiments should further confirm the mechanism discovered by the metabonomics analysis.
The strategy and protocol used in this study avoided blindness in the study of chemical components in vitro and the one-sided study of individual components in vivo. Therefore, it was very suitable for mechanism exploration. The strategy can save a lot of time and work and can accurately identify the critical constituents and mechanism for therapeutic efficacy.
In this study, it was found that there were 15 constituents and two metabolites in the blood. Among them, the levels of (-)-myrtenol and [(1R,2S,3R,4R)-3-hydroxy-1,4,7,7-tetramethylbicyclo[2.2.1]hept-2-yl]acetic acid were significantly increased in the CRV group compared to the CR group, showing that processing with vinegar can increase the levels of the active ingredients in the blood. After CR was processed with vinegar, the levels of 2-series prostanoids and 4-series leukotrienes with pro-inflammatory, platelet aggregation, and vasoconstriction properties decreased, including PGF2α, leukotriene B4, and prostaglandin J2. This may be the mechanism by which CRV demonstrates an enhanced analgesic effect.
