An erratum was issued for: External Cephalic Version: Is it an Effective and Safe Procedure?. Figure 1 was updated from:
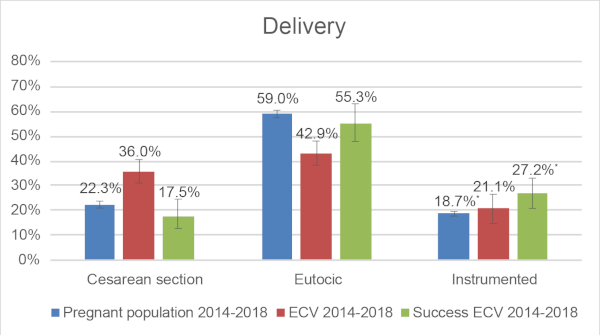
Figure 1: Comparison of type of delivery: General pregnant population in 2018, ECV cohort between 2014-2018, Successful ECV cohort between 2014-2018. * Chi-squared test: p<0.05. Please click here to view a larger version of this figure.
to:

Figure 1: Comparison of type of delivery: General pregnant population in 2018, ECV cohort between 2014-2018, Successful ECV cohort between 2014-2018. * Chi-squared test: p<0.05. Please click here to view a larger version of this figure.