Trabecular Bone Microarchitecture Evaluation in an Osteoporosis Mouse Model
Summary
This protocol presents an economical and efficient method for quantitative evaluation of bone microarchitecture in a mouse model of osteoporosis by combining Hematoxylin-Eosin (HE) staining and micro-computed tomography (Micro-CT) techniques.
Abstract
Bone microstructure refers to the arrangement and quality of bone tissue at the microscopic level. Understanding the bone microstructure of the skeleton is crucial for gaining insight into the pathophysiology of osteoporosis and improving its treatment. However, handling bone samples can be complex due to their hard and dense properties. Secondly, specialized software makes image processing and analysis difficult. In this protocol, we present a cost-effective and easy-to-use solution for trabecular bone microstructure analysis. Detailed steps and precautions are provided. Micro-CT is a non-destructive three-dimensional (3D) imaging technique that provides high-resolution images of trabecular bone structure. It allows for the objective and quantitative evaluation of bone quality, which is why it is widely regarded as the gold standard method for bone quality assessment. However, histomorphometry remains indispensable as it offers crucial cellular-level parameters, bridging the gap between two-dimensional (2D) and 3D assessments of bone specimens. As for the histologic techniques, we chose to decalcify the bone tissue and then perform traditional paraffin embedding. In summary, combining these two methods can provide more comprehensive and accurate information on bone microstructure.
Introduction
Osteoporosis is a prevalent metabolic bone disease, especially among the elderly, and is associated with an increased risk of fragility fractures. As osteoporosis becomes more common in China1, there will be a growing demand for studying the bone structures of small animals2,3. The previous methods of measuring bone loss rely on the outcomes of two-dimensional dual-energy x-ray absorptiometry. However, this does not capture the changes in the architectural microstructure of the trabecular bone, which is a key factor for skeletal strength4. The microstructure of bone affects its strength, stiffness, and fracture resistance. By comparing bone microarchitecture in normal and pathological states, changes in bone tissue morphology, structure, and function caused by osteoporosis can be identified. This information contributes to the understanding of the development of osteoporosis and its association with other diseases.
Micro-computed tomography (Micro-CT) imaging has recently become a popular technique for bone morphology assessment, where it can provide accurate and comprehensive data on bone structure and density parameters such as bone volume fraction, thickness, and separation5,6. At the same time, the Micro-CT results can be affected by the analysis software7. Different methods of image acquisition, evaluation, and reporting are used by various commercial Micro-CT systems. This inconsistency makes it hard to compare and interpret the results reported by different studies5. Also, it cannot currently replace bone histomorphometry in providing researchers with information on cellular-level parameters in the skeletal system8. Meanwhile, histologic techniques allow direct observation and measurement of the microscopic morphology of bone. Hematoxylin and eosin (HE) staining is a common staining technique used in histology to visualize the general structure of cells and tissues. It is used to identify the presence of bone tissue and its microarchitecture.
This article uses Micro-CT combined with tissue slicing technique (Hematoxylin-Eosin [HE] staining) to collect bone tissue images and perform quantitative analysis of trabecular bone to evaluate the changes of bone microstructure in an osteoporosis mouse model.
Protocol
The animal protocol has been approved by the Animal Ethical Committee of Chengdu University of Traditional Chinese Medicine (Record number: 2020-34). Female C57BL/6J mice (12-week old, n = 14) were divided into two groups randomly, a sham-operated group (Sham group, n = 7) and a model group (OVX group, n = 7). Animals were purchased from a commercial supplier (see Table of Materials). All mice were kept in individual cages at 22-26 °C with 45%-55% humidity, allowed to adapt to their new environment for 1 week, and provided free access to water and diet. All animal experimental studies were conducted at Chengdu University of Traditional Chinese Medicine, and all efforts were made to minimize animal suffering.
1. Animal model preparation
- Anesthetize the 12-week-old mouse by intraperitoneal injection with 1.25% Avertin (Tribromoethanol in tert-amyl alcohol, see Table of Materials) at a dosage of 0.02 mL/g. Position the mouse prone on a sterile surgical operating table, and immobilize its limbs by taping them securely.
- Use scissors (see Table of Materials) to trim any hair that may affect the surgical operation.
NOTE: It is recommended to avoid skin damage while preparing the surgical site. - Wash hands thoroughly and put on surgical gloves. Disinfect the mouse's back three times with povidone-iodine (see Table of Materials), and use medical gauze (see Table of Materials) to dry it off.
NOTE: Be cautious; getting the hair too wet during disinfection may lead to postoperative hypothermia in mice. - Make an incision approximately 0.5-1.0 cm long, located 1 cm away from one-third of the midline of the mouse's back, using a scalpel (see Table of Materials). Gently separate the fascia and cut through the muscle with tissue scissors (see Table of Materials) until the ovary is visible. Ligate the surrounding blood vessels with non-absorbable sutures (see Table of Materials) and remove the ovary.
- Rinse the cavity using 0.9% saline solution, then suture the skin, muscle, and fascia separately (see Table of Materials).
- Repeat the same sequence of steps on the other side.
- Remove peri-ovarian fat of the same size as the ovary, and perform the same surgery procedure mentioned above for the remaining steps to establish the sham-operated model.
- Allow a recovery period of 1 week after the surgery. After 8 weeks, osteoporotic mouse models will be successfully established9,10.
2. Micro-CT scanning
- Euthanize the mouse by excess CO2 inhalation. Remove as much soft tissue as possible from the mouse femur after euthanasia and obtain a fresh sample for scanning.
NOTE: While there is no perfect solution for sample preservation, certain steps can be taken to maximize the quality of Micro-CT scan results. Before fixation, take care to remove as much surrounding tissue as possible. Formalin or buffered formalin is the most preferred method of fixation with storage in PBS11,12. - Double-click the micro-CT imaging system software icon on the desktop to start the system (see Table of Materials). Select a sample bed compatible with the sample field of view (FOV) of 18 mm x 18 mm. Load the appropriate sample bed into the machine and close the hatch.
- Click the Warm-up button in the Control Panel.
NOTE: A short warm-up time was required. Do not attempt to open the hatch when X-rays are being generated. Check the X-Ray On light on the front panel and computer monitor to confirm if X-rays are being generated. - Click the Menu button to set a new database, then create a new sample and study.
- Select Manual from the Menu drop-down list and enter custom voltage and current values in the Control Panel. Set Voltage (kV) para 90, Current (µA) para 80, Scan Mode para High resolution, 14 min, and FOV (mm) para 18 mm x 18 mm.
NOTE: Refer to the manual for different micro CT systems to set the appropriate parameters. - Position the bone securely with plastic film in the sample bed. Close the hatch. Ensure that the subject is centered precisely in the X-capture window by pressing the adjustment buttons on the machine.
NOTE: Adjusting the sample must be slow and gentle to avoid it falling into the machine by accident. - Click the Start button to start the CT scan.
3. CT data analysis
- Enter the software (see Table of Materials), and select the data to be analyzed. Click Sub and set Pixel Size para 10 µm. Move and resize the region of interest (ROI) to include the distal femur above the growth plate. Click on Start (see Figure 1).
NOTE: The subvolume reconstruction pixel size was selected at 10 µm since the thickness of the imaging trabeculae was estimated to be about 20-30 µm based on histological data from previous studies13. If the signal-to-noise ratio is insufficient for data processing, a high-resolution 1 h scan must be performed. - Click the Analysis 3D button to get the resulting 3D reconstruction.
- Export the data from the micro-CT system to the computer for analysis.
- Import the reconstructed CT data. Click Process > Image Calculator, then click Region Pad > Interactive. Adjust the yellow checkbox to the appropriate ROI.
NOTE: The region of interest (ROI) begins approximately 540 µm proximal to the growth plate and extends 1600 µm proximally to assess the actual bone metabolism and remodeling. - Select the Bone Microarchitecture Analysis (BMA) add-on (see Table of Materials). Click Segment Cortex and then Segment Trabeculae.
NOTE: Both trabecular and cortical boneare automatically selected. Normally no manual adjustment is required. - Click on Save Final Object Map and then click Measure Bone to calculate bone morphometric indices.
NOTE: Only relative bone mineral density (BMD) was calculated here since no control was added.
4. Decalcification of bone tissue
- Fix the bone specimens in 4% paraformaldehyde (see Table of Materials) for 24 h. Wash the specimens thrice with PBS (see Table of Materials) for 20 min each time.
- Rinse the tissue thrice with distilled water for 20 min each time. Transfer the tissue to a decalcification solution containing EDTA (see Table of Materials) and decalcify for 30 days with a weekly solution change until endpoint.
NOTE: Needle pricking, hand pinching, and clamping are used to terminate decalcification when the bone tissue becomes soft, or there is no sense of resistance when needling. The physical method of detection can cause some damage to the tissue structure, so try to avoid excessive force or repeated testing. - Take the tissue out of the fixative and use a scalpel to trim the tissue in a fume hood. Put the trimmed tissue and the corresponding label in a dehydration box.
- Put the dehydration box in a basket and dehydrate it in a tissue processor (see Table of Materials) with gradient alcohol (75% ethanol for 4 h, 85% ethanol for 2 h, 90% ethanol for 2 h, 95% ethanol for 1 h, anhydrous ethanol for 30 min, anhydrous ethanol II for 30 min, xylene I for 5-10 min, xylene II for 5-10 min, wax I for 1 h, wax II for 1 h, wax III for 1 h).
- Use an embedding machine (see Table of Materials) to embed the wax-soaked tissue. Pour the melted wax into an embedding box and place the tissue from the dehydration box before the wax hardens.
- Orient the tissue according to the embedding surface and attach the corresponding label. Cool on a -20 °C freezing table (see Table of Materials). Remove the wax block from the embedding box after solidifying and trim the wax block as needed (see Table of Materials).
- Cut the trimmed wax block into 3 µm thick slides on a microtome (see Table of Materials). Float the slides on 40 °C warm water on a tissue spreading machine (see Table of Materials) to flatten the tissue and scoop them up with a slide.
- Bake in a 60 °C oven (see Table of Materials) until the water evaporates and the wax melts. Take out and store at room temperature (RT) for later use.
5. HE staining
- Put the slides in xylene I for 20 min, then in xylene II for 20 min. Further, put the slides in anhydrous ethanol I and anhydrous ethanol II for 5 min each, 75% alcohol for 5 min, and then wash the slides with tap water (see Table of Materials).
- Incubate in hematoxylin (see Table of Materials) for 3-5 min. Differentiate the specimens with a hydrochloric acid solution (see Table of Materials). Treat the slides with an ammonia solution (see Table of Materials) for bluing, and then wash the slides with water.
- Put the slides in 85%, 95% gradient alcohol for dehydration, and stain with eosin solution (see Table of Materials) for 5 min.
- Put the slides in anhydrous ethanol I for 5 min, anhydrous ethanol II for 5 min, and anhydrous ethanol III for 5 min. Treat the slides with xylene I for 5 min, xylene II for 5 min, and mount with neutral balsam (see Table of Materials).
- Examine each slide under the microscope. Then, choose the representative slices for panoramic scanning (see Table of Materials).
NOTE: At least three consecutive slices are required for each sample. Before panoramic scanning, the slices must be examined under a microscope to ensure that they are complete and clear. Ensure that the bone marrow cavity, cortical bone, and cancellous bone are fully displayed and that different types of bone cells can be seen.
6. HE image analysis
- Open HE images with CaseViewer software (see Table of Materials). Select the region of interest (ROI) on the slide, and save it as a color image.
NOTE: The selection of ROI is consistent with the above-mentioned software. - Open the image in ImageJ (see Table of Materials). Select the Wand tool from the toolbar. Click on the trabecular bone.
- Adjust the tolerance and contiguous settings as needed. Go to Image > Adjustments > Black & White and click OK. Repeat the steps for other areas of the bone.
- Invert the selection and fill it with white color. Save the image as a mask for analysis (see Figure 2).
NOTE: For the detailed methodology, refer to the previously published work14. - Open the mask in the analysis software15,16 (see Table of Materials). Run Process > Binary > Make Binary to convert the color image to a binary image.
- Use plugin17 (see Table of Materials) in the software to analyze structural parameters: Run Area/Volume Fraction to calculate bone volume to total volume of bone (BV/TV [%])18,19.
NOTE: This method is applicable for bone trabeculae and bone marrow, filling the entire ROI in the HE images.
Representative Results
Micro-CT analysis
We measured the trabecular microarchitectural parameters in mice from both groups and reported their mean values and SDs in Table 1. The distribution of some parameters (i.e., the ratio of bone volume to total tissue volume, trabecular thickness, trabecular separation) within each group are illustrated in Figure 3.
These results indicate significant differences between mice of OVX and Sham group for a number of parameters that were estimated from Micro-CT. Namely, the ratio of bone volume to total tissue volume (BV/TV) in the OVX group was 3% lower than that in the Sham group. The trabecular thickness in mice of OVX was lower than in those of the Sham group, with a relative difference percentage of 39.3%. The trabecular separation in OVX mice was greater than that in Sham mice. Figure 4 shows 3D displays of Trabecular ROIs extracted from reconstructed bone volume for each group. Compared with the Sham group (Figure 4A), the bone density of mice after ovariectomy, the trabeculae were sparse and showed osteoporosis (Figure 4B).
HE staining analysis
In addition, histopathological analysis confirmed the changes found in the Micro-CT analysis. After 8 weeks, HE staining showed that the trabecular bone (red) under the growth plate of the distal femur of mice after OVX was reduced compared with the Sham group, and there was almost no obvious thick trabecular structure, and a large number of fat-like granules appeared (Figure 5A). Based on the quantitative analysis of tissue sections, the OVX mice had less trabecular bone area than the Sham one (Figure 5B).
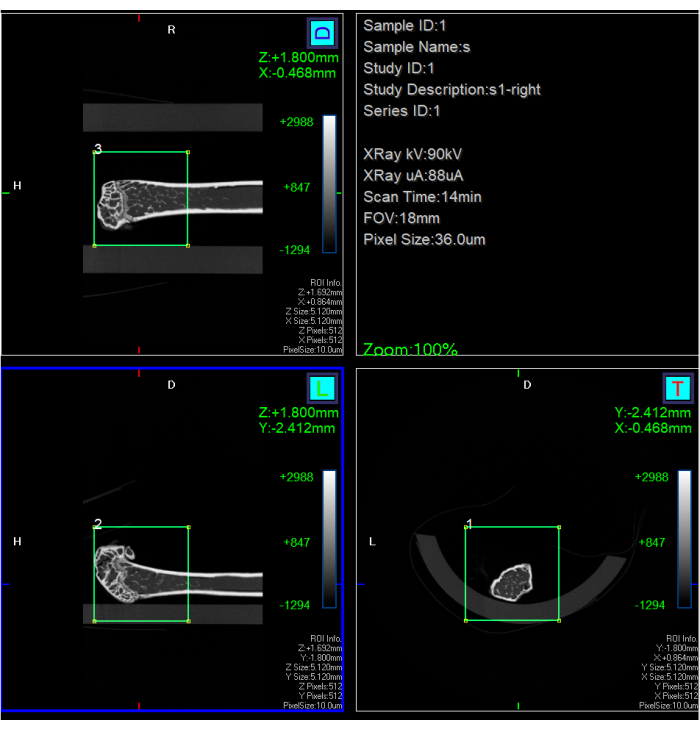
Figure 1: Screenshot of the interface of subvolume reconstruction. A subvolume reconstruction in the green rectangle to get down to 10 µm in a 5.12 mm x 5.12 mm field of view (FOV). Please click here to view a larger version of this figure.
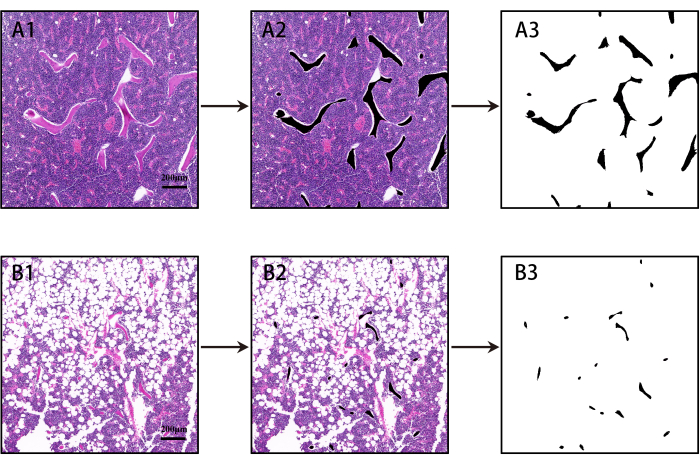
Figure 2: Image mask construction in black and white. (A1–A3): HE Images from the Sham group (Scale bar = 200 µm). Bone trabeculae are shown in black within the selected region and other tissues in white. (B1–B3) Images of OVX group (Scale bar = 200 µm). Please click here to view a larger version of this figure.
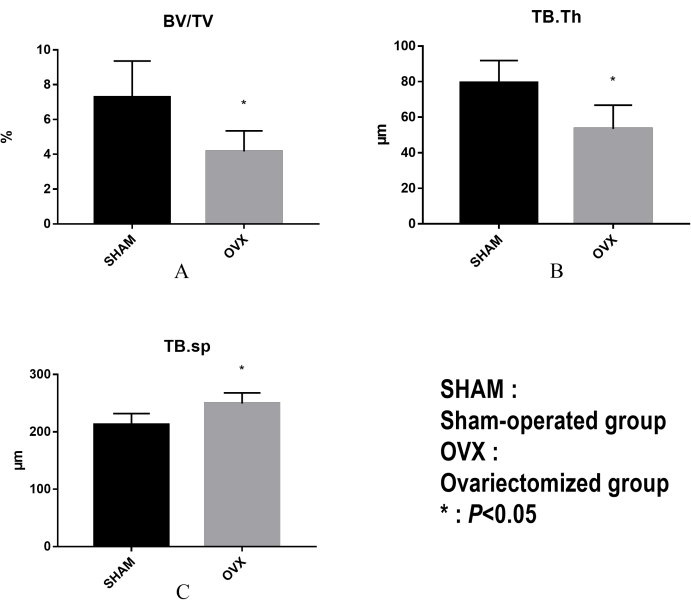
Figure 3: Comparison of microstructural parameters of distal femoral trabeculae between OVX and Sham groups. (A) The ratio of bone volume to total tissue volume (BV/TV [%]) in the OVX group was lower than that in the Sham group. (B)The trabecular thickness (TB.Th [µm]) in mice of OVX was lower than in the Sham group. (C) The trabecular separation (TB.sp [µm]) in OVX mice was greater than in Sham mice. *P < 0.05. Please click here to view a larger version of this figure.
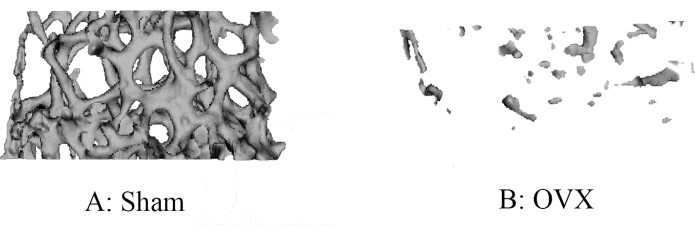
Figure 4: Representative Micro-CT images of the trabecular bone in the distal femur. Compared with the (A) Sham group, the bone density of mice after ovariectomy (B) displayed sparse trabeculae and showed osteoporosis. Please click here to view a larger version of this figure.
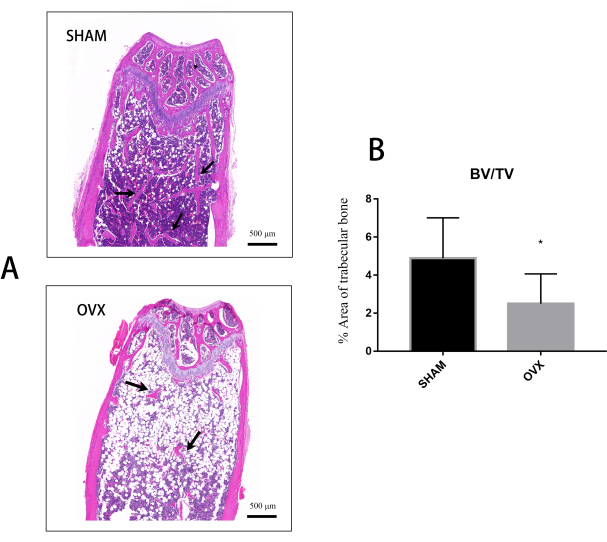
Figure 5: Histological analysis of the trabecular bone area in the distal femur of OVX and Sham groups. (A) Representative HE-stained images of the distal femur in each group (Scale bar = 500 µm). Black arrows show trabeculae. (B) The quantitative analysis of the trabecular bone area of the total tissue volume in the selected ROI. *P < 0.05. Please click here to view a larger version of this figure.
| Parameter | Sham-operated group (SHAM) (n = 5). |
Ovariectomy group (OVX) (n = 5). |
P Value |
| Bone volume–to–total tissue volume ratio (%) | 7.3 ± 0.9 | 4.2 ± 0.5 | 0.012* |
| Trabecular thickness (μm) | 79.5 ± 5.5 | 53.4 ± 6.0 | 0.013* |
| Trabecular separation (μm) | 212.5 ± 8.7 | 249.4 ± 8.3 | 0.015* |
| Values are the mean ± SD. * Significantly different (P<0 .05). |
|||
Table 1: Trabecular bone parameters estimated from Micro-CT.
Discussion
Osteoporosis can lead to frequent fractures, which are costly, can cause pain, disability, or even death, and seriously affect the quality of life of patients20. Over the years, the ovariectomy model has been recognized as one of the standard methods for studying osteoporosis21. The most common preclinical animal model for osteoporosis is the ovariectomized (OVX) rat. Despite this, the majority of research into the mechanisms of bone disorders, including osteoporosis, has been conducted using mice22. To establish an osteoporosis model in adult female C57/BL6J mice, ovariectomy is performed at 12 weeks of age, which is the optimal time for this procedure. Mice are mature and fertile from 8-12 weeks of age, and ovariectomy has a significant effect on their bone mass at this time10. Previous studies show that before 12 weeks, the bones of mice grow rapidly, and the indicators of bone morphology, BMD, and bone biomechanics increase quickly. The total BMD and cortical bone BMD are significantly correlated with the age of the mice. However, after 12 weeks, the bone metabolism of mice enters a stable period, and the above indicators tend to be stable23,24.
Bone microarchitecture has been proposed as the primary factor influencing bone fragility, independent of BMD. The bone fragility of osteoporosis is not fully explained by a deficit in bone mass. BMD can only explain 60%-70% of bone strength25. In terms of structural composition, cortical bone comprises 80% of the bone mass, whereas cancellous bone exhibits only 10% of the measurements after losing 50% of the bone mass, suggesting that bone mass measurements alone are not sufficient to assess bone mass loss. In addition to bone volume, structural changes in bone trabeculae are critical to bone strength. Cancellous bone contains hematopoietic bone marrow tissue or adipose tissue. Its surface is quite large, about eight times larger than that of cortical bone. This large surface area connected to the bone marrow allows the cancellous bone to have a fairly high bone conversion rate. That is why we chose the microstructure of bone trabeculae as the main indicator for observing osteoporotic changes. The trabecular bone tissue in the skeleton is constantly undergoing remodeling during growth, during which newly formed bone trabeculae replace the existing ones and form secondary spongy bone. Therefore, in normal conditions, morphometric analysis of trabecular bone is mainly focused on the secondary spongy bone area. Primary spongy bone tissue, on the other hand, is a congenitally present and relatively stable structure that is not remodeled and thus needs to be excluded from the analysis. Generally, the bone within a certain distance from the growth plate can be considered as actively remodeling tissue. Therefore, we selected a region of interest (ROI) that starts from 540 µm above the growth plate and spans 1600 µm in the proximal direction for the analysis. According to our findings, mice exhibit very different microstructural characteristics in trabecular regions after ovariectomy.
The Micro-CT technology used in this study is a non-destructive 3D imaging technique developed in recent decades and is gradually being applied to the pharmacological study of ethnomedicinal herbs. It provides a clear understanding of the internal microstructure of the sample without destroying it. As for the histopathological examination, the resin embedding method damages enzyme activity and protein antigenicity and cannot be reliably used for histochemistry or immunohistochemistry26. The traditional paraffin embedding can be combined with techniques such as immunohistochemistry (IHC), fluorescence in situ Hybridization (FISH), and confocal laser scanning microscope (CLSM) to quantitatively detect low-abundance substances in bone tissue at the molecular level, thereby gaining a deeper understanding of the mechanisms and regulation of bone metabolism. The panoramic slide scanner can rapidly convert slides into high-resolution digital images, making it possible to quantitatively analyze bone histomorphology data using computer software. In summary, the combination of Micro-CT and bone histomorphology can provide a more detailed and accurate evaluation of bone microstructure.
Traditionally, assessment of bone quality was largely limited to dual-energy X-ray absorptiometry (DXA), limited resolution computed tomography, or technically challenging magnetic resonance imaging27. Although the combination of the two techniques has its unique advantages, it also has its limitations. First, although Micro-CT allows for long-term continuous monitoring of the same animal, in vivo imaging of skeletal microstructures in live small animals, especially mice, is still technically challenging28. Second, the absence of a structured and internationally recognized protocol for acquiring and analyzing data from different instruments or users makes it difficult to compare datasets and reproduce research results across studies. Third, due to the characteristics of Micro-CT, exposure to ionizing radiation is inevitable. Fourth, although our simple and economical protocol can provide quantitative analysis of HE-stained bone images, it is mainly based on a semi-automatic segmentation strategy, which is more laborious than complex automated methods.
In conclusion, the application of this technology will undoubtedly bring a great impetus to osteoporosis research in ethnomedicine during the exploration process.
Declarações
The authors have nothing to disclose.
Acknowledgements
This work was supported by the Sichuan Provincial Administration of Traditional Chinese Medicine (2021YJ0175) and the Graduate Research Innovation Project of the School of Clinical Medicine (LCYJSKT2023-11), Chengdu University of Traditional Chinese Medicine.
Materials
| 4% Paraformaldehyde | Biosharp | BL539A | |
| Adobe Photoshop | Adobe Inc. | ||
| Ammonia Solution | Chengdu Kolon Chemical Co., Ltd | 2021070101 | |
| Analyze 12.0 | AnalyzeDirect, Inc | ||
| Anatomical Forceps | Jinzhong surgical instrument Co., Ltd | J3C030 | |
| Anhydrous Ethanol | Chengdu Kolon Chemical Co., Ltd | 2022070501 | |
| Automatic Dyeing Machine | Thermo scientific | Varistain™ Gemini ES | |
| Bone Microarchitecture Analysis Add-on | AnalyzeDirect, Inc | ||
| C57BL/6J mice | SPF (Beijing) Biotechnology Co., Ltd. | ||
| Carrier Slides | Nantong Mei Wei De Experimental Equipment Co., Ltd | 220518001 | |
| Coverslips | Nantong Mei Wei De Experimental Equipment Co. | 220518001 | |
| Decalcification Solution | Wuhan Xavier Biotechnology Co., Ltd | CR2203047 | |
| Delicate Scissors | Jinzhong surgical instrument Co., Ltd | ZJA010 | |
| Embedding box marking machine | Thermo scientific | PrintMate AS | |
| Embedding Machine | Wuhan Junjie Electronics Co., Ltd | JB-P5 | |
| Fiji: ImageJ | National Institutes of Health, USA | ||
| Film Sealer | Thermo scientific | Autostainer 360 | |
| Freezing Table | Wuhan Junjie Electronics Co., Ltd | JB-L5 | |
| H&E Staining Kit | Leagene | DH0020 | |
| Hydrochloric Acid Solution | Sichuan Xilong Science Co., Ltd | 210608 | |
| ImageJ2 Plugin | BoneJ 7.0.16 | ||
| Medical Gauze | Shandong Ang Yang Medical Technology Co. | ||
| Mersilk 3-0 Silk Braided Non-Absorbable Sutures | Ethicon, Inc. | SA84G | |
| Needle Holder | Jinzhong surgical instrument Co., Ltd | J32010 | |
| Neutral Balsam | Sinopharm Group Chemical Reagent Co., Ltd | 10004160 | |
| Oven | Shanghai Yiheng Scientific Instruments Co., Ltd | DHG-9240A | |
| PANNORAMIC Digital Slide Scanners | 3DHISTECH Ltd. | PANNORAMIC DESK/MIDI/250/1000 | |
| PBS buffer | Biosharp | G4202 | |
| Povidone-iodine solution 5% | Chengdu Yongan Pharmaceutical Co., Ltd | ||
| Quantum GX2 microCT Imaging System | PerkinElmer, Inc. | ||
| Rotary Microtome | Thermo scientific | HM325 | |
| Scalpel | Quanzhou Excellence Medical Co., Ltd | 20170022 | |
| Scan & Browse Software | 3DHISTECH Ltd. | CaseViewer2.4 | |
| Single-Use Sterile Rubber Surgical Gloves | Guangdong Huitong Latex Products Group Co., Ltd | 22B141EO | |
| Sodium Chloride Solution 0.9% | Sichuan Kelun Pharmaceutical Co., Ltd | ||
| Sterile Hypodermic Syringes for Single Use | Shandong Weigao Group Medical Polymer Products Co., Ltd | ||
| Sterile Medical Suture Needles | Shanghai Pudong Jinhuan Medical Products Co., Ltd. | PW8068 | |
| Tissue Processor | Thermo scientific | STP420 ES | |
| Tissue Spreading and Baking Machine | Wuhan Junjie Electronics Co., Ltd | JK-6 | |
| Tribromoethanol | Nanjing Aibei Biotechnology Co., Ltd | M2920 | |
| Wax Trimmer | Wuhan Junjie Electronics Co., Ltd | JXL-818 | |
| Xylene | Chengdu Kolon Chemical Co., Ltd | 2022051901 |
Referências
- Wang, J., et al. The prevalence of osteoporosis in China, a community based cohort study of osteoporosis. Frontiers in Public Health. 11, 1084005 (2023).
- Stein, M., et al. Why animal experiments are still indispensable in bone research: A statement by the European Calcified Tissue Society. Journal of Bone and Mineral Research. 38 (8), 1045-1061 (2023).
- Kerschan-Schindl, K., Papageorgiou, M., Föger-Samwald, U., Butylina, M., Weber, M., Pietschmann, P. Assessment of bone microstructure by micro CT in C57BL/6J mice for sex-specific differentiation. International Journal of Molecular Sciences. 23 (23), 14585 (2022).
- Fonseca, H., Moreira-Gonçalves, D., Coriolano, H. J. A., Duarte, J. A. Bone quality: the determinants of bone strength and fragility. Sports Medicine. 44, 37-53 (2014).
- Bouxsein, M. L., Boyd, S. K., Christiansen, B. A., Guldberg, R. E., Jepsen, K. J., Müller, R. Guidelines for assessment of bone microstructure in rodents using micro-computed tomography. Journal of Bone and Mineral Research. 25 (7), 1468-1486 (2010).
- Akhter, M. P., Recker, R. R. High resolution imaging in bone tissue research-review. Bone. 143, 115620 (2021).
- Mys, K., et al. Quantification of 3D microstructural parameters of trabecular bone is affected by the analysis software. Bone. 142, 115653 (2021).
- Chavassieux, P., Chapurlat, R. Interest of bone histomorphometry in bone pathophysiology investigation: Foundation, present, and future. Frontiers in Endocrinology. 13, 907914 (2022).
- Komori, T. Animal models for osteoporosis. European Journal of Pharmacology. 759, 287-294 (2015).
- Zhu, S., et al. Ovariectomy-induced bone loss in TNFα and IL6 gene knockout mice is regulated by different mechanisms. Journal of Molecular Endocrinology. 60 (3), 185-198 (2018).
- Baum, T., et al. Osteoporosis imaging: effects of bone preservation on MDCT-based trabecular bone microstructure parameters and finite element models. BMC Medical Imaging. 15, 22 (2015).
- Nazarian, A., Hermannsson, B. J., Muller, J., Zurakowski, D., Snyder, B. D. Effects of tissue preservation on murine bone mechanical properties. Journal of Biomechanics. 42 (1), 82-86 (2009).
- Martín-Badosa, E., Amblard, D., Nuzzo, S., Elmoutaouakkil, A., Vico, L., Peyrin, F. Excised bone structures in mice: imaging at three-dimensional synchrotron radiation micro CT. Radiology. 229 (3), 921-928 (2003).
- Egan, K. P., Brennan, T. A., Pignolo, R. J. Bone histomorphometry using free and commonly available software. Histopathology. 61 (6), 1168-1173 (2012).
- Brandi, M. L. Microarchitecture, the key to bone quality. Rheumatology. 48 (suppl_4), iv3-iv8 (2009).
- Schindelin, J., et al. Fiji: an open-source platform for biological-image analysis. Nature Methods. 9 (7), 676-682 (2012).
- Domander, R., Felder, A. A., Doube, M. BoneJ2-refactoring established research software. Wellcome Open Research. 6, 37 (2021).
- Parfitt, A. M., et al. Bone histomorphometry: standardization of nomenclature, symbols, and units: report of the ASBMR Histomorphometry Nomenclature Committee. Journal of Bone and Mineral Research. 2 (6), 595-610 (1987).
- Kazama, J. J., Koda, R., Yamamoto, S., Narita, I., Gejyo, F., Tokumoto, A. Cancellous bone volume is an indicator for trabecular bone connectivity in dialysis patients. Clinical Journal of the American Society of Nephrology: CJASN. 5 (2), 292-298 (2010).
- Watts, N. B. Postmenopausal osteoporosis: A clinical review. Journal of Women’s Health. 27 (9), 1093-1096 (2018).
- Thompson, D. D., Simmons, H. A., Pirie, C. M., Ke, H. Z. FDA Guidelines and animal models for osteoporosis. Bone. 17 (4), S125-S133 (1995).
- Iwaniec, U. T., Yuan, D., Power, R. A., Wronski, T. J. Strain-dependent variations in the response of cancellous bone to ovariectomy in mice. Journal of Bone and Mineral Research. 21 (7), 1068-1074 (2006).
- Ferguson, V. L., Ayers, R. A., Bateman, T. A., Simske, S. J. Bone development and age-related bone loss in male C57BL/6J mice. Bone. 33 (3), 387-398 (2003).
- Glatt, V., Canalis, E., Stadmeyer, L., Bouxsein, M. L. Age-related changes in trabecular architecture differ in female and male C57BL/6J mice. Journal of Bone and Mineral Research. 22 (8), 1197-1207 (2007).
- Seeman, E. The structural and biomechanical basis of the gain and loss of bone strength in women and men. Endocrinology and Metabolism Clinics. 32 (1), 25-38 (2003).
- Ticha, P., et al. A novel cryo-embedding method for in-depth analysis of craniofacial mini pig bone specimens. Scientific Reports. 10 (1), 19510 (2020).
- Genant, H. K., Engelke, K., Prevrhal, S. Advanced CT bone imaging in osteoporosis. Rheumatology. 47 (suppl_4), iv9-iv16 (2008).
- Zaw Thin, M., Moore, C., Snoeks, T., Kalber, T., Downward, J., Behrens, A. Micro-CT acquisition and image processing to track and characterize pulmonary nodules in mice. Nature Protocols. 18 (3), 990-1015 (2023).
