This study introduces a unique 3D quantification method for liver fat fraction (LFF) distribution using Dixon Magnetic Resonance Imaging (Dixon MRI). LFF maps, derived from in-phase and water-phase images, are integrated with 3D liver contours to differentiate LFF patterns between normal and steatotic livers, enabling precise assessment of liver fat content.
This study presents a 3D quantification methodology for the distribution of liver fat fraction (LFF) through the utilization of Dixon MRI image analysis. The central aim is to offer a highly accurate and non-invasive means of evaluating liver fat content. The process involves the acquisition of In-phase and Water-phase images from a Dixon sequence. LFF maps are then meticulously computed voxel by voxel by dividing the Lipid Phase images by the In-phase images. Simultaneously, 3D liver contours are extracted from the In-phase images. These crucial components are seamlessly integrated to construct a comprehensive 3D-LFF distribution model. This technique is not limited to healthy livers but extends to those afflicted by hepatic steatosis. The results obtained demonstrate the remarkable effectiveness of this approach in both visualizing and quantifying liver fat content. It distinctly discerns patterns that differentiate between normal and steatotic livers. By harnessing Dixon MRI to extract the 3D structure of the liver, this method offers precise LFF assessments spanning the entirety of the organ, thereby holding great promise for the diagnosis of hepatic steatosis with remarkable effectiveness.
Non-Alcoholic Fatty Liver Disease (NAFLD) encompasses a spectrum of pathological conditions, ranging from the abnormal accumulation of triglycerides in liver cells (hepatic steatosis) to the development of inflammation and damage to liver cells, known as non-alcoholic Steatohepatitis (NASH). In some cases, NAFLD can progress to more severe stages, including fibrosis, cirrhosis, end-stage liver disease, or even Hepatocellular carcinoma (HCC)1. Published data from the World Health Organization and the Global Burden of Disease suggest that approximately 1,235.7 million individuals worldwide are affected by NAFLD across all age groups2. NAFLD currently ranks as one of the most prominent causes of liver-related diseases globally and is expected to become the leading cause of end-stage liver disease in the coming decades3.
The accurate assessment of hepatic steatosis's extent holds substantial importance for precise diagnosis, appropriate treatment selection, and effective disease progression monitoring. The gold standard for assessing liver fat content continues to be liver biopsy. However, due to its invasive nature, the potential for pain, bleeding, and other postoperative complications, it is not a practical option for frequent follow-up examinations4,5,6. Consequently, there is a pressing need for noninvasive imaging techniques that can reliably quantify hepatic fat deposition. Magnetic resonance imaging (MRI) shows promise in this area due to its lack of ionizing radiation and its ability to sensitively detect fat content through chemical shift effects7,8.
Recent studies have outlined MRI techniques for quantifying hepatic fat, based on chemical shift gradient echo methods like Dixon imaging9,10. Nonetheless, the majority of these techniques rely on the analysis of two-dimensional regions of interest. The comprehensive evaluation of the three-dimensional distribution of liver fat fraction (LFF) has remained limited. In the present study, a unique 3D LFF quantification approach is introduced, combining Dixon MRI with liver structural imaging. The resulting 3D LFF model allows for precise visualization and measurement of the distribution of fat content throughout the entire volume of the liver. This technique demonstrates substantial clinical utility for the accurate diagnosis of hepatic steatosis.
The study was approved, and the patient was recruited from the Department of Infectious Diseases at Dongzhimen Hospital, Beijing University of Chinese Medicine, in Beijing, China. The patient underwent a routine abdominal Dixon MRI scan after providing informed consent. In this investigation, a 3D distribution modeling approach is employed to reconstruct the liver fat fraction (LFF) in a standard patient with medically diagnosed hepatic steatosis. Furthermore, the study provides a quantitative assessment comparing the patient's liver with a healthy liver. The software tools utilized in this research are listed in the Table of Materials.
1. Preparation and data collection
NOTE: The variance in parameters remains unaffected by the research approach. In this investigation, genuine DICOM data were obtained from clinical imaging. The data were acquired using a MRI apparatus with a field strength of 1.5 Tesla. The dataset comprises four distinct phases derived from the Dixon sequence, specifically In-phase, Out-of-phase, Water, and Fat.
2. Extracting the 3D region of the liver
NOTE: To compute the Liver Fat Fraction (LFF), each voxel within the 3D liver region acts as a spatial carrier, with its fat fraction value obtained from MRI-Dixon data. Before calculating LFF, it's crucial to extract the 3D liver region. Although deep learning methods could achieve this more efficiently, the focus here is on using mature software tools like MIMICS for liver region extraction.
3. Generating Fat Fraction Map (FF-Map)
NOTE: The fat fraction map (FF-Map) has a value range of 0-1. In this study, the FF of each voxel is calculated by dividing the voxel value of In-phase minus Water-only by that of In-phase using Dixon MRI.
4. 3D-volume of liver fat fraction distribution
NOTE: Figure 4 shows the LFF map calculated based on the Dixon MRI images of the upper abdomen. Combined with the 3D liver region in Figure 3, the 3D-LFF volume of the entire liver can be computed separately.
5. 3D-LFF quantitative analysis
NOTE: Normal liver voxels: LFF < 5%; Mild fatty liver voxels: 5%-10%; Moderate fatty liver voxels: 10%-20%; Severe fatty liver voxels: LFF ≥ 20%11,12,13,14,15. A key quantitative focus of this study is determining the proportion of voxels at different LFF stages in the patient's liver. Figure 6 demonstrates the uneven spatial distribution of liver fat fraction in the patient. The lack of distinct clinical symptoms is primarily attributed to a substantial proportion of normal liver tissue. Therefore, precise quantification of differences between patients and healthy individuals is imperative. This represents a vital quantitative concept herein.
This investigation utilizes actual patient datasets acquired using a commercially available MRI scanner to validate the 3D liver fat fraction quantification methodology (Figure 1). The MRI protocol included Dixon's four-phase imaging9,10: In-phase, Out-of-phase, Water-only, and Fat-only (Figure 2). The fat fraction (FF) of each voxel is computed by dividing the In-phase minus Water-only voxel signal by the In-phase voxel signal using Dixon MRI. This numeric model allows accurate calculation of the fat content percentage in each voxel.
Although deep learning methods can extract 3D liver anatomy, they have inherent algorithmic errors. To ensure precise quantification, mature software tools like MIMICS were used to extract an accurate 3D liver contour combined with expert guidance (Figure 3).
Fusing the 3D liver contour with the 2D FF map in Figure 4 generates an integrated 3D-FF distribution model in Figure 5. This overcomes the limitation of 2D FF maps and provides visualization of fat deposition in the entire liver volume. Doctors can now accurately locate fat content in 3D liver space instead of a vague impression.
As Figure 6 shows, the 3D-FF distribution reveals fat fraction values at different liver positions. By comparing this to standard FF thresholds, the percentage of voxels falling into different stages of hepatic steatosis can be quantified. This enables precise measurement of the proportion of liver at various steatosis levels.
Comparison between a normal and fatty liver (Figure 7) validates the technique's ability to discern different 3D-LFF distribution patterns. The proposed workflow demonstrates clinical value in the 3D visualization, quantification, and diagnosis of hepatic steatosis based on patient's Dixon MRI data.
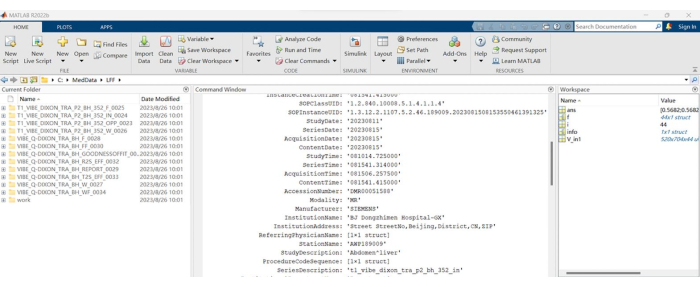
Figure 1: MRI-Dixon sequence folders. A list of folder names corresponding to the Dixon MRI scan sequences used in the study. Please click here to view a larger version of this figure.
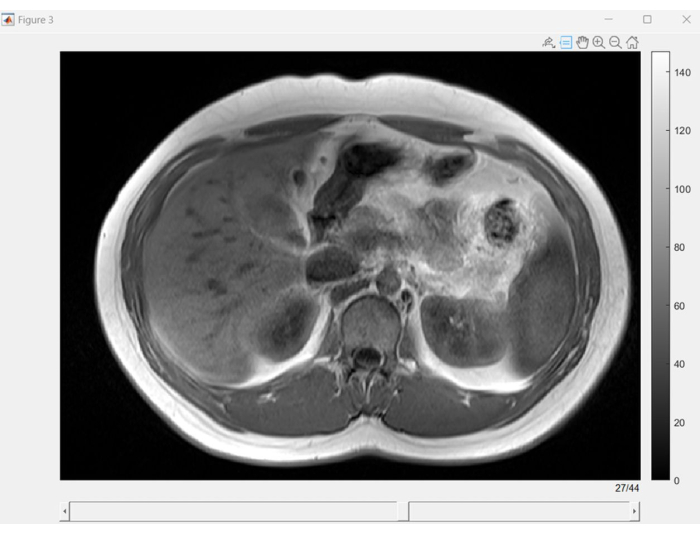
Figure 2: Dixon MRI slice browser. Graphical user interface (GUI) displaying slices from each phase sequence of Dixon MRI. Dixon MRI is valuable for enhancing image quality and interpretability, especially when precise fat and water separation is essential. Please click here to view a larger version of this figure.
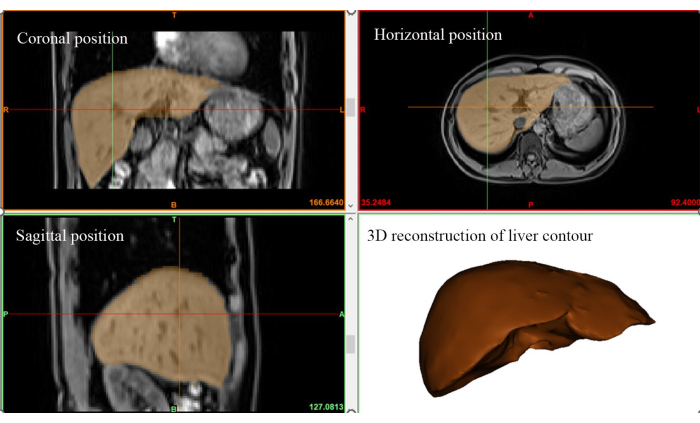
Figure 3: 3D liver region extraction. Visualization of the three-dimensional spatial extent of the liver based on In-Phase images acquired during the MRI scan. Please click here to view a larger version of this figure.
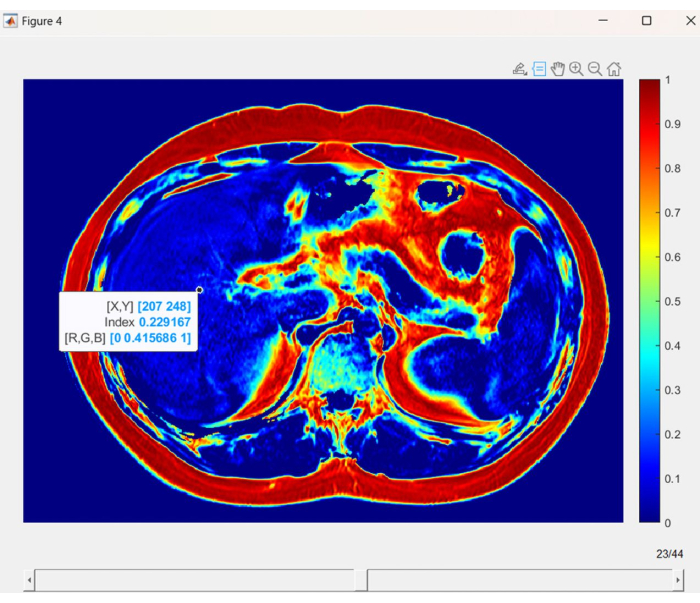
Figure 4: Liver fat fraction map. A visual representation of liver fat fraction (LFF) in each voxel, using distinct colors to indicate variations in fat content. Please click here to view a larger version of this figure.
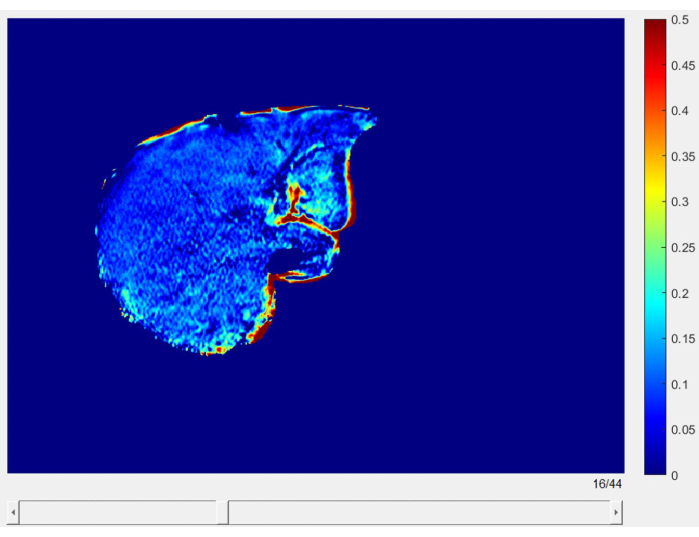
Figure 5: Liver fat fraction slices. High-resolution slices displaying the liver fat fraction map, providing a detailed view of LFF distribution throughout the entire liver. Please click here to view a larger version of this figure.
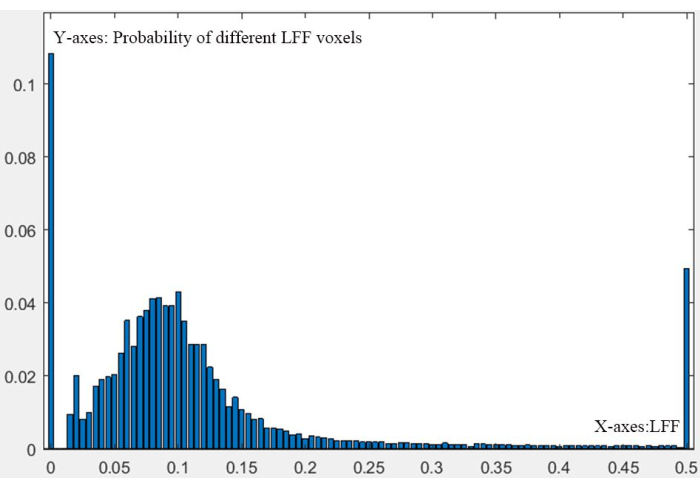
Figure 6: Whole liver 3D-LFF distribution. A figure depicting the numeric probability distribution of liver fat fraction (LFF) across the entire liver, presented in a three-dimensional format. Please click here to view a larger version of this figure.
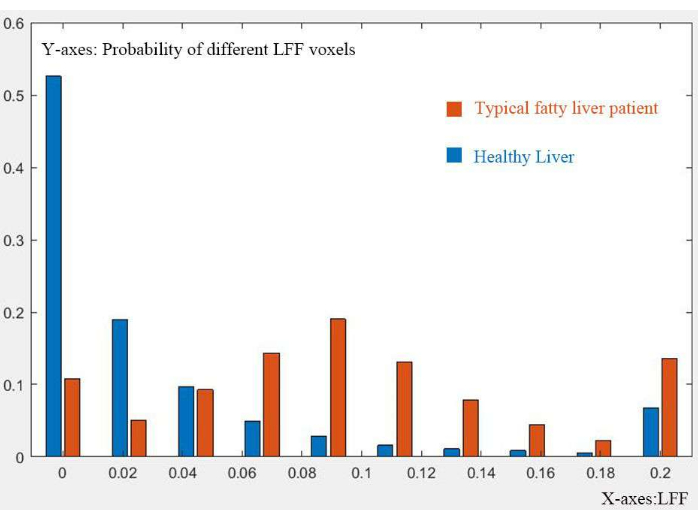
Figure 7: Comparison of 3D-LFF distribution. Comparison of the 3D-LFF distribution between a healthy liver and a typical fatty liver, highlighting differences in fat content and distribution. Please click here to view a larger version of this figure.
This research presents an innovative 3D quantification technique for analyzing the distribution of liver fat fraction (LFF) using Dixon MRI9,10. By integrating LFF maps, which are generated from in-phase and water-phase images, with 3D liver contours, this method distinguishes between LFF patterns in normal and steatotic livers6. Consequently, it facilitates a precise evaluation of liver fat content.
Step 3 represents a vital stage in calculating the FF map to quantify fat content in each voxel. Step 4 integrates the FF data with the 3D liver contour to construct an integrated 3D-LFF distribution model. Step 5 validates the efficacy of the 3D-LFF approach for accurate quantification of hepatic steatosis13.
Regarding future modifications, machine vision could enhance the efficiency of 3D liver segmentation. Compiling an atlas of 3D-LFF distributions for healthy livers and different steatosis grades could facilitate clinical diagnosis and typing.
One limitation is that while the method can quantitatively stage early steatosis, it does not elucidate the mechanisms underlying disease progression. Variations in equipment and protocols may lead to inconsistent outcomes. Standardizing the computational workflow remains an ongoing challenge.
This technique introduces and implements the concept of 3D-LFF distribution, providing clinicians with comprehensive insights into fat deposition patterns and disease severity across the entire liver organ. This holds significant significance for precise diagnosis, treatment decisions, and monitoring of therapeutic efficacy. The approach also bears importance for health screening and prevention in the general population.
The method exhibits vast potential in multiple research domains, including: (1) large-scale validation of the technique across heterogeneous cohorts; (2) investigation of 3D-LFF variations among different steatosis etiologies; (3) correlation of 3D-LFF distribution with clinical parameters and risk factors; (4) applying 3D-LFF patterns to build diagnostic, prognostic, and treatment response models; (5) comparing 3D quantification with two-dimensional imaging assessments. Numerous research avenues exist to translate this methodology into clinical utility.
The authors have nothing to disclose.
This publication received support from the fifth national program for the identification of outstanding clinical talents in traditional Chinese medicine, organized by the National Administration of Traditional Chinese Medicine. The official network link is'http://www.natcm.gov.cn/renjiaosi/zhengcewenjian/2021-11-04/23082.html.
MATLAB | MathWorks | 2022B | Computing and visualization |
Mimics | Materialise | Mimics Research V20 | Model format transformation |
Tools for 3D_LFF | Intelligent Entropy | HepaticSteatosis V1.0 | Beijing Intelligent Entropy Science & Technology Co Ltd. Modeling for CT/MRI fusion |