Here, we present a protocol using optical photothermal infrared-fluorescence in situ hybridization (OPTIR-FISH), also known as mid-infrared photothermal-FISH (MIP-FISH), to identify individual cells and understand their metabolism. This methodology can be applied broadly for diverse applications, including mapping cellular metabolism with single-cell resolution.
Understanding the metabolic activities of individual cells within complex communities is critical for unraveling their role in human disease. Here, we present a comprehensive protocol for simultaneous cell identification and metabolic analysis with the OPTIR-FISH platform by combining rRNA-tagged FISH probes and isotope-labeled substrates. Fluorescence imaging provides cell identification by the specific binding of rRNA-tagged FISH probes, while OPTIR imaging provides metabolic activities within single cells by isotope-induced red shift on OPTIR spectra. Using bacteria cultured with 13C-glucose as a test bed, the protocol outlines microbial culture with isotopic labeling, fluorescence in situ hybridization (FISH), sample preparation, optimization of the OPTIR-FISH imaging setup, and data acquisition. We also demonstrate how to perform image analysis and interpret spectral data at the single-cell level with high throughput. This protocol's standardized and detailed nature will greatly facilitate its adoption by researchers from diverse backgrounds and disciplines within the broad single-cell metabolism research community.
Cellular metabolism stands as a foundational pillar in cell biology, steering many processes that determine cell health, function, and interaction with the environment. Analyzing metabolism at the individual cell level, particularly within the native environments, provides invaluable insights to reveal the heterogeneous and complex activities in biological systems1. This is especially crucial in the study of microorganisms, as many microbes exhibit unique growth requirements or environmental dependencies that challenge traditional cultivation methods2. For instance, some species may require specific nutrient compositions or symbiotic relationships not easily replicated in a laboratory setting, thus rendering them non-culturable by standard techniques3. Furthermore, the extended periods needed for the cultivation of certain species pose significant challenges for microbiological research, often extending beyond practical time frames for study and analysis. To circumvent these limitations, alternative methods such as polymerase chain reaction and fluorescence in situ hybridization (FISH) allow for the identification of microbial species without necessitating cultivation4, which can achieve a more accurate and holistic view of microbial ecosystems. However, these analytical technologies lack the ability to elucidate cellular metabolism. This gap highlights the ongoing challenges in the microbiology field: the concurrent task of differentiating cellular identity and elucidating metabolism at the single-cell level. Advancements in techniques such as imaging mass spectrometry (IMS) coupled with stable isotopes have emerged as powerful tools for single-cell metabolic analysis5. In these experiments, cells were incubated with substrates containing isotopes such as 13C or 15N. The newly anabolized biomolecules carry these isotopes, making them distinguishable on the m/z spectra. However, IMS suffers from expensive instrumentation, complicated sample preparation, relatively low throughput, and expertise required for analyzing the m/z spectra. When combined with molecular marker-specific fluorescence imaging, advancements have been made in elucidating cellular metabolism with increased specificity6. Nevertheless, challenges persist in bridging these two modalities. The difference in resolution between IMS and fluorescence imaging, combined with different operational setups, makes it difficult to align and correlate findings7.
The integration of vibrational spectroscopic imaging with stable isotope labeling offers a novel solution for the study of single-cell metabolism. The incorporation of heavier isotopes slows down the vibration of chemical bonds, leading to red-shifted peaks in the vibrational spectra8. Notably, vibrational imaging provides a spatial resolution comparable to fluorescence imaging, and both metabolic quantification and cell identification can be performed in a single setup, simplifying the image registration and correlation. Our recent work has demonstrated the combination of an advanced vibrational imaging platform: optical photothermal infrared (OPTIR) with fluorescence in situ hybridization (FISH) to probe glucose metabolism in bacterial communities9 (Figure 1). OPTIR is a vibrational spectroscopic microscopy system that harnesses the photothermal effect of mid-IR absorption by detecting the visible light change, which provides sub-micrometer resolution as in optical microscopy but with the additional vibrational spectroscopic information originating from the mid-IR absorption. FISH is a commonly used technique to determine the microorganism identity at the single-cell level. The sequence of oligonucleotides could be designed to target specific 16S sequences of different taxa, and different fluorophores could be attached. Specific hybridization of the designed oligonucleotide probes with the target rRNA leads to strong fluorescence signals of target species within individual cells, and multi-channel fluorescence imaging could be performed to identify multiple species within the population. As both OPTIR and fluorescence imaging are based on optical detection, combining OPTIR and FISH fluorescence is straightforward to implement. The two modalities share the same optical resolution for single-cell analysis and can be switched conveniently without requiring additional alignment or co-registration.
This protocol presents a detailed guide to leveraging the OPTIR-FISH platform for advanced single-cell structure-function analysis. We used the bacterial samples grown in 13C-glucose-containing media as a test bed and quantified de novo protein synthesis from 13C-glucose. In order to demonstrate the ability of the platform to identify cells, we used bacterial mixtures in which each species was labeled using rRNA-targeted FISH probes. This approach facilitated precise single-cell identification of specific bacterial strains, such as Escherichia coli (E. coli) and Bacteroides thetaiotaomicron (B. theta), and their metabolism. This protocol offers researchers a powerful tool for simultaneous metabolic profiling and species identification at the single-cell level, promising to advance our understanding of cellular interactions, physiology, and their roles in complex environments.
The use of bacterial specimens in this study is in accordance with the guidelines of the Institutional Review Board (IRB) of Boston University and the National Institute of Health.
NOTE: The general workflow followed in this protocol is summarized in Figure 2.
1. Bacterial culture and isotope labeling (Figure 2A)
NOTE: The example given here is for labeling a pure bacterial culture. If applying this protocol to polymicrobial communities, the medium and the labeling time must be adjusted according to the community and the physiology of the organisms of interest.
2. Fluorescence in situ hybridization (FISH) (Figure 2B)
3. Sample preparation (Figure 2C)
4. OPTIR-FISH imaging
NOTE: The fluorescence imaging and OPTIR imaging will be performed on the OPTIR system.
5. Data processing and analysis at the single-cell level
The general workflow for single-cell microbial metabolic analysis with genetic identification by OPTIR-FISH is summarized in Figure 2. The representative results demonstrating the single-cell metabolic imaging capability of OPTIR are shown in Figure 3. This example used E. coli cells incubated with 12C- or 13C-glucose for 24 h. The incorporation of 13C into proteins has been shown to cause a significant red shift of protein amides I and II (Figure 3A)17,18. Therefore, these two key wavenumbers representing the 12C-protein (1656 cm-1, normal amide I band) and 13C-protein (1612 cm-1, shifted amide I band) were selected, and OPTIR images at these two wavenumbers were acquired. The corresponding bright-field images are also shown to demonstrate the morphology of the cells (Figure 3B,E). Rod-shaped bacteria can be clearly resolved at the single cell level in both bright field and OPTIR images, confirming the high spatial resolution of the OPTIR technique (Figure 3B–G). For cells incubated with 12C-glucose (Figure 3B–D), a higher intensity at 1656 cm-1 was observed, while a higher 1612 cm-1 intensity was observed for cells incubated with 13C-glucose (Figure 3E–G). This peak shift indicates the incorporation of heavier carbon isotopes into protein mass17. The evaluation was extended to assess OPTIR-FISH's capability in discriminating bacterial taxa and their metabolic activities in multi-species samples. We artificially mixed two bacterial species that are prevalent in the human gut microbiome: E. coli and B. thetaiotaomicron (B. theta). E. coli cells incubated with 13C-glucose were hybridized with a Gam42a-Cy5 probe, targeting the 23S rRNA of Gammaproteobacteria10. B. theta cells incubated with 12C-glucose were hybridized with the Bac303-Cy3 probe, targeting the 16S rRNA of most Bacteroidaceae species11. It is very hard to differentiate the two species based on the bright-field images since they are both rod-shaped (Figure 4A). Thus, multi-color fluorescence imaging of hybridized probes was essential to assign a taxonomic identity to each analyzed bacterial cell (Figure 4B). Upon subtracting OPTIR images acquired at 1612 cm-1 from that of 1656 cm-1, we noticed that a segment of cells in this bi-species sample displayed positive subtraction values (Figure 4C), indicating the incorporation of 13C isotopes. Based on the culture conditions, we assigned the cells with positive subtraction value to be E. coli, and negative subtraction value to be B. theta. The assignment of bacterial species is confirmed by the fluorescence imaging results: the cells producing positive subtraction values produce Cy5 contrast, which is specific to E. coli, and the cells producing negative subtraction values produce B. theta-specific Cy3 contrasts. Then, the isotopic replacement ratio was calculated, in this case, newly synthesized 13C-protein from 13C-glucose (Figure 4D). As expected, a significant difference in isotopic replacement ratio between the two bacterial species (pairwise t-test, p = 9.74 x 10⁻³³) was observed. This dataset underscores the feasibility of applying the OPTIR-FISH platform to study metabolism in a complex environment where multiple species of samples are present.
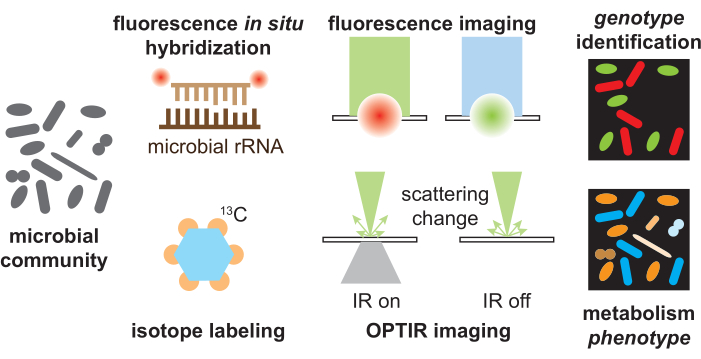
Figure 1: Schematic for the OPTIR-FISH platform for simultaneous species identification and metabolism analysis. Different members of the microbial community could be identified by specific binding of the microbial ribosomal RNA probes through fluorescence in situ hybridization and detected by fluorescence imaging of the attached fluorophores. Metabolic activity could be analyzed by culturing with isotopic substrates and detected by OPTIR imaging. OPTIR imaging detects the scattering change induced by the IR absorption, and OPTIR is inherently compatible with widely used fluorescent tools. Please click here to view a larger version of this figure.
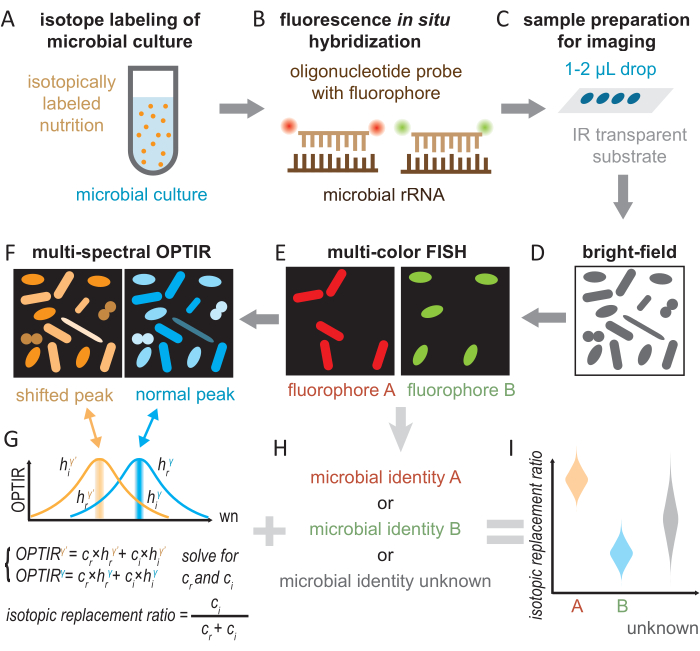
Figure 2: General workflow for single-cell analysis of metabolic activity with genetic identification by OPTIR-FISH. (A) Bacterial cells were cultured with isotopically labeled substrates. (B) Fluorescence in situ hybridization (FISH) was then performed. (C) Sample preparation on IR-transparent slide. (D) Bright-field images identify the regions with optimal cell density. (E,H) Multi-color fluorescence imaging of different FISH fluorophores reveals the genetic identity of individual cells as specified by FISH probes or remains unknown. (F,G) Subsequent multi-spectral OPTIR imaging at the normal and shifted peak reveals the isotopic incorporation into the microbial biomass. Referencing the OPTIR spectra for unlabeled and fully labeled samples (coefficient h), the relative contribution of regular (cr) and isotopic (ci) bio components could be quantified. Protein synthesis from metabolized isotopically-labeled substrates was quantified using the "isotopic replacement ratio". (I) By OPTIR-FISH, a high-throughput analysis of the metabolic activity of microbial species in a complex population can be obtained. Please click here to view a larger version of this figure.
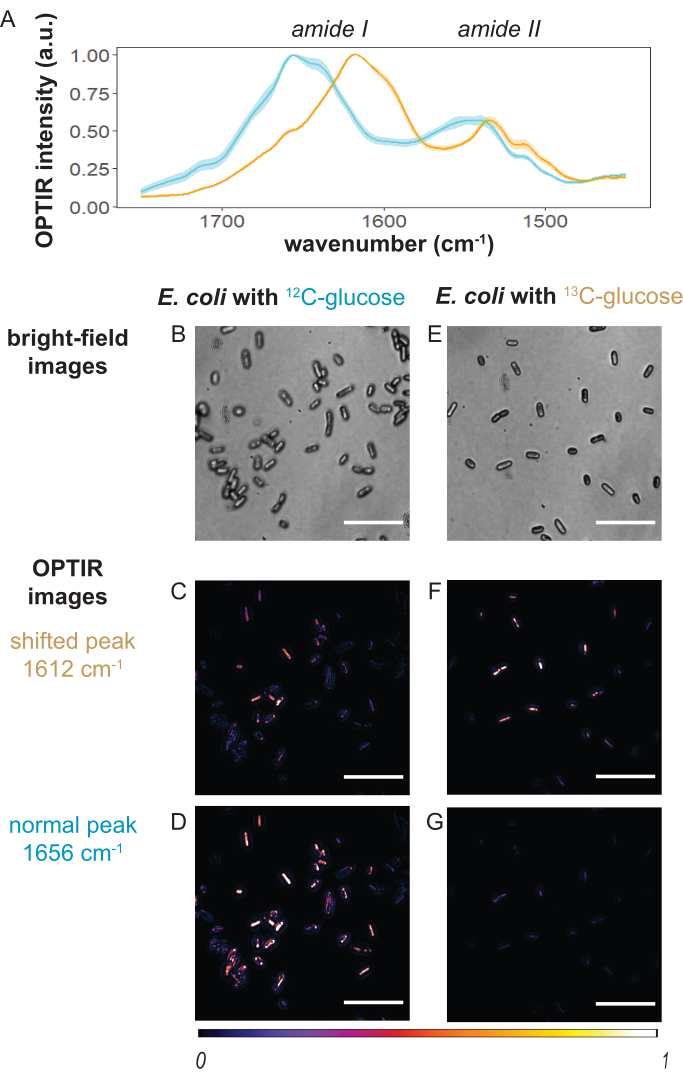
Figure 3: Representative OPTIR spectra and imaging results. (A) OPTIR spectra for E. coli cells cultured with 12C-glucose (cyan) and 13C-glucose (orange) covering the amide I and amide II region. A clear red-shifted amide I peak (1656 cm-1 to 1612 cm-1) is observed for 13C-glucose cultured cells. Representative bright-field and OPTIR images of E. coli cells at normal amide I and shifted amide I band under (B–D) 12C-glucose and (E–G) 13C-glucose culturing conditions. Scale bars: 10 µm. This figure was modified with permission from Bai et al.9. Please click here to view a larger version of this figure.
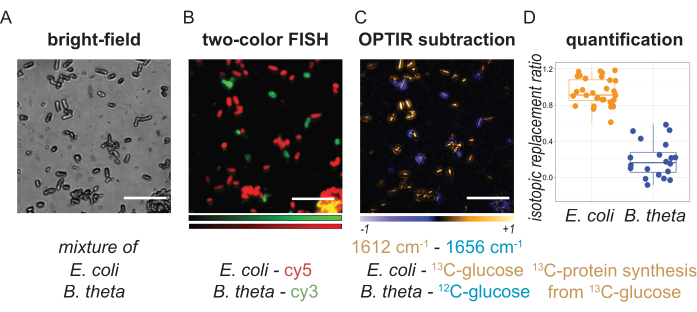
Figure 4: Representative images and quantification results from bacterial mixtures. E. coli cells were incubated with 13C-glucose, followed by hybridization with oligonucleotide probe Gam42a-Cy5. B. theta cells were incubated with 12C-glucose, followed by hybridization with oligonucleotide probe Bac303-Cy3. (A) Bright-field image shows the morphology of the cell mixture. (B) The two-color fluorescence image shows the distribution of E. coli (red) and B. theta (green). (C) OPTIR subtraction result (1612 cm-1-1656 cm-1) shows the protein metabolism of the bacteria cells. (D) Quantification of isotopic replacement ratio representing newly synthesized 13C-protein from 13C-glucose. (Pairwise t-test: p = 9.74 x 10⁻³³). Scale bars: 10 µm. This figure was modified with permission from Bai et al.9. Please click here to view a larger version of this figure.
Here, we described a detailed protocol for applying the OPTIR-FISH platform for simultaneous identification of microbial species and quantification of metabolic activities at the single-cell resolution. The critical steps include culture with stable isotope labeling for studying specific metabolic activities and fluorescence in situ hybridization for identifying target microbial species. Multi-channel fluorescence imaging and OPTIR imaging at selected wavenumbers could be performed sequentially on the same microscope. We showcased how to quantitatively analyze these images to reveal the metabolic activity levels of different species within the complex community. The protocol could be especially attractive for the metabolic study of diverse species within the complex community in their native environment.
We used bacteria as an example here, but this protocol can be adapted for other organisms, such as fungi and mammalian cells. One key point is to add the vibrational probes of the target metabolic process in the culture medium free of the normal counterpart. For example, if studying lipid metabolism from fatty acids, the azido-labeled fatty acids should be supplemented to their standard culture medium composed of de-lipid fetal bovine serum (FBS) as the fatty acids originally come from FBS. Additionally, the incubation time also needs to match with the growth rate of different fungi or mammalian cells. This ensures the normal growth of cells while maximizing the labeling efficiency of vibrational probes in the target macromolecules.
The protocol described here can also be adapted to study other metabolic processes beyond protein synthesis from glucose. All major biomolecules, including protein, lipids, nucleic acids, and carbohydrates, could be imaged by OPTIR19,20. Furthermore, there is a vast selection of labeling strategies, including isotopic labeling such as 13C, 15N, 18O, and 2H, and the addition of vibrational tags such as C≡C and C≡N to small molecules21. Due to the small label sizes and high biocompatibility, it is a preferred method for metabolism study compared with fluorescence analogs. To study other metabolic process using different vibrational probes, this protocol can be modified, including cell culture and metabolic labeling steps, as well as the wavenumber selection based on different probes and metabolic products, which can be found in corresponding references21,22,23. Some of the examples include mapping newly synthesized lipids from azide-palmitic acid in human-derived two-dimensional (2D) and three dimensional (3D) culture systems24, imaging newly synthesized protein from azidohomoalanine in macrophage cells23, imaging glucose metabolism with deuterium-glucose in PC3 cells25, and analysis of deuterium incorporation from heavy water as an activity marker in human gut microbiome26.
A potential limitation of the protocol is the detection limit of 13C in complex communities. We have shown that for the pure culture used here, the detection limit is 5% of 13C in total carbon9. We also demonstrate that by mixing fully 13C-labeled E. coli cells with unlabeled human complex gut microbiome samples, we can confidently differentiate the E. coli based on metabolic profiles despite the potential spectral variation associated with different cellular chemical compositions originating from various unlabeled gut microbiome species9. However, complex microbial communities, influenced by the unique physiologies of the microbial species present, can exhibit inconsistent 13C assimilation rates. In such cases, it is worth further testing the metabolic differentiation capability of 13C-labeled and 12C-labeled cells of OPTIR-FISH in the context of a complex community. The performance of the platform can be further improved. For example, by combining the widefield OPTIR setup, the imaging speed can be significantly increased27. Advanced denoising methods based on machine learning can be incorporated into the platform to further boost imaging speed28,29. To better visualize the detailed metabolite distribution in microbial cells, the recently developed super-resolution technologies can be adopted30,31.
Critical steps to this protocol include optimizing the efficiency of FISH labeling for target microbes, which could be achieved by rational design of the oligonucleotide probe, optimization of the formamide concentration, and careful control of the hybridization environment. Preparing samples at an appropriate single-cell density for high-throughput analysis is important for high throughput in practice. It is also critical to optimize the system to get adequate signal for quantification. This is done automatically in the instrument control software during the auto-background step. If there is a deviation in sample preparation, such as using a different type of slide instead of the standard CaF2 slide, manual optimization can be performed in the software. During the manual optimization step, the overlap between mid-IR and visible light is optimized by scanning an array of mid-IR positions. Major challenges include choosing the most suitable vibrational substrates and the corresponding OPTIR wavenumbers to quantify the metabolic activities of interest.
In conclusion, this study demonstrates how metabolic activity and microbial identification could be achieved simultaneously at the single-cell level by the OPTIR-FISH platform. We believe this detailed protocol will provide useful guidance to promote the widespread adoption of this new vibrational imaging platform with high compatibility with widely used fluorescence tools, enabling applications in diverse fields of life science and medicine and unlocking opportunities for new discoveries.
The authors have nothing to disclose.
This work was supported by the National Institute of Health R35GM136223, R01AI141439 to J.X.C.
96% Ethanol | ThermoScientific | T032021000 | |
Calcium Fluoride | Crystran | CAFP10-0.35 | |
D-(+)-Glucose | Sigma-Aldrich | G7021-1KG | |
D-Gluocose (U-13C6, 99%) | Cambridge Isotopic Laboratories | CLM-1396-1 | |
Ethylenediaminetetraacetic acid | Sigma-Aldrich | E9884-100G | |
formamide | ThermoScientific | 17899 | |
Luria-Bertani broth | Sigma-Aldrich | L3522-250G | |
M9 Minimal Salts 5x | SIGMA | M6030-1KG | |
OPTIR instrument | Photothermal Spectroscopy Corp. | mIRage LS | |
Paraforaldehyde Solution, 4% in PBS | ThermoScientific | J19943-K2 | |
poly-L-lysine solution 0.1% (w/v) | Sigma-Aldrich | P8920-500ML | |
Sodium Chloride | Sigma-Aldrich | S9888-25G | |
Sodium dodecyl sulfate | Sigma-Aldrich | L3771-25G | |
Tris(hydroxymethyl)aminomethane hydrochloride, 99+% | ThermoScientific | A11379.18 | |
Trypic Soy Broth | Sigma-Aldrich | 22092-500G |
.