- 00:00Visão Geral
- 01:28Principles of Measuring Turbidity and Total Solids
- 04:22Measuring Turbidity
- 05:56Measuring Total Solids
- 07:15Representative Results: Interpreting Impact on Water Quality
- 08:06Applications
- 09:19Summary
표층수의 탁도 및 총 고형분
English
COMPARTILHAR
Visão Geral
출처: 마가렛 노동자와 킴벌리 프라이의 실험실 – 데폴 대학
탁도 및 총 고체는 표면 물의 선명도를 측정하는 관련 측정입니다. 탁도는 물을 통과할 수 있는 빛의 양을 결정하는 물 선명도의 간접적인 척도입니다. 총 고체는 무게에 의해 결정된 물에 매달린 고체 입자를 직접 측정합니다.
높은 수준의 탁도와 총 고형물은 토양 침식, 폐기물 배출, 유출 또는 조류 성장 또는 물 속으로 퇴적물을 방해 할 수있는 벤딕 생물의 풍부를 포함한 생태 공동체의 변화로 인해 발생합니다. 높은 수준의 탁도 및 부유 고체는 열을 흡수하여 수질을 낮출 수 있으며, 이로 인해 수온이 증가하고 산소 수치가 감소합니다(따뜻한 물은 산소를 적게 보유함). 이러한 조건은 또한 적은 햇빛이 물에 침투로 광합성의 감소를 일으킬 수 있습니다, 물이 일부 수생 생활을 지원할 수 없게. 일시 중단 된 고형체는 또한 아가미를 막고, 계란을 질식시키고, 성장 속도를 감소시키고, 많은 수생 생물의 미세 서식지를 방해 할 수 있습니다.
탁도를 측정하는 한 가지 방법은 Secchi 디스크를 사용하는 것을 포함합니다. 세치 디스크는 대체 흑백 분기가있는 금속 디스크입니다(그림 1). 그것은 그것을 따라 한 발 표시가 밧줄에 부착되어 있습니다. 디스크가 더 이상 보이지 않을 때까지 물에 떨어지게됩니다(그림 2). 이 방법의 단점은 현장에서 수행해야하며 이상적인 프로토콜은 햇볕이 잘 드는 조건이 필요하며 테스트 영역을 그늘을 드린다는 것입니다. 또한, 강둑과 수위 사이에 먼 거리가 있는 경우, 세치 디스크를 사용하기 어렵다. 탁도 튜브를 사용하여 물을 수집한 다음 실험실에서 탁도 측정을 수행할 수 있습니다.
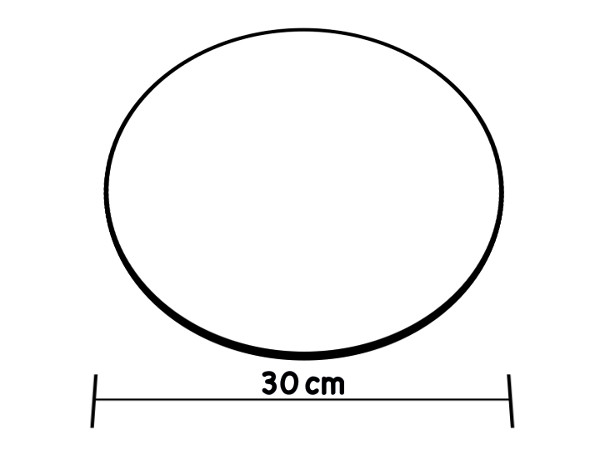
그림 1. 담수에 사용되는 수정 된 Secchi 디스크 디자인.
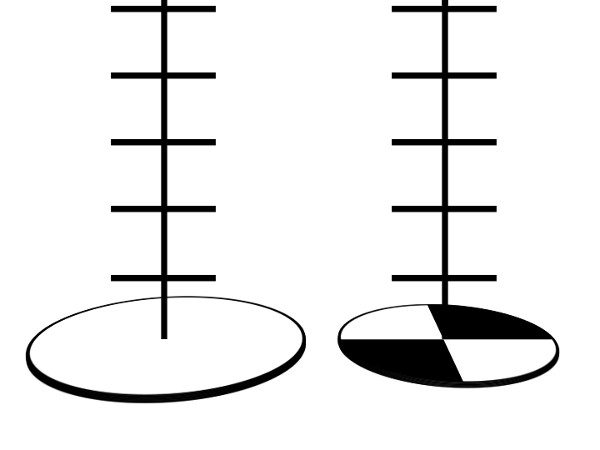
그림 2. 세치 디스크의 다른 종류. 왼쪽에 있는 해양 스타일과 오른쪽에 있는 담수 버전
Princípios
Procedimento
Resultados
The table below is used to convert amount of reagents into the turbidity units (JTU). (Table 1)
TURBIDITY
Excellent < 10 JTUs
Good 11 – 20 JTUs
Fair 21 – 90 JTUs
Poor > 90 JTUs
Total solids can be assessed using the Water Quality Monitoring Quantitative Analysis categories for total solids measurements.
TOTAL SOLIDS (mg/L)
Excellent <100
Good 101 – 250
Fair 251 – 400
Poor > 400
| Number of Measured Additions | Amount in mL | Turbidity (JTUs) |
| 1 | 0.5 | 5 |
| 2 | 1.0 | 10 |
| 3 | 1.5 | 15 |
| 4 | 2.0 | 20 |
| 5 | 2.5 | 25 |
| 6 | 3.0 | 30 |
| 7 | 3.5 | 35 |
| 8 | 4.0 | 40 |
| 9 | 4.5 | 45 |
| 10 | 5.0 | 50 |
| 15 | 7.5 | 75 |
| 20 | 10.0 | 100 |
Table 1. Turbidity Test Results Table to convert number of drops (turbidity reagent) to turbidity units (JTU) and the Water Quality Monitoring Quantitative Analysis categories for turbidity.
Applications and Summary
Turbidity and total solids are important measurements of water quality because they are the most visible indicators of how “clean” a water-source is. High turbidity levels and total solids can indicate the presence of water pollutants that have an adverse effect on human, animal and plant life including bacteria, protozoa, nutrients (e.g. nitrates and phosphorus), pesticides, mercury, lead and other metals. Increased turbidity and total solids in surface water make water unpalatable for human use aesthetically and can also provide surfaces in the water for disease-causing microorganisms to grow harboring water-borne pathogens such as cryptosporidiosis, cholera and giardiasis. High amounts of suspended solids can also become be a problem to other species living in the water if particles become lodged into gills of oxygen-breathing animals in the water. Suspended particles can also disrupt light cycles and photosynthesis, altering the concentration of oxygen in the water and disturbing the aquatic system food web. Turbidity and total solids both increase at times when algal growth is high or when sediment is lifted up into the water during a storm. Both can also increase in response to human activity such as water pollution including industrial, agricultural, and residential runoff. Wastewater from sewage systems, urban runoff, and soil erosion from development can also contribute to high levels of turbidity and total solids. Easy to conduct at the site of water collection, these two simple measurements are broad indicators for a wide range of threats to water quality, all of which render surface water less useful for human purposes and also less able to support itself as an aquatic ecosystem.
Total solids are important to as use as a monitoring test for discharges from sewage treatment plants, industrial plants, or extensive crop irrigation. Areas where freshwater levels are low tend to have higher rates of evaporation and more vulnerable to higher concentrations of solids. Turbidity and total solids concentrations also tend to increase during rainfall events, especially in more highly developed areas with increased amounts of impervious surfaces and urban runoff.
Transcrição
Turbidity and total solids are related measurements used to quantify the clarity of surface waters.
Turbidity is an indirect measure of water clarity that determines the amount of light that can pass through the water. Total solids is a direct measurement, which records the total mass of solid particles suspended in water.
High levels of turbidity or total solids in water can be caused by many environmental factors. These include soil erosion, waste discharge, runoff, or changes in ecological communities including algal growth or abundance of benthic organisms that can disrupt sediments into the water column.
Higher turbidity and suspended solids can lower water quality by absorbing heat, causing increased water temperature and a corresponding decrease in oxygen levels, as warm water holds less oxygen. Photosynthesis may decline, as less sunlight is able to penetrate the water, making it unable to support some aquatic life. Additionally, suspended solids can clog gills, smother eggs, reduce growth rates, and disrupt the microhabitats of many aquatic organisms.
This video will illustrate how to quantify turbidity in a laboratory setting, and how to calculate the total solids in water samples.
Turbidity is caused by solid particles suspended in the water that scatter light rather than allowing it to be transmitted. The degree of the turbidity is determined by the concentration, size, and color of the particles. Larger particles scatter and concentrate light into a forward direction compared to smaller particles. Particle size can also affect light quality, with larger particles scattering longer wavelengths of light more than shorter wavelengths. Conversely, smaller particles scatter short wavelengths more intensely, whilst having relatively little effect on the longer wavelengths.
If particles are densely clustered in a sample, light will come into contact with an increased number of particles, and travel a shorter distance between them, resulting in multiple scattering events. Less dense solutions have a longer mean free path. Darker particles absorb more light, and lighter particles increase scattering, with both resulting in overall increased turbidity. Overall, darker particulates result in higher turbidity than lighter particulates due to the increased amount of light energy absorbed.
One method of measuring turbidity is with a Secchi disk. For freshwater, this is a metal disk 20 cm in diameter with alternating black and white quarters. For marine use a plain white disk of approximately 30 cm in diameter is standard. In both cases the disk is attached to a rope marked at known intervals, and dropped into the water until it can no longer be seen. The length of the rope at the point of disappearance is recorded as the Secchi depth, which is related to the turbidity of the water.
However, there are limitations to this field method. Ideal recording protocol requires sunny conditions and a shaded test area. Steep, wide, or loose riverbanks may pose difficulties or danger for disk operators, or access to a boat may be necessary. Using turbidity tubes to collect water to perform analysis back in the laboratory allows safer and more standardized measurements.
Once the water samples are back in the lab, they are compared to a reference sample. To do this, Standard Turbidity Reagent is added to deionized water in predetermined increments to increase cloudiness until the samples are matched, based on observation of a fixed point at the bottom of the two columns. The amount of reagent added to match the samples can then be recorded and converted to Jackson Turbidity Units or “JTU” using a reference table.
Total solids can be obtained by evaporating the water from the sample to isolate and weigh the solids.
Now that we are familiar with the principles behind the measurements of turbidity and total solids, let’s take at look at how these are measured in a laboratory setting.
Once the sample water has been collected in the field, bring it into the laboratory for analysis. First, select a clean turbidity column and fill to the 50-mL line with the sample water.
Next, fill a second “blank” turbidity column with deionized water to the 50-mL line.
Place the two tubes side-by-side and observe the black dot at the base of the turbidity column. If the black dot is equally clear in both tubes, turbidity is zero. If the black dot in the sample tube is less visible, it will be necessary to add Standard Turbidity Reagent to match the turbidity of the reference sample to that of the test sample.
Shake the Standard Turbidity Reagent to re-suspend the particulates. Add 0.5 mL of the reagent to the distilled water tube, and use a stirring rod to mix the contents thoroughly.
Check the turbidity again by placing the sample tube and reference tube side-by-side, and looking down through the solutions at the black dots. If the turbidity of the sample water is still greater than that of the distilled water, continue to add Standard Turbidity Reagent in 0.5 mL increments, until the turbidity of the two tubes appears matched, recording the amount of reagent used and mixing after each addition. Finally, record the total amount of Standard Turbidity Reagent added. Use this value to convert to Jackson Turbidity Units.
In addition to measuring turbidity, the total solids contained in the sample can also be determined. With gloved hands, label abeaker with a grease pencil. A grease pencil is ideal, as these beakers will later be placed into an oven. Next, turn on the balance and tare it. Using gloved hands to avoid transferring body moisture and altering the weight of the beaker, place one of the empty beakers on the balance, and record the weight.
Ensure the sample water is well mixed by swirling it gently, then take a graduated cylinder and measure 100 mL of the water sample. Pour this into the beaker. Place the sample beaker in an oven set to 100 °C for 48 h in order to evaporate the liquid and dry the resulting residue. Remove the beaker from the oven with gloved hands, let it cool to room temperature, and reweigh the beaker containing the residue. To determine the weight of the residue, subtract the initial weight of the empty beaker from the weight of the beaker with residue. Next, convert the weight of the residue into mg/L using this calculation.
Turbidity samples with a JTU of less than 10 are classed as “Excellent”; a range of 11 to 20 JTU is classed as “Good”, 21 to 90 JTU samples are “Fair”, and in samples of greater than 90 JTU turbidity is classed as “Poor”.
Total solids can be categorized using the Water Quality Monitoring Quantitative Analysis categories for total solids measurements. Here, a total solids measurement of less than 100 mg/L is classed as “Excellent”, 101 to 250 as “Good”, 251 to 400 are “Fair”, and samples with greater than 400 mg/L are rated “Poor”.
Measures of turbidity and total solids can be useful in a variety of situations, and other potential methods to collect and measure these data.
Another method to measure turbidity utilizes a sensor optimized to measure it directly. First, the sensor is calibrated using a sample of known turbidity and deionized water blank. Next, a water sample is placed in the turbidity sensor, and the handheld monitor will display a readout of turbidity. This method has benefits over the laboratory measurements in that it is faster, simpler, and can be carried out in the field, but does require the purchase of more expensive equipment.
Total dissolved solids can also be measured in the field using an automated device, which uses a conductivity probe to obtain a reading. Here, the probe is manually calibrated and set to record particulates in mg/L. The probe is submerged into the water sample and the total dissolved solids reading is displayed on the handheld monitor. Again, this method provides quicker and easier results than the laboratory method, but requires the purchase of a LabQuest meter and conductivity probe.
You’ve just watched JoVE’s introduction to Turbidity and Total Solids in Surface Water. You should now understand the theory and principles underlying these two valuable measurements of water quality, how to measure them, and how to use these measurements to determine the quality of your water samples. Thanks for watching!


