- 00:06Visão Geral
- 01:21Principles of Magnetic Component Characterization
- 04:04Measuring Relative Permeability
- 06:12Identifying the Number of Turns
- 07:08B-H Curve of a 60 Hz Transformer
- 08:04Representative Results
- 08:50Applications
- 10:15Summary
Caracterização de Componentes Magnéticos
English
COMPARTILHAR
Visão Geral
Fonte: Ali Bazzi, Departamento de Engenharia Elétrica da Universidade de Connecticut, Storrs, CT.
O objetivo deste experimento é alcançar a experiência prática com diferentes componentes magnéticos a partir do design e perspectivas materiais. Este experimento abrange curvas B-H de material magnético e design indutor através da identificação de fatores de design desconhecidos. A curva B-H de um elemento magnético, como um indutor ou transformador, é uma característica do material magnético formando o núcleo em torno do qual os enrolamentos são embrulhados. Esta característica fornece informações sobre a densidade de fluxo magnético que o núcleo pode lidar com relação à corrente que flui nos enrolamentos. Ele também fornece informações sobre limites antes que o núcleo esteja magneticamente saturado, ou seja, quando empurrar mais corrente através da bobina não leva a mais fluxo magnético.
Princípios
Procedimento
Resultados
In order to find the relative permeability of the core material, two approaches can be used. The first approach is to use an LCR meter, where the inductance (L) of a coil made with a known number of turns (N) is measured, and then the relative permeability can be calculated as follows:
Reluctance of the core:  (7)
(7)
The relative permeability (µr) is thus:
 (8)
(8)
where µo is the permeability of vacuum, l is the average core length in m, and A is the core cross-sectional area in m2.
For example, if a toroidal core is used with an internal radius r1=1 cm, an external radius r2=2 cm, a cross-sectional area of 1 cm2, and the LCR meter reads 1 µH for 10 turns, then:
l=2π(r2–r1) =2π cm, 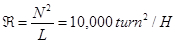 , and µr=50,000.
The second method uses the measured B-H curve. In the linear region, which is either visible or approximated, the relative permeability can be found from the slope (B=µrµoH) for each frequency. To find B and H values, appropriate scaling should be performed for probe factors, circuit elements, and core dimensions using previous measurements.
In an approach similar to finding the relative permeability, the number of turns can be found if the relative permeability is unknown. This can be achieved by manipulating the previous equations to find N.
For ferrites, µr is on the order of several thousands, while for steel and steel alloys, µr is on the order of tens or hundreds.
Applications and Summary
Even though inductors and other electro-magnetic devices (e.g., transformers) are very common in many electrical, electronic, and mechanical systems, buying inductors for a specific application is not trivial. Even when an inductor is bought, datasheet information may still have ambiguities on the actual material, number of turns, and other details. The tests in this experiment are especially useful for engineers and technicians who plan to build their own inductors or characterize off-the-shelf ones. This is common with power electronics applications (e.g., DC/DC converters) as well as electric motor drive applications (e.g., AC filter inductors) where more information is desired about the inductor in hand.
Transcrição
Magnetic elements, such as inductors or transformers, have characteristic properties that are dependent on the magnetic material forming the core inside of the coil. When current flows in an inductor or transformer coil, it creates a magnetic field. The ability of the core material to hold the magnetic field, called its permeability, determines the strength of the field, called its magnetizing force. The magnetizing force then produces magnetic flux in the inductor core. In inductors and transformer, the relationship between magnetizing force and flux density is defined as the magnetic flux through a cross-sectional area and can be analyzed using a B-H curve. The B-H curve describes the core material and identifies its magnetic saturation limit. This occurs when additional current through the windings no longer increases magnetic flux. This video illustrates the measurement of BH curves for inductors and transformers and the characterization of the core material and inductor windings.
A B-H curve shows the relationship between magnetic flux density, B, and magnetic field strength, H. Initially, as the magnetic field strength is increased, the flux density also increases to a certain maximum value. After this point, any increase in magnetic field strength results in no significant increase in magnetic flux density and the material is considered saturated. Real magnetic materials exhibit hysteresis as the material is alternately magnetized in the positive and negative directions. This implies that as the magnetic field strength is reduced back to zero, some residual magnetism remains. The area inside the B-H curve is proportional to the energy loss as the material is magnetized in the positive and negative directions. A material with lower hysteresis loss, such as steel, is commonly used in transformer cores due to this property. The B-H curve can also be used to describe a material’s permeability, calculated as the ratio of magnetic flux density to magnetic field strength. It is often related to the permeability of free space and thus termed relative permeability. Materials with very low magnetic susceptibility, like wood, have a low relative permeability. Where as materials with high magnetic susceptibility, like iron, have a high relative permeability. In order to create a B-H curve, the flux density, B, must first be determined. For this, the flux rate of change is measured, which is relative to the voltage across the coil using Faraday’s Law. This can be identified using a simple RC circuit in parallel with the coil. For more detailed information on these calculations, please refer to the text protocol. The magnetic field strength, or H, can be found using Ampere’s Law and measurable variables, the current in the coil, the number of winding turns, and the average length of the core. The B-H curve of a material can be estimated from measurements of current and the time integral of voltage across the element. When the number of turns and dimensions of the elements are also known, these can be scaled to actual quantities. Now, let’s demonstrate how to measure relative permeability and calculate B-H curves.
In these experiments, three magnetic components are measured, a small inductor with a ferrite core, a larger black inductor with an unknown number of turns, and a 60 Hz transformer. Start with the small inductor with dimensions as shown, and a winding turns number of 75. First, measure the inductor’s inductance at 120 and 1,000 Hz using an LCR meter. Second, build the circuit as shown, keeping the function generator output at 50 ohm and the BNC connector cable disconnected. Next, connect the differential voltage and current probes and verify that there are no offsets. Set the differential probe to 120th for better resolution. Finally, set the current probe to 100 millivolts per amp on the probe and 1x on the scope. And note these scaling factors for later calculations. Set the function generator output to a 1,000 Hz sine soto wave form with a 10-volt peak. Measure VC and I, connect the function generator and verify that all circuit connections are as shown. Then, record the measured current and voltage. Finally, change the oscilloscope display format from yt to xy to display the B-H curve. Adjust the channel one and channel two vertical adjustment knobs until the curve fits the scope screen. Next, stabilize the curve by setting the persist option for the display. And then, take a screenshot of the curve. Last, adjust the function generator frequency to 120 Hz and retake the B-H curve screenshot after adjusting the curve settings as needed. Finally, disconnect the function generator and remove the inductor. Keep the rest of the circuit intact.
To determine the number of turns for the larger inductor, let’s first measure its B-H curve. In order to simplify calculations, assume the core is an all-air core. First, measure the inductor’s inductance at 120 and 1,000 Hz using the LCR meter. Then, place the inductor in the RC circuit. Measure the B-H curve for the larger inductor using the same procedure described for the small inductor. Observe and record the measured current and voltage. Display the B-H curve. Adjust the function generator frequency to 120 Hz and adjust the curve settings as needed.
Single phase transformers consist of two windings coupled by a magnetic core. Here, the B-H curve for 60 Hz transformer is measured. Using the LCR meter, measure the inductance of the 115-volt side winding at 120 Hz. Then, assemble the circuit by connecting AC1 and N from the variac to the transformer primary side through the protoboard circuit using banana cables. Adjust the scaling factors and function generator parameters as previously described. With the variac at 90 percent, measure the current and voltage. Then, display and record the B-H curve.
If the number of turns for the coil, average core length, and cross-sectional area are known, then inductance of the coil is measured directly, and the relative permeability can be calculated. Alternatively, a measured B-H curve can be used to determine relative permeability of an element and then calculate the number of turns in the coil. In the linear region of the B-H curve, the relative permeability can be found from the slope. Using relative permeability, and given that the inductance and core dimensions are known, the number of turns can be easily calculated using the following relationship.
Inductors and other electromagnetic devices, like transformers, are common in many electrical, electronic, and mechanical systems. The power grid provides electricity to consumers by distributing high voltage electricity over long distances via transmission lines. High voltages are required over long distances to compensate for energy losses. Transformers are used along power lines to step down the higher transmission voltages to the lower levels needed at distribution stations and for end user supply. Transformers transfer energy through electromagnetic induction, enabling the controlled step down of AC voltages. They are commonly designed with steel cores because of steel’s high magnetic saturation point. The stator magnet induces a rotating magnetic field in the rotor causing the rotor to revolve. Effectively, the stator is the primary winding of a transformer, and the squirrel cage, the secondary winding. AC induction motors are used in a large variety of applications. The motor consists of an outer stationary wound magnet, and the inner ferromagnetic core of the rotor. Typically, a cylindrical arrangement of conductive bars forming the squirrel cage.
You’ve just watched JoVE’s Introduction to the Characterization of Magnetic Components. You should now understand how to measure B-H curves of inductors and transformers, while identifying unknown design factors, such as relative permeability and turn number. Thanks for watching.