É necessária uma assinatura da JoVE para visualizar este conteúdo.  Faça login ou comece sua avaliação gratuita.
Confocal Fluorescence Microscopy: A Technique to Determine the Localization of Proteins in Mouse Fibroblasts
  • 00:01Concepts
  • 03:52Preparing Cells for the Antibody Staining
  • 05:35Antibody Staining
  • 06:52Mounting Coverslips
  • 07:47Confocal Imaging
  • 11:07Resultados

共焦点蛍光顕微鏡:マウス線維芽細胞におけるタンパク質の局在を決定する技術

English

COMPARTILHAR

Visão Geral

ソース: ドミニク・R・ボリノ1, エリック・A・レゲンゾフ2, トーニャ・J・ウェッブ1
1メリーランド大学医学部微生物学・免疫学科、マーリーン・スチュワート・グリーンバウム総合癌センター、ボルチモア、メリーランド州 21201
2メリーランド大学医学部生体医工学技術センター、ボルチモア、メリーランド州 21201

共焦点蛍光顕微鏡は、従来の「広視野」上蛍光顕微鏡と比較して光学分解能の向上を可能にするイメージング技術である。共焦点顕微鏡は、一度に試料の各ピクセルにレーザー照明を指示する一連の電圧制御ミラー(ガルバノメーターまたは「ガルボミラー」)を使用して、x-y光学分解能の向上を達成することができます。さらに重要なのは、ピンホールを使用して、スキャンするZ面にない場所から発信されるフォーカス光を除去することで、優れたZ軸分解能を実現し、検出器が指定されたZ平面からデータを収集できるようにすることです。共焦点顕微鏡ではZ解像度が高いため、一連のZプレーン(Zスタックとも呼ばれる)から画像を収集し、ソフトウェアを介して3D画像を構築することが可能です。

共焦点顕微鏡のメカニズムを議論する前に、サンプルが光とどのように相互作用するかを考慮することが重要です。光は、光子、電磁エネルギーのパケットで構成されています。生物学的サンプルに衝突するフォトンは、4つの方法のいずれかでサンプルを含む分子と相互作用することができます:1)フォトンは相互作用せず、サンプルを通過します。2)フォトンが反射/散乱されます。3)光子は分子によって吸収され、吸収されたエネルギーは、総称して非放射性崩壊として知られているプロセスを通じて熱として放出されます。そして4)光子が吸収され、エネルギーが蛍光と呼ばれるプロセスを通じて二次光子として急速に放出される。蛍光発光を可能にする構造を持つ分子を蛍光素子と呼んでいます。ほとんどの生物学的サンプルには、ごくわずかな内因性蛍束蛍が含まれています。したがって、外因性蛍光体は、サンプル内の関心のある特徴を強調するために使用する必要があります。蛍光顕微鏡検査の間、サンプルは蛍光色素による吸収のための適切な波長の光で照らされる。光子を吸収すると、蛍光素は「励起」と言われ、吸収の過程は「励起」と呼ばれます。蛍光色素が光子の形でエネルギーを放出すると、プロセスは「発光」と呼ばれ、放出された光子は蛍光と呼ばれます。

蛍光色素を励起するために使用される光線は、顕微鏡の対物レンズによって焦点を合わせ、最大に焦点を合わせている「焦点」に収束します。焦点を超えて、光は再び発散します。入り口と出るビームは、焦点に触れる円錐のペアとして視覚化できます(図 1、左パネルを参照)。回折の現象は、光線をどれだけしっかりと集めることができるかに制限を課します – ビームは実際に有限サイズのスポットに焦点を合わせます。焦点点の大きさを決定する2つの要因:1)光の波長、および2)対物レンズの集光能力は、その数値絞り(NA)によって特徴付けされる。焦点「スポット」は、x-y平面だけでなく、z方向にも広がり、実際には焦点ボリュームです。この焦点容積の次元は光学イメージ投射によって達成可能な最高の決断を定義する。フォトンの数は焦点ボリューム内で最も多くなりますが、焦点の上下の円錐形の光パスには、フォトンの密度も低くなります。光路の蛍光色素は、このように興奮することができます。従来の(広視野)上蛍光顕微鏡では、焦点面の上下の蛍光が焦点外蛍光(「かすんだ背景」)に寄与し、画像の解像度とコントラストを低下させます。焦点面(赤い星)の上の蛍光を表す赤い立方体は、焦点の外の蛍光(右上)をもたらします。この問題は、ピンホールの利用のために、共焦点顕微鏡で改善される。(図2、右下)を参照してください。図3に示すように、ピンホールは、焦点の場所から検出器(左)に到達するために発生する放出を可能にし、焦点外の蛍光(右)が検出器に到達するのを妨げ、したがって、解像度とコントラストの両方を向上させます。

Figure 1
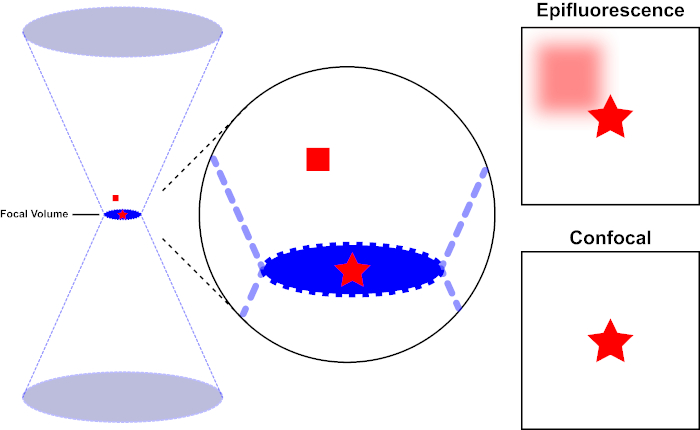
図 1.エピ蛍光と共焦点顕微鏡の光学分解能。この図のより大きなバージョンを表示するには、ここをクリックしてください。

蛍光色素を励起するために使用される光線は、顕微鏡の対物レンズによって焦点を合わせ、焦点量で収束し、発散する(左)。赤い星はイメージされているサンプルの焦点面を表し、赤い正方形は焦点面の上の蛍光色素放出を表します。エピ蛍光顕微鏡を使用してこのサンプルの画像を撮影すると、焦点が合っていない赤い正方形からの放出が見え、「曇った背景」(右上)に寄与します。共焦点顕微鏡は、焦点面の外側に放出される光の検出を防止するピンホールを備えており、「曇った背景」(右下)を排除します。

Figure 1
図 2.共焦点顕微鏡におけるピンホール効果この図のより大きなバージョンを表示するには、ここをクリックしてください。

励起光の最高強度はレンズの焦点(左、赤楕円形)にありますが、焦点にないサンプルの他の部分(右、赤い星)は光と蛍光を得ます。これらの焦点外領域から放出される光が検出器に到達するのを防ぐために、ピンホールを持つ画面が検出器の前に存在する。焦点面から放射されるインフォーカスライト(左)のみがピンホールを通過し、検出器に到達できます。ピンホールでピンホールでピンホールでピンホールがブロックされ、検出器に到達できないピンフォーカスライト(右)。

Figure 1
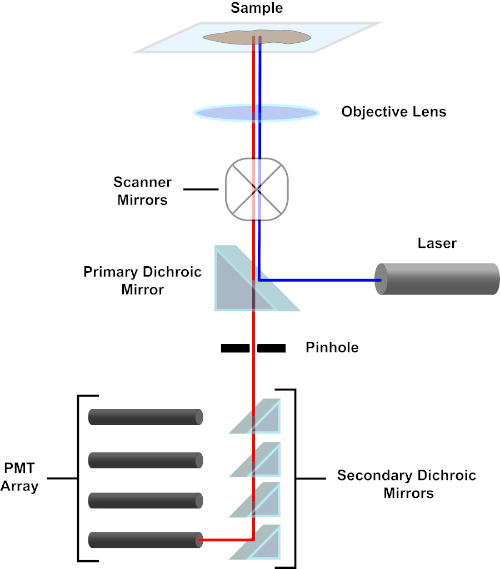
図 3.共焦点レーザー走査顕微鏡の主成分。この図のより大きなバージョンを表示するには、ここをクリックしてください。

簡潔にするために、共焦点顕微鏡の機械的記述はニコンエクリプスTi A1Rの機械的記述に限定されます。異なる共焦点顕微鏡間にわずかな技術的な違いがあるかもしれませんが、A1Rは共焦点顕微鏡機能を記述するための良いモデルとして役立ちます。ダイオードレーザーの配列によって生成される励起光線は、画像化される標本に光を集中させる目的に一次ダイクロイックミラーによって反射される。一次ダイクロイックミラーは、他の波長の光が通過できるようにしながら、励起光を選択的に反射します。次に、光は、X-yの方法で標本全体の光ビームをスイープする走査ミラーに遭遇し、一度に 1 つの(x,y)ピクセルを照らします。照らされたピクセルで蛍光が放出される蛍光は、対物レンズによって収集され、一次二色鏡を通過して光増倍管(PMT)の配列に到達する。二次二次二色ミラーは、放出光を適切なPMTに向ける。ライト パスと PMT に到達します(図 3 を参照)。これにより、比較的弱い蛍光を励起光線から散乱する光によって汚染されることなく定量化することができ、これは通常、蛍光よりも大きさの大きさである。ピンホールは焦点ボリュームの外側から光をブロックするため、検出器に到着する光は、選択された狭いZ面から来ます。したがって、画像は一連の隣接するz-平面から収集できます。この一連の画像は、多くの場合「Z スタック」と呼ばれます。適切なソフトウェアを使用することにより、z-stackを処理して、試料の3D画像を生成することができます。共焦点顕微鏡検査の特に利点は、染色の細胞内局在を区別する能力である。例えば、細胞内染色からの膜染色との分化は、従来のエピ蛍光顕微鏡(1,2,3)では非常に困難である。

サンプル調製は、共焦点イメージングの重要なファセットです。光学顕微鏡検査技術の強みは、生細胞または固定細胞を画像化する柔軟性です。3D画像を生成しようとすると、Zスタックのために取得する必要がある画像の数、細胞の健康維持の難しさ、および生細胞とその小器官の動きのために、固定細胞の使用が典型的です。共焦点蛍光のための細胞を固定および染色するための手順は、免疫蛍光において従来使用されているものと同様である。チャンバースライドまたはカバースリップで培養した後、細胞は細胞形態を維持するためにパラホルムアルデヒドを使用して固定される。非特異的抗体結合は、ウシ血清アルブミン、ミルク、または正常血清を用いて遮断される。二次抗体の特異性を維持するために、使用される溶液は、一次抗体が生成されたのと同じ種に由来してはならない。細胞は、目的の抗原を結合する一次抗体でインキュベートされる。複数の細胞標的を標識する場合、一次抗体はそれぞれ異なる種から誘導されなければならない。抗原をタグ付けする抗体は、フッ素結合二次抗体によって結合される。蛍光結合二次抗体は、共焦点顕微鏡で利用可能なレーザー励起の波長と互換性があるように選択する必要があります。複数の抗原を可視化する場合、蛍光体の励起/放出スペクトルは、その信号が顕微鏡分析によって判別できるように十分に異なる必要があります。染色された標本はイメージ投射のためのスライドに取付けられる。取り付け媒体は、光漂白や試料の脱水を防ぐために使用されます。必要に応じて、核カウンターステインを含む取り付け媒体(例えばDAPIまたはホエヒト)を使用することができる(4)。

以下のプロトコルでは、CD1d(LCD1)を発現するためにトランスフェクトされたマウス線維芽細胞を、CD1dおよびCD107a(LAMP-1)を認識する抗体で染色した。CD1dは、脂質抗原を提示する抗原提示細胞の表面に存在する主要組織適合性複合体1(MHC1)様受容体である。LAMP-1(リソソーム関連膜タンパク質-1)は、主にリソソーム膜に存在する膜タンパク質である。適切な抗原の提示のために、CD1dは低pHリソソームコンパートメントを通して入稿されるので、LAMP-1はこのプロトコルのリソソームコンパートメントのマーカーとして使用されている。異なる種で産生された抗CD1dおよび抗LAMP-1を用いてLCD1細胞を調べることによって、ユニークな蛍動管を持つ二次抗体を使用して、細胞内の各タンパク質の局在化およびCD1dがLAMP-1陽性に存在するかどうかを決定することができる。リソソームコンパートメント。

Procedimento

1. 材料 バッファー 洗浄バッファー:カルシウムまたはマグネシウムを使用せずに1 X無菌リン酸緩衝生理食塩分(PBS)を使用 固定バッファー: PBS における 1% パラホルムアルデヒド 透過性バッファー: 0.1% トリトン X-100 (PBS) ブロッキングバッファー: PBSにおける1%ウシ血清アルブミン 細胞増殖培地:10%の胎児ウシ血?…

Resultados

In this experiment, mouse fibroblasts expressing the surface glycoprotein gene CD1d were fixed, immunostained and imaged on a confocal microscope. A representative image obtained using the above protocol is shown in Figure 4. In the top panel of A, single-channel images showing the staining pattern of each individual target are presented. These images comprise a single section (slice) of the z-stack captured. The right panel shows DAPI staining of nuclei of the cells. The center panels show CD1d stained in red and LAMP-1, a lysosomal marker, stained in green. The left panel is a composite image where the three different channels are merged. The appearance of yellow results from overlap of the red and green channels, and indicates an area where CD1d and LAMP-1 are co-localized. The results of the staining confirm that CD1d is localized in the LAMP-1+ endosomal compartments. There are also areas where only one color is present, which indicates the presence of CD1d or LAMP-1 without co-localization. The bottom panel of A shows a 3D rendering of the cells constructed from images captured in the z-stack.

Panel B shows a slice out of the z-stack at 100x magnification demonstrating the expression patterns of these two proteins in greater detail. The pink outlined box on the right side of the image displays the cross section of the x-coordinate designated by the pink line in the image, which represents the side view at the pink line. Similarly, the blue outlined box on the bottom of the image shows the cross section of the y-coordinate designated by the blue line in the image, which represents the front view at the blue line. The 3D rendering of the z-stack image enables users to view the image in 3D, visualizing all the x, y and z planes.

Figure 4
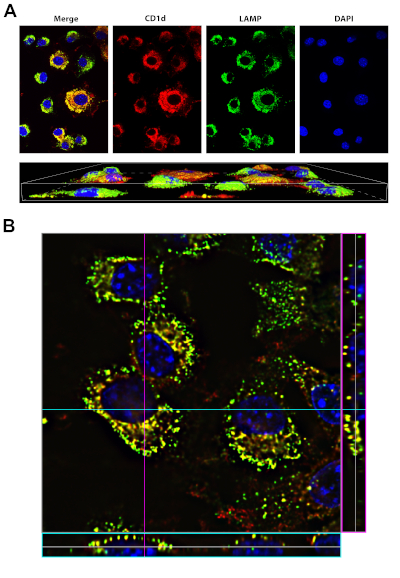
Figure 4: Staining of CD1d and LAMP1. Please click here to view a larger version of this figure.

A, top panel: LCD1 cells were fixed, permeabilized and stained with antibodies to CD1d (red) and LAMP-1 (green, a marker of the lysosomal compartment). DAPI (blue, was used to visualize the nucleus). The merge (left panel) shows that CD1d is localized in the LAMP-1 positive late endosomal/lysosomal compartment (yellow).
A, bottom panel: 3D rendering of the same cells in top panel. Images were acquired using a 40x oil-immersion objective on the Nikon Eclipse Ti, using the NIS Elements Advanced Research software.
B: 100x image of LCD1d cells stained as in A, with stack information for a particular y-coordinate (denoted by the blue line) on the bottom of the image (blue box). The stack information for a particular x-coordinate (denoted by the pink line) is shown on the right side of the image (pink box).

Applications and Summary

Confocal fluorescent staining is a relatively simple procedure that results in extremely high-quality images of specimens that are prepared in a similar way as for conventional fluorescence microscopy. In brief, samples are fixed, permeabilized, then blocked. Primary antibodies against a protein or proteins of interest are allowed to bind, then fluorophore-conjugated secondary antibodies are used to visualize the staining. Confocal fluorescence microscopy has applications in many areas of research. For example, by staining for markers of sub-cellular organelles along with a protein of interest, confocal microscopy can be used to determine the subcellular locations of diverse proteins. Compared to conventional fluorescence microscopy, confocal imaging can more effectively distinguish between cell surface and intracellular location of a protein. In addition, confocal imaging can also be used to determine whether two proteins co-localize within the cell. Although not outlined in this protocol, confocal fluorescence microscopy also can be performed on live cells to detect dynamic changes.

Video 1
Video 1: Video created in NIS Elements Advanced Research software, highlighting the ability to move through the 3D rendering of the images. Please click here to view this video (Right click to download).

Referências

  1. Claxton, N. S., Fellers, T. J. and Davidson, M. W. Laser scanning confocal microscopy. Department of Optical Microscopy and Digital Imaging, National High Magnetic Field Laboratory, Florida State University, 37 p., Unpublished (2010). Available at- http://www.vertilon.com/pdf/PP6207.pdf.
  2. Ojcius, D. M., Niedergang, F., Subtil, A., Hellio, R. and Dautry-Varsat, A. Immunology and the confocal microscope. Research in Immunology, 147 (3),175-88 (1996).
  3. Paddock, S. W. and Eliceiri K. W. Laser scanning confocal microscopy: history, applications, and related optical sectioning techniques. Methods in Molecular Biology, 1075, 9-47 (2014).
  4. Hoff. F. How to prepare your specimen for immunofluorescence microscopy. Philipps University Marburg, Institute of Cytobiology and Cytopathology, Germany. (2015) Available at- http://www.leica-microsystems.com.

Transcrição

Confocal fluorescence microscopy is a specialized imaging technique for localization of a protein or antigen of interest in a cell or tissue sample by labeling the antigen with an antibody-conjugated fluorescent dye and detecting the fluorescent signal. It offers higher spatial resolution than wide-field fluorescence microscopy, with the help of two pinholes placed at the focal planes of the objective lens, giving it the name confocal. It enables users to visualize the staining at a subcellular level, such as the differentiation between surface membrane staining from intracellular staining.

A confocal microscope follows a similar basic principle as a classic fluorescence microscope. The beam from a light source, usually a laser for confocal, is reflected by a dichroic mirror and focused by an objective lens on the sample. This light excites the fluorophores to emit a different wavelength, which travels back through the objective lens and dichroic mirror to a camera or eyepiece.

The enhanced resolution of a confocal microscope is mainly due to the presence of two pinholes, which are very small holes for light to pass through on the excitation and emission light paths. The pinholes are strategically placed at the focal plane of the objective lens. Now, let’s switch to a side view schematic of the microscope arrangement to review the light path. After passing through the excitation pinhole, the excitation light beam has the effect of originating from a focal point, which enables the objective lens to then focus the light to a point on the sample as well. The emission beam from this focal point converges at the emission pinhole, which allows it to pass through. Now during excitation, fluorophores within the light path, above and below the focal point, are also slightly excited. While the emission light originating from the focal point passes through the pinhole, the emissions from the out-of-focus points converge before or after the emission pinhole, and are hence blocked, resulting in reduced background fluorescence.

The excitation-emission-detection cycle needs to be repeated for each imaging point in the region of interest, which can be done in a few different ways. For example, laser scanning confocal uses galvanometer scanning mirrors, which deflect the excitation light at different angles. Hence, sweeping the light beam across the specimen in the XY plane. Spinning disc confocal uses a disc with an array of pinholes, which rotates to shift the arrangement of the pinholes. This enables users to illuminate multiple small imaging points in the sample each time, gradually covering the whole area as the disc rotates. As a result of the pinholes, the XY image at the detector represents a narrow Z plane. Therefore, images can be collected from a series of consecutive Z planes, often referred to as a Z stack. From these images, an appropriate software can generate a 3D depiction of the fluorescence signal pattern in the sample.

In this protocol, you will observe immunostaining of mouse fibroblasts, followed by imaging on a confocal microscope to differentially visualize a cell surface protein and a lysosomal protein.

To begin, using sterile techniques, resuspend the cells of interest in 500 microliters of growth media per well, and then seed them into the wells of a four-well chamber slide. Here, we are using mouse fibroblasts that were transfected to express the antigen-presenting molecule, CD1d. To allow cells to adhere to the glass, place the chamber slide in a 5% carbon dioxide incubator at 37 degrees Celsius, and incubate overnight. In the morning, aspirate the media from each well, and then wash the cells once with 500 microliters of PBS for a few seconds.

To fix the cells, add 500 microliters of 1% paraformaldehyde solution into each well, and incubate for 15 minutes at room temperature. After the incubation, collect the paraformaldehyde into an appropriate hazardous liquid waste container, and then remove any remnants of the fixative by washing the cells three times with PBS for a few seconds.

To allow antibody penetration into the cells, add 500 microliters of permeabilization buffer to each well, and incubate on the bench for 15 minutes at room temperature. After permeabilization, wash the cells briefly three times with 500 microliters of PBS. Next, add 500 microliters of blocking buffer to each well, and incubate for one hour at four degrees Celsius to prevent nonspecific antibody binding.

Prepare the primary antibodies, anti-CD1d and anti-LAMP-1, at appropriate working concentrations. Then, aspirate the buffer from the wells and cover the cells in each well with 500 microliters of diluted primary antibody solution and then incubate the slide on a flat surface overnight at four degrees Celsius. The next morning, dilute the secondary antibodies, in this case an anti-mouse and anti-rat antibody with distinct fluorescent tags, in blocking buffer to appropriate working concentrations. Next, aspirate the primary antibody solution from the wells and then wash the cells four times with 500 microliters of PBS. Then, add 500 microliters of the diluted secondary antibody solution to each well, and incubate at room temperature for one hour in the dark. After the incubation, aspirate the secondary antibody solution and wash the wells four times with 500 microliters of PBS to remove any unbound secondary antibody.

To mount the samples after the final wash, carefully detach and remove the chambers from the slide. To remove the residual PBS, hold the slide at an angle over a delicate task wipe, and remove the fluid from the edges without touching the cells. Once the excess PBS is removed, add one drop of antifade mounting medium, containing the nuclear stain DAPI, onto each section of cells. Next, take a 20-by-60-millimeter coverslip, and using just fingertips start lowering the coverslip slowly on either edge, taking care to avoid bubble formation over the cells. Wipe off any extra mounting medium on the slides with a delicate task wipe and store the slides in the dark at room temperature for up to a week.

To begin imaging the cells, first click on the NIS software icon on the desktop. Once in the control window, click on the TiPad tab at the top, and choose the desired objective for imaging. Then, load the slide with cells onto the stage, and center it beneath the lens. Next, on the A1plus Compact GUI tab next to the TiPad tab, set up the lasers appropriate for the fluorophores used. Click on the gear symbol to open the dye and spectral settings menu. Once the dye and spectral settings menu is open, select the channels needed and set the laser for each channel. Then, select the appropriate emissions in the drop down menu under the first dichroic mirror. Next, under A1plus Compact GUI window, click on Ch.Series to set up the line channel series, which sets up whether the lasers used will fire on the sample simultaneously or sequentially.

After that, start scanning by clicking the arrow-tip icon on the top. At this point, while the imaging is live, under A1plus Compact GUI window, click on the sliding scale, and modify the pinhole size to assure limiting out-of-focus light. Next, adjust the high voltage and offset settings under each laser to appropriate levels by using the sliding scales to enable detection of the specific staining while limiting any potential background staining. If a positive staining sample is available, start by imaging this sample for each channel to make sure the laser settings yield optimal signal-to-noise ratios. After setting the optimal HV and offset values for each laser, click on the ND Acquisition tab, and then select the Z icon to set up the parameters for the z series.

Next, while acquiring a live image of the sample, first set the bottom by finding the bottom of the image and clicking the bottom button. Then, find the top position of the sample and click the top button. Set the step size either by specifically typing the preferred step size in microns for each step or by specifying how many total steps are needed. To select the desired size/ pixel resolution of the image, click the Aiplus Compact GUI window, and under the size icon, select the desired resolution.

To decrease the noise of the image, you can select the drop-down menu next to the theta symbol to average the selected number of images. After this, click the Run Now tab on the ND Acquisition menu in order to start imaging the sample. After imaging is complete, save the image by clicking file, then save as, which will export the image file with the extension dot-nd2. Finally, repeat the process for each of the other samples.

In this experiment, mouse fibroblasts expressing the surface glycoprotein gene CD1d were fixed, immunostained, and imaged on a confocal microscope. This image shows a single section of a Z stack at 40X magnification, where CD1d is stained in red. The sample was costained with LAMP-1, a lysosomal marker, in green. Nuclear stain DAPI was used to show the nuclei of the cells.

In a composite image where the three different channels are merged, the appearance of yellow results from overlap of the red and green channels, and indicates an area where CD1d and LAMP-1 are co-localized in the lysosomes. Areas where only one color is present indicate the presence of CD1d or LAMP-1 without co-localization. This image shows a 3D rendering of the cells constructed from images captured in the z-stack and this method enabled the construction of a side view of this group of cells. This following image shows a slice out of the z-stack at 100X magnification, demonstrating the expression patterns of these two proteins in greater detail. The pink outlined box on the right side of the image displays the cross-section of the x-coordinate designated by the pink line in the image, which represents the side view at the pink line. Similarly, the blue outlined box on the bottom of the image shows the cross-section of the y-coordinate designated by the blue line in the image, which represents the front view at the blue line. The 3D rendering of the z-stack image enables users to view the image in 3D, visualizing all of the x, y, and z planes. This can be used to study co-localization of the different stains at different regions within the cell.

Tags

Cite This
JoVE Science Education Database. JoVE Science Education. Confocal Fluorescence Microscopy: A Technique to Determine the Localization of Proteins in Mouse Fibroblasts. JoVE, Cambridge, MA, (2023).