Zellzyklusanalyse: Bewertung der Proliferation von CD4- und CD8-T-Zellen nach Stimulation mit CFSE-Färbung und Durchflusszytometrie
English
COMPARTILHAR
Visão Geral
Quelle: Perchet Thibaut1,2,3, Meunier Sylvain1,2,3, Sophie Novault4, Rachel Golub1,2,3
1 Abteilung für Lymphpoiesis, Institut für Immunologie, Pasteur Institute, Paris, Frankreich
2 INSERM U1223, Paris, Frankreich
3 Université Paris Diderot, Sorbonne Paris Cité, Cellule Pasteur, Paris, Frankreich
4 Flow Cytometry Platfrom, Cytometry and Biomarkers UtechS, Center for Translational Science, Pasteur Institute, Paris, Frankreich
Der Zellzyklus ist ein universeller Prozess des Lebens. Während des Zellzyklus erfährt eine Zelle mehrere Modifikationen, um sich in zwei Tochterzellen zu teilen. Dieser Mechanismus tritt im gesamten Leben eines Organismus als Reaktion auf seine Bedürfnisse auf. Zellteilungen und embryonale Entwicklung produzieren einen vollständigen Organismus aus einer einzelligen Zygote. Im Erwachsenenalter ist der Zellzyklus für viele kritische biologische Prozesse, wie Gewebereparaturen, von zentraler Bedeutung.
Mechanismen der Zellteilung sind streng kontrollierte Ereignisse, bei denen die Zelle vor der endgültigen Teilung schrittweise modifikationen. Zellen, die sich noch nicht im Zyklus befinden,werden als in der Phase “Lücke 0”. In dieser Phase gilt die Zelle als ruhend. Wenn die Zelle zu zyklieren beginnt, werden vier verschiedene Phasen erkannt: Lücke 1 (G1), Synthese (S), Lücke 2 (G2) und Mitosis (M). G1 Phase ist ein Checkpoint für Ressourcen, die von der Zelle für die DNA-Synthese benötigt werden. Dann tritt die S-Phase auf, und die DNA-Replikation beginnt, gefolgt von der G 2-Interphase, einem weiteren Prüfpunkt, der alle Elemente steuert, die erforderlich sind, damit die Zelle geteilt werden kann. Schließlich tritt die Zelle in die Mitose ein und teilt sich in zwei Tochterzellen.
Die Zellteilung ist ein sehr informativer Parameter in vielen verschiedenen biologischen Systemen. Im Bereich der Immunologie kann die Analyse der Leukozytenproliferation auf den Mechanismus der Immunantwort hinweisen. Andere Untersuchungsbereiche stützen sich ebenfalls auf die Zellzyklusanalyse. Zum Beispiel hat die Analyse des Zellzyklus während der Tumorentwicklung unser Verständnis von Krebs verbessert.
Viele Fluoreszenzfarbstoffe sind jetzt für die Verfolgung der Zellproliferation verfügbar. Diese Farbstoffe unterscheiden sich in ihren chemischen und spektralen Eigenschaften. Es gibt zwei verschiedene Klassen von Farbstoffen: Proteinfarbstoffe verbinden sich dauerhaft mit Protein, indem sie eine kovalente Bindung bilden, und Membranfarbstoffe, die über starke hydrophobe Assoziationen stabil in Zellmembranen intercalate. In-vitro- und In-vivo-Studien zur Proliferation von Immunzellen durch Durchflusszytometrie gehören zu den häufigsten Anwendungen beider Klassen von Zelltracking-Farbstoffen (1, 2).
CFSE (Carboxyfluorescein succinimidylester) ist ein fluoreszierender Farbstoff, der teilende Zellen markiert. Zunächst erhalten alle Zellen die gleiche Menge an Farbstoff; Die teilenden Zellen teilen den Farbstoff, den sie erhielten, gleichmäßig zwischen ihren beiden Tochterzellen auf. Folglich kann dem Zellzyklus die fortschreitende Abnahme der Farbstoffintensität in den Zellen folgen. Auf cfSE-Färbung folgt die herkömmliche multiparametrische Durchflusszytometrie, eine technologiebasierter Technologie mit hohem Durchsatz, die eine phänotypische und funktionelle Charakterisierung von Zellen auf der Grundlage ihres CFSE-Färbegrades ermöglicht (3).
Im folgenden Experiment bewerten wir die Proliferation von CD4+ und CD8+ T-Zellen in-vitronach CD3-Stimulation mit CFSE-Färbung und Durchflusszytometrie.
Procedimento
Resultados
In this experiment, we followed proliferation of splenic CD4+ and CD8+ T cells in in vitro culture. After 3 days, we did not see strong proliferation in both CD4+ and CD8+ T cells with or without stimulation. This is can be seen on the top panel of Figure 2 where the peaks of CSFE are not decreasing. However, after 5 days, we started to see proliferation in both populations, which is evident from decrease in the CSFE peaks (bottom panels, Figure 2). CFSE staining, clearly demonstrates that both CD4+ and CD8+ T cells were dividing more after stimulation. In addition, CD8+ T cells seemed to be slightly more proliferative than CD4+ T cells after 5 days of stimulation.
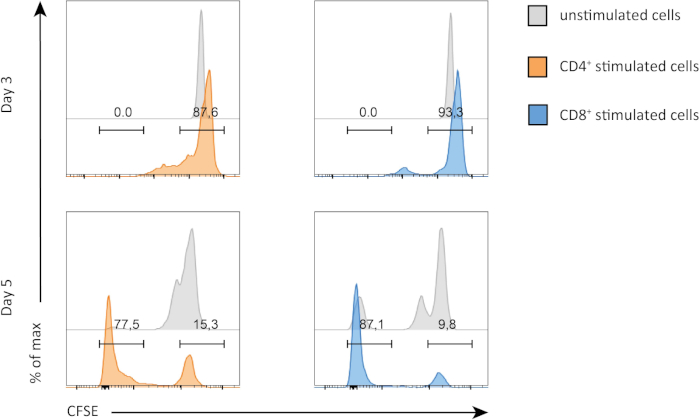
Figure 2: CD4 versus CD8 T cells proliferation. Proliferation of T cells at day 3 (top panel) and day 5 (bottom panel). Cell cycle is compared between CD4 and CD8 T cells with or without stimulation at two different days. CD4 and CD8 T cells proliferate more when stimulated. CD8 stimulated T cells proliferate more than CD4 stimulated T cells at day 5. Please click here to view a larger version of this figure.
Applications and Summary
Proliferation assays are often used in different fields such as immunology to determine the degree of activation of cells. It is also performed in oncology diagnostic to determine tumor aggressiveness in patients. CFSE staining is a useful technique to follow immune cell populations' proliferation over time. Other methods allow characterization of cell cycle. BrdU, an equivalent of CFSE is incorporated only in dividing cells. Recent Fucci mouse model even allows detection of cell cycle phases, without additional staining.
Referências
- Lyons, A. B. and Parish, C. R. Determination of lymphocyte division by flow cytometry. Journal of Immunological Methods. 171 (1): 131-37, (1994).
- Lyons, A. B. Analyzing cell division in vivo and in vitro using flow cytometric measurement of CFSE dye dilution. Journal of Immunological Methods. 243 (1-2), 147-154, (2000).
- Quah, B. J., Warren H. S., and Parish, C. R. Monitoring lymphocyte proliferation in vitro and in vivo with the intracellular fluorescent dye carboxyfluorescein diacetate succinimidyl ester. Nature Protocols. 2 (9): 2049-56, (2007).
Transcrição
For most immunology studies, measuring proliferation of immune cells is a key step and the CFSE fluorescent dye-based method is commonly used. Proper cell division is important for immune cells since it regulates both levels and specificity of an immune response. For example, T-cells proliferate to identify and kill cancer cells and B-cells undergo cell division to produce specific antibodies. The overall premise of the CSFE assay involves staining the cells with the green fluorescent dye CFSE, which enters live cells and stably binds to the proteins inside, resulting in permanent labeling. As a result, when the dye-containing parent cell divides, each daughter cell gets half the fluorescence from the parent cell.
This process continues in the subsequent divisions with the dye intensity progressively decreasing with each division. At the desired endpoint, the fluorescence intensity of each cell is measured by flow cytometry. This data is then used to quantify the number and pattern of divisions the cells have gone through. As shown here, the cell population with the highest fluorescence are from the parent generation. The second highest belongs to the second generation and so on. The number of peaks determines the number of cell divisions.
In addition, if primary immune cells are used, specific cell populations, like the T-cells for example, can be labeled with a different colored fluorescence dye along with CFSE, and simultaneously identified using multicolor flow cytometry. The new data can be plotted on the same graph, now showing the T-cell sub-population with different CFSE staining intensities, by which the proliferation rate of the T-cells can be specifically analyzed. This video demonstrates the protocol for CFSE staining of mouse splenocytes, which are stimulated with an anti-CD3 antibody. This is followed by staining to label T-cells and flow cytometry to track their cell proliferation.
To begin, put on appropriate protective clothing and laboratory gloves. Next, wash a pair of forceps and dissecting scissors first with a detergent and then with 70% ethanol and then wipe them dry with a clean paper towel. Prepare 50 milliliters of Hank’s Balanced Salt Solution, or HBSS, with a 2% concentration of fetal calf serum, or FCS, by combining one milliliter of FCS with 49 milliliters of HBSS in a 50 milliliter tube. Mix by gently pipetting the solution up and down approximately 10 times. Then, isolate mouse spleen cells as demonstrated in the video protocol for FACS isolation of splenic B-lymphocytes.
Label four 15-milliliter tubes one through four and add one times 10 to the seventh isolated spleen cells. Next, add three milliliters of HBSS 2% FCS to each tube. Then, pipette one microliter of five micromolar carboxyfluorescein succinimidyl ester, or CFSE, into each tube. Incubate the tubes at 37 degrees Celsius in a 5% carbon dioxide incubator for 10 minutes. The cells in tubes one and two will not be stimulated. They will be used to reveal the basal level of proliferation of splenic CD4 and CD8 T-cells.
Pipette 10 milliliters of HBSS 2% FCS into these tubes. Tubes three and four will be stimulated by anti-CD3 antibody in order to observe the effects on the cell cycle. Add 10 milliliters of HBSS 2% FCS and anti-CD3 antibody at a final concentration of 2.5 micrograms per milliliter to tubes three and four. Next, centrifuge all of the tubes at 370 x g for seven minutes at 10 degrees Celsius. Discard the supernatants. Resuspend the pellets in two milliliters of HBSS 2% FCS and pipette the resulting solutions into separate wells on a six-well plate. Carefully label the plate from one to four to keep track of sample identities. Incubate the cells at 37 degrees Celsius and 5% CO2 for three days.
On day three, add two milliliters of HBSS 2% FCS to wells one and three, which should contain the cells from tubes one and three. Pipette up and down vigorously and then transfer the samples into labeled five-milliliter FACS tubes. Place the six-well plate back into the incubator. These remaining cells from wells two and four will be analyzed on day five to investigate long-term effects of stimulation on the cell cycle. Centrifuge the tubes at 370 x g for seven minutes at 10 degrees Celsius and then discard the supernatants. Now, add 100 microliters of antibody mix to each tube. Incubate the tubes for 20 minutes on ice in the dark. Next, add one milliliter of HBSS 2% FCS to each tube and centrifuge the tubes at 370 x g for seven minutes at 10 degrees Celsius. Discard the supernatants. Re-suspend the pellets in 200 milliliters of HBSS 2% FCS and mix well. Transfer the resuspended pellets to new labeled FACS tubes.
Then, evaluate T-cell proliferation using flow cytometry as shown in the FACS protocol. Gate the cells to select lymphoid CD3-positive cells and to distinguish CD4-positive and CD8-positive cells, and record the data for tubes one and three. On day five, repeat the cell-staining process with the cells from the remaining two wells of the six-well plate.
We will analyze the effects of CD3 stimulation on the cell cycle of CD4 and CD8-positive cells at three days and five days post-stimulation. To begin, click on the FlowJo icon and drag your files into the All Sample window. Double-click on the file for the unstimulated cells collected on day three to display a dot plot with forward scatter on the y-axis and side scatter on the x-axis. Click on polygon to circle the lymphocyte populations based on their morphology. In the sub-population identification window, name the population lymphocytes and click OK. Next, double-click on the circled population and in the new window, select Thy1.2 on the y-axis and CD3 on the x-axis. Then, click on polygon to circle the CD3 and Thy1.2 double positive cells. In the new sub-population identification window, name the population T-Cells and click OK. Next, double-click on the circled population. In the new window, select CD4 on the y-axis and CD8 on the x-axis. Then, click on polygon to circle the CD4-positive population. In the new sub-population identification window, name the population CD4 T-Cells and click OK. Now, click on polygon to circle the CD8-positive population. In the new sub-population identification window, name the population CD8 T-Cells and click OK. Repeat these steps with the other files.
To determine the frequencies of dividing and non-dividing cells, first, visualize the cell populations by clicking on Layout Editor. Then, drag the CD4 T-cells and CD8 T-cells from each of the four tubes to the All Sample window. Graphs representing your populations will appear. For each tube, double-click on the dot plot for CD8 T-cells and select Histogram under Graph Definition to visualize the results. Select CFSE as the parameter to compare the stimulated versus unstimulated cell populations at each time point. Non-dividing cells maintain higher levels of CFSE whereas proliferating cells split the content of CFSE to dividing cells.
Now, while pressing the Shift key, double-click on the histogram. In the new window, click range and select the range of CFSE corresponding to the highest peak. In the sub-population identification window, name the population Non-Dividing CD8 T-Cells and label the population Dividing CD8 Cells. Now, repeat to select the dividing and non-dividing CD4 T-cells in each tube. To examine the frequency of dividing CD3-positive cells, click on Table Editor. Then, drag the populations of interest, Dividing CD8 T-Cells and Dividing CD4 T-Cells, into table. On the Statistic menu, select Frequency of T-cells. Then, click on Create Table to reveal the frequency in a new table.