Science Education
>

Isolating Intestinal Stem Cells from Adult Drosophila Midguts by FACS to Study Stem Cell Behavior During Aging

PREPARAÇÃO DO INSTRUTOR
CONCEITOS
PROTOCOLO DO ALUNO
JoVE Journal
Biologia
This content is Free Access.
JoVE Journal Biologia
Isolating Intestinal Stem Cells from Adult Drosophila Midguts by FACS to Study Stem Cell Behavior During Aging

NOTE: If this protocol is used for the first time to isolate ISCs by FAC sorting, the following controls are mandatory in order to initially set the FACS parameters properly: Dissociated cells from wild type (e.g. w1118) Drosophila midguts without Sytox. Dissociated cells from wild type (e.g. w1118) Drosophila midguts with Sytox (see Step 3.6). Dissociated cells from midguts of the esg-Gal4, UAS-GFP fly line without Sytox.

1. Preparation of Solutions and Dishes for Gut Dissection

  1. Prepare 4-6 vials each containing 40 female flies from the esg-Gal4, UAS-GFP fly line.
  2. From a 10x PBS stock solution prepare 500 ml 1x PBS (1.8 mM NaH2PO4·H2O, 8.4 mM Na2HPO4·2H2O, 175 mM NaCl, adjust pH to 7.4).
  3. Prepare a 3.5% agarose solution in 1x PBS (3.5 g electrophoresis grade agarose in 100 ml 1x PBS). Prepare dissection plates by pouring this solution into petri dishes (diameter 8.5 cm) to cover the bottom. The agarose layer prevents damaging the tips of the forceps during the dissection procedure. After the gel has solidified store the dissection plates at 4 °C.
  4. Prepare 300 ml of 1x PBS + 1% BSA fresh before dissecting and place the bottle on ice or at 4 °C.
  5. Turn on centrifuge and let it cool to 4 °C.
  6. Flame the tips of 2 glass Pasteur pipettes to smoothen the edges.
  7. Clean two pairs of forceps and one razor blade with 70% ethanol.
  8. Place four to six 1.5 ml microcentrifuge tubes for collecting dissected midguts on ice.

2. Preparation of the Gastrointestinal Tract and Dissection of the Midgut

  1. Anesthetize flies from one vial (40 flies) with CO2 on a standard fly bed, decapitate all flies using a razor blade and transfer them to the dissection dish. Pour cold 1x PBS/1% BSA solution into the dissection dish to cover the agarose gel. The flies will float.
  2. Grab the fly abdomen with one pair of forceps, while holding the thorax with the other pair of forceps. Separate the thorax from the abdomen. The gut will be visible and the foregut/crop will most likely still be connected to the thorax.
  3. Grab the gut and pull it out of the thorax. To unfold the gut, grab the crop and pull the gut slightly anteriorly away from the abdomen.
  4. Grab the posterior end of the abdomen with one pair of forceps and the edge of the anteriorly open cuticle with the other pair of forceps. Be careful not to destroy the protruding gut tissue. Pull the posterior end away to break the cuticle and continue pulling posteriorly very gently until the entire gut has been pulled out of the abdominal cavity. The crop may have to be removed beforehand if it is too large to fit through the body cavity.
  5. Remove the foregut, Malpighian tubules, hindgut and ovaries leaving the bare midgut.
  6. Using a glass Pasteur pipette, transfer the batch of dissected midguts to a 1.5 ml microcentrifuge tube containing cold 1x PBS/1% BSA solution and keep the tube on ice. The samples must be processed within 2 hr.
  7. After the dissection of an entire batch is complete, rinse the dissection dish with double distilled water to wash off left over debris. Start dissecting the next batch of midguts (repeat Steps 2.1–2.7). Dissect as many batches as possible within 2 hr, then proceed to Step 3.1.

3. Digestion of the Gut Tissue to Harvest Cells for FAC Sorting

  1. Remove the 1x PBS/1% BSA solution from the midguts and add 500 µl of 0.5% Trypsin-EDTA solution to each sample.
  2. Vortex well for 20 sec and incubate the samples by gentle rocking/rotating at 20 rpm at room temperature for 25-30 min.
  3. Vortex again after about 30 min and let the intact midgut tissue sink to the bottom of the tube. Carefully remove the cells that are in suspension with a flamed glass Pasteur pipette and filter them through a 35 µm nylon mesh into a fresh 1.5 ml microcentrifuge tube.
  4. Spin the cells down at 100 x g for 5 min at 4 °C. Of note, when starting the digest, a cell pellet might not be visible at first but will become visible as the tissue digest progresses.
    1. Carefully transfer the Trypsin solution back to the original sample tube containing the remaining intact midgut tissue. Avoid transferring too many cells from the pellet.
    2. Gently re-suspend the cell pellet in 400 µl of cold 1x PBS/1% BSA. Keep the microcentrifuge tubes containing the dissociated cells on ice and cover the tubes with aluminum foil to protect the cells from light.
    3. Vortex the Trypsin solution containing the remaining intact midgut tissue again and place the samples onto the rocker for another 30 min at room temperature.
  5. Repeat steps 3.3 to 3.4.3 until all of the midgut tissue has been digested. Combine the dissociated cells from all microcentrifuge tubes into one microcentrifuge tube. This may require a centrifugation step as in 3.4, since the volume of all cell suspensions combined may exceed 1.5 ml. Keep the cell suspension on ice and protect the cells from light.
  6. Spin the dissociated cells down at 100 x g for 5 min at 4 °C. Carefully remove as much of the supernatant as possible leaving approximately 50-100 µl of the 1x PBS/1% BSA solution in the microcentrifuge tube. Gently resuspend the dissociated cells in 800 µl 1x PBS/1% BSA containing Sytox (1:20,000).
  7. Transfer the cell suspension to a 5 ml round bottom Falcon tube by filtering the cells through a cell strainer snap cap (35 µm nylon mesh). Always keep cell samples on ice and protected from light. The cells are now ready to be sorted.
  8. Pipette 600 µl of RNAlater solution into each microcentrifuge tube into which the cells will be sorted for subsequent RNA isolation. For other downstream applications the cells can be collected in a different solution, e.g. in sterile PBS.

4. FAC Sorting to Isolate Intestinal Stem Cells

  1. Switch on the flow cytometry instrument at least one hour prior to sorting. Make sure that the fluidic system is free of air bubbles.
  2. Choose the 70 µm nozzle size to inject the cells into the sheath fluid stream.
  3. Adjust the amplitude of the core fluid stream so that the gap value corresponds to the reference value (6-7, when using the 70 µm nozzle). Let the core fluid stream stabilize before starting to sort.
  4. Follow this order when initially setting the parameters for sorting:
    1. Load the dissociated cells obtained from wild type guts. First, adjust the FSC and SSC voltages to plot the cells in the center of the scatter plot. Second, adjust the FITC (GFP) voltage so that all cells are plotted below 102 on the logarithmic x-axis. Setting the FITC parameter sets the limit for autofluorescence.
    2. Load the dissociated cells obtained from wild type guts with Sytox added. Adjust the Pacific Blue voltage value and gate to identify and separate living cells from dead, Sytox-positive cells in the Pacific Blue vs. FSC-A scatter plot.
    3. Load the dissociated cells obtained from the esg-Gal4, UAS-GFP fly line without Sytox and adjust the FITC voltage to ensure that all GFP-positive cells are plotted within the scatter plot.
  5. Load the dissociated cells obtained from the esg-Gal4, UAS-GFP fly line with Sytox added. Adjust the Pacific Blue voltage value and gate to identify and separate living cells from dead, Sytox-positive cells (gate P1).
    1. Set the SSC-A and FSC-A gate to identify the GFP-positive cells (based on the histogram plot) as determined by size and granularity (gate P2).
    2. Set the FSC-H and FSC-W gate to identify and exclude GFP-positive cell doublets based on their size (gate P3).
    3. Set the SSC-H and the SSC-W gate to identify and exclude GFP-positive cell doublets based on their granularity (gate P4).
    4. Use gate P4 to depict the GFP-positive cells in a histogram plot that shows the number of cells (count) vs. GFP intensity. Two distinct peaks of GFP-positive cells will be visible. Create a gate for each peak (gates P5 and P6). Gate P5 contains the cell population that is enriched for ISCs and can be sorted separately from the cells in gate P6.
    5. Back-gate in a contour plot to verify that the two distinct GFP-positive cell populations contain living cells (compare with gate P1) and cells of the correct size (compare with gate P2).
  6. Sort the cells into a 1.5 ml microcentrifuge tube that contains 600 µl of RNAlater solution. The sorting is done at a low flow rate (max. 2.0, 70 µm nozzle, 1,000 events/sec, 70 psi) and employing a two-way purity sort.
  7. After sorting is complete, immediately vortex the sorted cells briefly and keep the microcentrifuge tubes on ice until proceeding with RNA isolation or other downstream applications.

Isolating Intestinal Stem Cells from Adult Drosophila Midguts by FACS to Study Stem Cell Behavior During Aging

Learning Objectives

To obtain between 50,000–100,000 cells from FAC sorting, between 160 and 200 midguts need to be dissected. Obviously this is the most time consuming step of the whole procedure. The cartoon shown in Figure 1A illustrates the major steps of gut dissection, which are described in detail in the protocol provided here. This procedure can be individually modified. A dissected, whole gastrointestinal tract is shown in Figure 1B.

When all of the midgut tissue has been digested, immediately continue with FAC sorting. Following the gating strategy described in the protocol allows for the successful identification and sorting of a cell population enriched for ISCs and for EBs from young (Figure 2) and from old midguts (Figure 3). The P1 gate is set to include only healthy living cells and to gate out dead cells. Cells that plot above 103 on the logarithmic y-axis when using the Pacific Blue channel are defined as dead cells. The dots that plot below 40 on the x-axis (FSC-A) are mostly debris and therefore are also excluded (Figure 2A). In the scatter plot of SSC-A vs. FSC-A the cells are distributed based on their size and granularity. For an optimal resolution, the cells are placed in the scatter plot as shown in Figure 2B by adjusting the photomultiplier tube (PMT) voltage. In the scatter plots FSC-H vs. FSC-W and SSC-H vs. SSC-W single cells are separated from aggregates and doublets based on size (Figure 2C) and based on granularity (Figure 2D). When depicting the cells included in gate P4 in a histogram plot, the distinct separation of GFP-negative, GFPlow (gate P5) and GFPhigh (gate P6) cells is visible (Figure 2E). Cells exhibiting lower GFP intensity are small and less granular and represent ISCs. Cells exhibiting higher GFP intensity are larger and more granular and represent EBs. Reverse Transcriptase (RT)-PCR for Dl on cDNA synthesized from RNA of cells of each GFP-positive population (gates P5, P6) revealed that the Dl signal is indeed stronger in the smaller, GFPlow cells than in the larger, GFPhigh cells (Figure 2H). The cells were then backgated and depicted in contour plots to confirm that the GFPlow (gate P5) and GFPhigh (gate P6) cells differ in size and granularity (Figure 2F) and are still alive (Figure 2G). Of note, the two peaks of GFP-positive cells (GFPlow and GFPhigh) can only be nicely distinguished if the FITC (GFP) channel has been calibrated properly using the controls described in the protocol.

The same gating strategy was used when sorting ISCs derived from old guts (Figure 3). The scatter plots (Figure 3A-D), the histogram (Figure 3E) and the contour plots (Figure 3F, G) are analogous to the ones shown in Figure 2. As mentioned above, there is no bona fide marker to identify ISCs in old midguts and therefore no RT-PCR data is presented here. However, the intriguing observation here is that the two peaks containing GFPlow (gate P5) or GFPhigh (gate P6) cells remain distinctly separated during aging. Furthermore, the number of cells in the GFPhigh (gate P6) peak significantly increases during aging, which clearly emulates the known accumulation of misdifferentiated EBs with age. The change in the ratio of the two cell populations can also be seen in the scatter plots (compare Figure 3A-D with Figure 2A-D) and in the contour plots (compare Figure 3F, G with Figure 2F, G). From these findings we conclude that by sorting for GFP-positive cells using FACS we can enrich for ISCs and EBs in young and old midguts.

To validate the purity of the isolated ISCs and EBs, a post sort analysis was performed (Figure 4). The histogram plots of the post-sorted ISCs and EBs (Figure 4B, C) depict purities between 95% and 98%.

If the hierarchy of setting the FACS parameters as described above is strictly followed, the two different cell populations (GFPlow, small and GFPhigh, larger) can already be distinguished in a scatter plot GFP vs. FSC-A (Figure 5A). These two cell populations cannot be distinguished if this hierarchy is disregarded (Figure 5B-D).

Figure 1
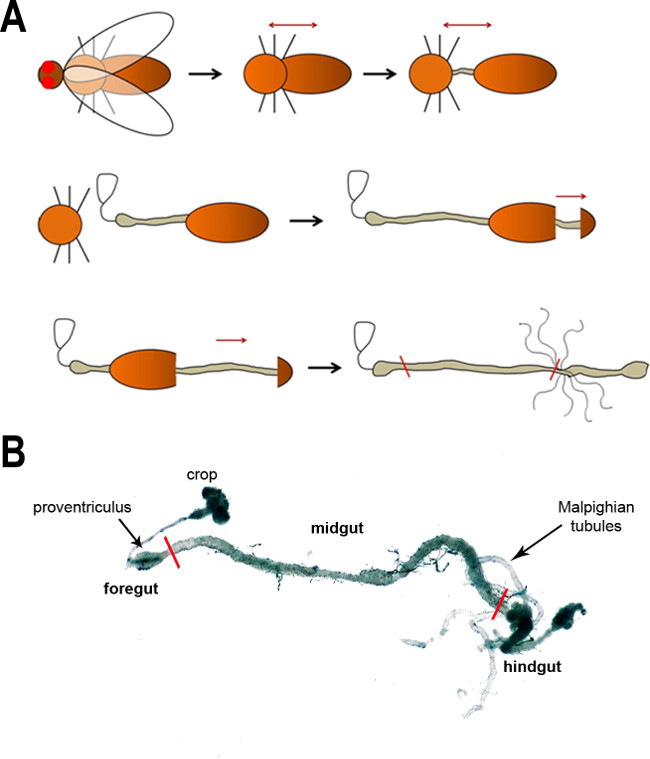
Figure 1: (A) A schematic of the major steps of dissecting the fly intestine. First, the head is removed (removal of the wings is optional) followed by a separation of the thorax and abdomen to expose the gut. The gut is subsequently freed from the body cavity in the following steps. The black arrows show the progression of dissection, whereas the dark red arrows denote the pull direction. The red lines in the last image indicate the anterior and posterior boundaries of the midgut. (B) A light microscope image of the adult fly intestine. The main regions and anatomical features are labeled. Red lines mark the boundaries of the midgut.

Figure 2
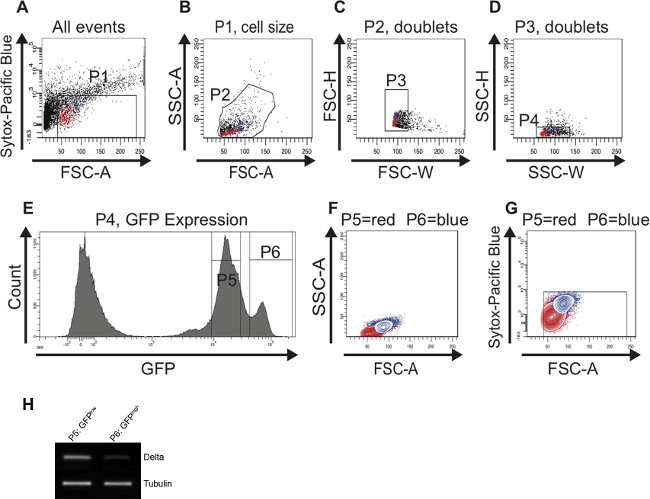
Figure 2: FAC sorting strategy to identify and isolate ISCs and EBs from young (7 days) midguts. For better visualization, cells representing ISCs are highlighted in red and cells representing EBs are highlighted in blue in the scatter plots (A-D) and in the contour plots (F,G). (A) The P1 gate is set to exclude dead, Sytox-positive cells plotted above 103 on the logarithmic y-axis. The threshold of the FSC-A is set at 40 to also exclude dead cells and debris. (B) Cells were gated for FSC-A and SSC-A to select cells according to size and granularity (gate P2). The histogram plot (E) was used in parallel to identify the GFP-positive cells in the FSC-A vs. SSC-A scatter plot (B). (C, D) The scatter plots FSC-H vs. FSC-W and SSC-H vs. SSC-W serve to remove aggregates and doublets and select for singlets (gate P3 in C and gate P4 in D). (E) The histogram plot shows the number of cells and their GFP intensity. Two peaks, GFPlow (gate P5) and GFPhigh (gate P6) can be distinguished. (F, G) Cells were back-gated in a contour plot to verify that the two distinct GFP-positive cell populations are of the correct size (F) and contain living cells (G). (H) Reverse Transcriptase (RT)-PCR for Dl on cDNA synthesized from RNA isolated from the cells present in the first peak (gate P5) and in the second peak (gate P6), respectively. More Dl expression could be detected in cells present in gate P5 vs. gate P6. Tubulin served as a loading control. Please click here to view a larger version of this figure.

Figure 3
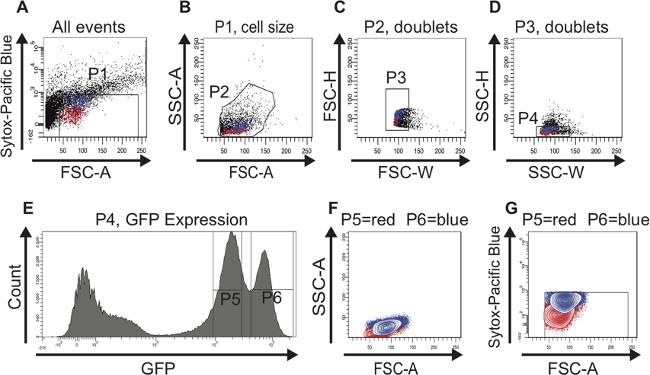
Figure 3: FAC sorting strategy to identify and isolate ISCs and EBs from old (60 days) midguts. For better visualization, cells representing ISCs are highlighted in red and cells representing EBs are highlighted in blue in the scatter plots (A-D) and in the contour plots (F,G). (A) The P1 gate is set to exclude dead, Sytox-positive cells plotted above 103 on the logarithmic y-axis. The threshold of the FSC-A is set at 40 to also exclude dead cells and debris. Of note, the age-dependent increase in larger GFP-positive cells is already obvious in this plot. (B) Cells were gated for FSC-A and SSC-A to select cells according to size and granularity (gate P2). The histogram plot (E) was used in parallel to identify the GFP-positive cells in the FSC-A vs. SSC-A scatter plot (B). (C, D) The scatter plots FSC-H vs. FSC-W and SSC-H vs. SSC-W serve to remove aggregates and doublets and select for singlets (gate P3 in C and gate P4 in D). (E) The histogram plot shows the number of cells and their GFP intensity. Two peaks, GFPlow (gate P5) and GFPhigh (gate P6) can be distinguished. Of note, the cell population GFPhigh containing larger cells has increased in number during aging. (F, G) Cells were back-gated in a contour plot to verify that the two distinct GFP-positive cell populations are of the correct size (F) and contain living cells (G). Please click here to view a larger version of this figure.

Figure 4
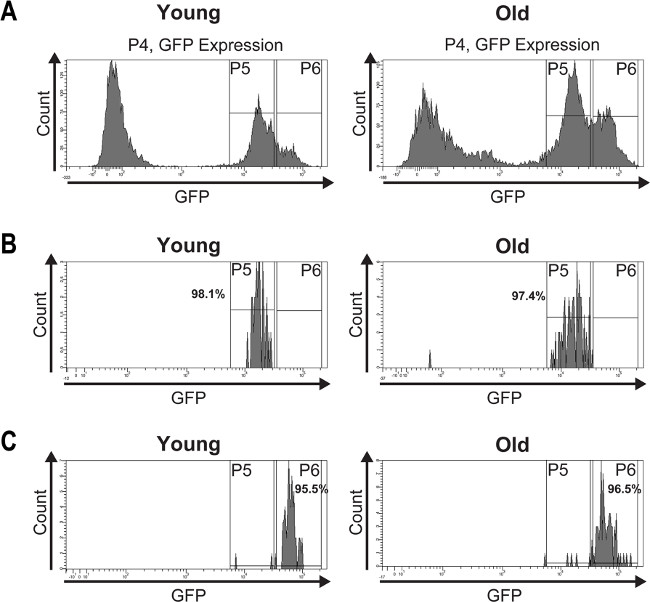
Figure 4: A post sort analysis was performed to determine the purity of the isolated ISCs and EBs. (A) GFP-positive cells from young (7 days) and old (60 days) midguts were FAC sorted and the histogram plots show their distribution into two peaks based on GFP intensity. (B) The post sort analysis demonstrates the purity of the isolated ISCs from young and old midguts which is >97%. (C) The post sort analysis of sorted EBs from young and old midguts shows a purity of >95%. The slight impurities may result from fluorescence quenching or mechanically damaged GFP expressing cells caused by re-sorting the cells. Please click here to view a larger version of this figure.

Figure 5
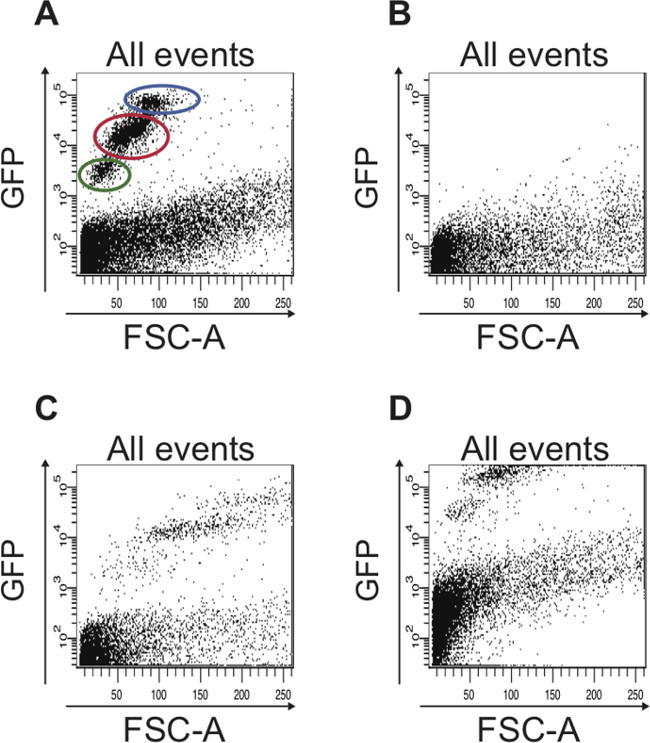
Figure 5: Examples of scatter plots that show suboptimal FACS data, which is seen when the FACS parameters were not set properly. (A) Representative FACS profile of all cells when the FACS parameters were set properly based on the controls described in the protocol. The cell population containing ISCs is circled in red and the cell population containing EBs is circled in blue. The cells circled in green are dead cells that have a stronger autofluorescence compared to living cells, which are plotted below 103 on the logarithmic y-axis. (B) The scatter plot depicts a typical result obtained when the FACS instrument was not calibrated. No GFP-positive cells are detected. (C) If the FSC is not set properly, the different GFP-positive cell populations are not detected. (D) If the FITC (GFP) channel is not adjusted correctly, the majority of GFP-positive cells to be sorted are not plotted in the scatter plot but rather along the upper edge of the plot. Also, in the plot shown here, the limit for autofluorescence was not adjusted, hence cells that plot above 102 on the logarithmic y-axis are actually autofluorescent and could be mistaken as GFP-positive cells.

List of Materials

Name of Material/ Equipment Company Catalog Number Comments/Description
Forceps: Dumont, Inox Biologie #5 Fine Science Tools 11252-20
SefarNitex 03-150um/38 (35 µm nylon mesh) Sefar 3A03-0150-102-00
Falcon 5ml Round Bottom Polystyrene Test Tube with Cell Strainer Snap Cap Corning 352235
Polymax 1040 Heidolph 543-42210-00
Albumin from bovine serum (BSA) Sigma A4503-50G
0.5% Trypsin-EDTA Invitrogen 15400-054 Trypsin obtained from a different company most likely has a different activity and the duration of the trypsin digest has to be adjusted accordingly.
SYTOX Blue Dead Cell Stain for flow cytometry Life Technologies S34857
RNAlater Stabilization Solution Life Technologies AM7023  other solutions, e.g. Trizol can be used for subsequent RNA isolation
FACSAria II cell sorter Becton Dickinson Turn on one hour prior to sorting

Preparação do Laboratório

Aging tissue is characterized by a continuous decline in functional ability. Adult stem cells are crucial in maintaining tissue homeostasis particularly in tissues that have a high turnover rate such as the intestinal epithelium. However, adult stem cells are also subject to aging processes and the concomitant decline in function. The Drosophila midgut has emerged as an ideal model system to study molecular mechanisms that interfere with the intestinal stem cells’ (ISCs) ability to function in tissue homeostasis. Although adult ISCs can be easily identified and isolated from midguts of young flies, it has been a major challenge to study endogenous molecular changes of ISCs during aging. This is due to the lack of a combination of molecular markers suitable to isolate ISCs from aged intestines. Here we propose a method that allows for successful dissociation of midgut tissue into living cells that can subsequently be separated into distinct populations by FACS. By using dissociated cells from the esg-Gal4, UAS-GFP fly line, in which both ISCs and the enteroblast (EB) progenitor cells express GFP, two populations of cells are distinguished based on different GFP intensities. These differences in GFP expression correlate with differences in cell size and granularity and represent enriched populations of ISCs and EBs. Intriguingly, the two GFP-positive cell populations remain distinctly separated during aging, presenting a novel technique for identifying and isolating cell populations enriched for either ISCs or EBs at any time point during aging. The further analysis, for example transcriptome analysis, of these particular cell populations at various time points during aging is now possible and this will facilitate the examination of endogenous molecular changes that occur in these cells during aging.

Aging tissue is characterized by a continuous decline in functional ability. Adult stem cells are crucial in maintaining tissue homeostasis particularly in tissues that have a high turnover rate such as the intestinal epithelium. However, adult stem cells are also subject to aging processes and the concomitant decline in function. The Drosophila midgut has emerged as an ideal model system to study molecular mechanisms that interfere with the intestinal stem cells’ (ISCs) ability to function in tissue homeostasis. Although adult ISCs can be easily identified and isolated from midguts of young flies, it has been a major challenge to study endogenous molecular changes of ISCs during aging. This is due to the lack of a combination of molecular markers suitable to isolate ISCs from aged intestines. Here we propose a method that allows for successful dissociation of midgut tissue into living cells that can subsequently be separated into distinct populations by FACS. By using dissociated cells from the esg-Gal4, UAS-GFP fly line, in which both ISCs and the enteroblast (EB) progenitor cells express GFP, two populations of cells are distinguished based on different GFP intensities. These differences in GFP expression correlate with differences in cell size and granularity and represent enriched populations of ISCs and EBs. Intriguingly, the two GFP-positive cell populations remain distinctly separated during aging, presenting a novel technique for identifying and isolating cell populations enriched for either ISCs or EBs at any time point during aging. The further analysis, for example transcriptome analysis, of these particular cell populations at various time points during aging is now possible and this will facilitate the examination of endogenous molecular changes that occur in these cells during aging.

Procedimento

Aging tissue is characterized by a continuous decline in functional ability. Adult stem cells are crucial in maintaining tissue homeostasis particularly in tissues that have a high turnover rate such as the intestinal epithelium. However, adult stem cells are also subject to aging processes and the concomitant decline in function. The Drosophila midgut has emerged as an ideal model system to study molecular mechanisms that interfere with the intestinal stem cells’ (ISCs) ability to function in tissue homeostasis. Although adult ISCs can be easily identified and isolated from midguts of young flies, it has been a major challenge to study endogenous molecular changes of ISCs during aging. This is due to the lack of a combination of molecular markers suitable to isolate ISCs from aged intestines. Here we propose a method that allows for successful dissociation of midgut tissue into living cells that can subsequently be separated into distinct populations by FACS. By using dissociated cells from the esg-Gal4, UAS-GFP fly line, in which both ISCs and the enteroblast (EB) progenitor cells express GFP, two populations of cells are distinguished based on different GFP intensities. These differences in GFP expression correlate with differences in cell size and granularity and represent enriched populations of ISCs and EBs. Intriguingly, the two GFP-positive cell populations remain distinctly separated during aging, presenting a novel technique for identifying and isolating cell populations enriched for either ISCs or EBs at any time point during aging. The further analysis, for example transcriptome analysis, of these particular cell populations at various time points during aging is now possible and this will facilitate the examination of endogenous molecular changes that occur in these cells during aging.

Tags