Animal experiments were performed in accordance with the European Directive (2010/63/UE) and the Italian law (D.Lvo 26/2014), and it followed principles of laboratory animal care. The Local Ethical Approval Panel approved the study.
1. Imaging Procedure
- Place the mouse in an anesthesia induction chamber filled with 2.5% isoflurane in 1 L/min pure oxygen. Verify the depth of anesthesia by unresponsiveness to toe pinch.
- Place the animal on a temperature controlled board in a supine position. Moisten the animal's eyes with eye salve, in order to avoid them running dry. Supply anesthetic gas flow (1.5% isoflurane) by placing the mouse's nose in the dedicated nose cone. If necessary, adjust the percentage of isoflurane from case to case, depending on the animal under study. Fix the board temperature at 40 °C.
- Coat the four limbs of the animal with conductive paste and tape them on the ECG electrodes embedded in the board. Measure body temperature with a rectal probe lubricated with petroleum jelly. Check that all the physiological measurements (ECG and respiration signal as well as temperature) are correctly acquired and displayed.
- Remove hair chemically from the abdomen with depilatory cream and coat it with acoustic coupling gel.
- Place the (13-24 MHz) US probe in the mechanical arm.
- Fix the US probe parallel to the animal and adjust its position in order to obtain longitudinal images of the abdominal aorta with the region of interest located in the focal zone.
- Collect anatomical information.
- Click on the button allowing the high frame rate ECG-gated acquisition9, choose a frame rate acquisition equal to 700 fps and start the acquisition. Note: In this way anatomical images of the vessel related to a single cardiac cycle can be acquired.
- Collect flow velocity information.
- Using the same scan projection, click on the PW-Doppler button, place the sample volume in the centre of the vessel and acquire images ensuring that the cine loop is not shorter than 3 s. Obtain these data maintaining the angle correction as small as possible, adjusting it from case to case on the basis of the US projection obtained.
- Remove the animal from the temperature controlled board and wait for complete recovery.
NOTE: In our experience this takes about 10 min. Do not leave and animal unattended until it has regained sufficient consciousness to maintain sternal recumbency.
2. Post-Processing
- Export B-mode and PW-Doppler images as DICOM files and save them on a personal computer. Transform PW-Doppler DICOM files to .tiff images.
- Process B-mode images.
- Import the corresponding DICOM file using the dedicated Graphical User Interface (GUI).
- To initialize contours, draw a line close to the far wall of the vessel (single click for starting it and double click for ending it) and double-click close to the near wall. A line parallel to that close to the far wall will appear automatically. Apply the algorithm on a single frame by pressing the "ANALYSE" button.
- Check the result. If the edges have been correctly identified (i.e., the evolution of the initialized points have detected both the posterior and the anterior wall), apply the algorithm on the whole cine-loop by clicking on the "GO" button. If the edges are not correctly identified, clear them by clicking on "Clear Contour" and initialize them again by repeating point 2.2.2.
NOTE: The algorithm is based on edge detection and contour tracking techniques and has been previously described in detail10. - Obtain the final result by pressing on the "RECORD" button and save the corresponding .mat file which contains instantaneous diameter values related to a single cardiac cycle.
- Open the GUI for the lnD-V loop implementation.
- Click on the "VELOCITY" button in order to start PW-Doppler image processing which leads to a single-beat mean velocity curve.
- Identify the PW-Doppler trace and locate the line corresponding to a velocity value equal to zero by pressing the "WHITE LINE" button.
- Perform velocity calibration and time calibration by using the "VELOCITY" and "TIME" buttons (in the Calibration panel), respectively. Pressing on these buttons allows one to draw a line whose length corresponds to the calibration factor inserted.
- Manually select a ROI containing the physiological signals by using the "ROI PHYSIO" button.
- Manually select a ROI containing the PW-Doppler trace by pressing the "ROI SIGNAL" button.
- Click on the "ANALYSE" button and check if the envelope is identified. If the result is not satisfactory, change the threshold (by typing the new value in the "Velocity Threshold" editable text field) and press the "ANALYSE" button again. Tune the threshold from case to case, depending on the quality of the images. Press the "ELABORATION" button.
- Locate the R-peaks of the ECG signal and divide the velocity envelope signal accordingly by clicking the "UPDATE" button. Choose beats that are not corrupted by noise or located in the inspiration phase by clicking on the "CHOOSE BEATS" button. In this way, obtain a single-beat mean velocity waveform.
- Use the Fast Fourier Transform method to interpolate the selected beats in the frequency domain and make them all composed of the same number of points, as detailed in reference11. Perform this operation automatically by simply pressing the return key on the PC keyboard once the beats have been selected. If the "MEAN VELOCITY" checkbox is checked the single beat mean velocity signal is achieved by dividing the maximum velocity curve by two, hypothesizing a parabolic velocity profile12. Press the "OK" button.
- Click on the "DIAMETER" button. Interpolate the single-beat diameter waveform in the time domain in order to obtain a single-beat diameter signal with the same sample frequency as the single-beat velocity signal by pressing the "INTERPOLATE" button. Click on the "OK" button.
NOTE: In order to have the single-beat diameter and mean velocity curves with the same sample frequency and the same number of data points, they are interpolated in the frequency domain. - Select the "Second derivative" approach as the alignment method (above the graph displaying the diameter and velocity waveforms) and click on the "UPDATE" button. The two curves will be automatically time-aligned using the second derivative method14.
- Build the final lnD-V loop by plotting the natural logarithm of the single-beat diameter values against the single-beat mean velocity values. This is automatically done when the two waveforms are aligned. Note: The points included between the 5% and the 90% of the maximum value of the single-beat mean velocity curve are automatically located and a linear interpolation on these points is applied to evaluate the slope of the linear part of the loop.
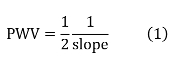
- Calculate PWV according to the following equation7
The proposed approach has been applied to mice abdominal aorta in a previous study11. The following figures show the results of the application of the described approach on real mice images. These data are from a single animal (wild type mice, 13 weeks old, strain: C57BL6, weight: 33 g) In particular, Figure 1 represents the result of the analysis of the US images. Edge detection and contour tracking techniques applied to B-mode images acquired with the high frame rate ECG-gated modality provide the diameter waveform; on the other hand, the identification of the PW-Doppler signal envelope leads to the single-beat mean velocity curve assessment. The evaluation of the single-beat mean velocity waveforms includes the average of data from different cardiac cycles. For the data shown, the standard deviation of the velocity curves (calculated as the average of the standard deviation obtained at each time point) is 0.0137 m/sec.
Single-beat diameter and mean velocity waveforms are interpolated in both the frequency and time domain and then time aligned (Figure 2A). The lnD-V loop is obtained by plotting the natural logarithm diameter values vs. the mean velocity measurements, as shown in Figure 2B. PWV is assessed by calculating the slope of the linear part of the loop, which is known to correspond to the early systolic phase. This portion is automatically identified as that corresponding to the upslope of the mean velocity curve. These figures indicate that the image processing operations required for the implementation of the proposed technique leads to a final lnD-V loop which is similar to that obtained in humans using a similar approach7. This suggests that this technique could represent a valid alternative for non-invasive PWV assessment in mice.
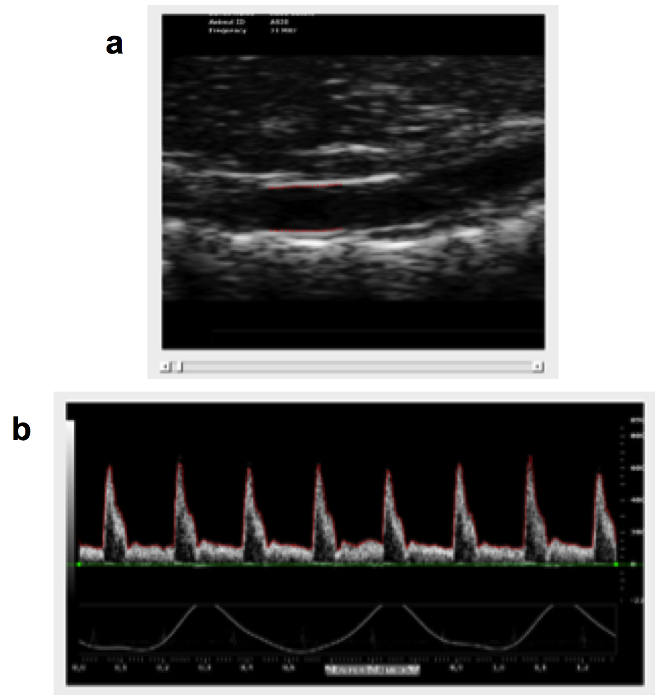
Figure 1: Processing of B-mode and PW-Doppler Images. B-Mode images (a) are processed using edge detection and contour tracking techniques. PW-Doppler images (b) are processed for the identification of the envelope signal from which the single-beat mean velocity waveform is obtained. Please click here to view a larger version of this figure.
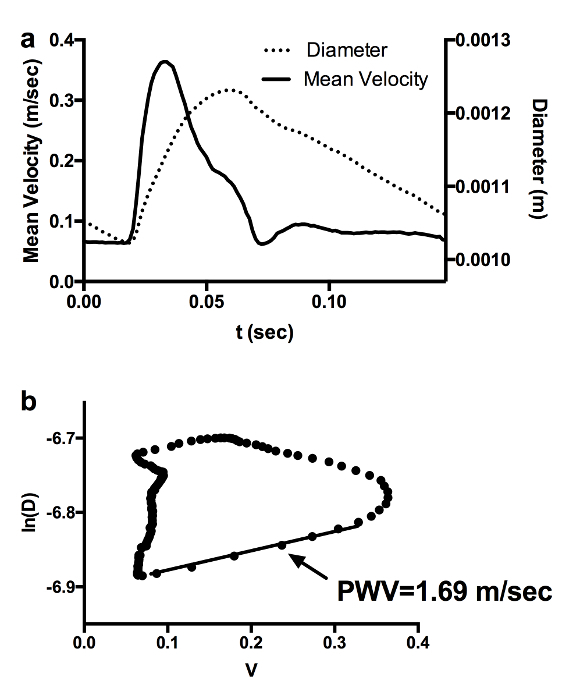
Figure 2: Implementation of lnD-V Loop for PWV Calculation. Diameter and mean velocity waveforms obtained from B-mode and PW-Doppler image processing. (a). The lnD-V loop is obtained by plotting the natural logarithm of the diameter values against the mean velocity values (b). Please click here to view a larger version of this figure.