Overview of Stage-Specific Zebrafish Embryo Injections
Antisense morpholino oligonucleotides (MO), which bind to a targeted mRNA and disrupt protein expression from that transcript, are widely used in gene knockdown (loss-of-function) studies in zebrafish13,14. Gene Tools, LLC offers MOs that are tagged with either carboxyfluorescein (emits green fluorescence) or lissamine (emits red fluorescence) to detect MO in injected embryos using fluorescent microscopy. By injecting MO into the yolk cell at different stages of zebrafish development, it is possible to deliver the MO to specific compartments of the embryo (Figures 1A-F). MO injected into the yolk between the 1-4 cell stages (0-1 hpf) enters all embryonic cells (Figures 1A, D, D’) via connections with the yolk that persist until the 32-cell stage15 to facilitate global knockdown. MO injected into the yolk during midblastula stages (2.5-3 hpf) can enter the progenitors of the DFCs (Figures 1B, E, E’) likely through cytoplasmic bridges8 and knockdown gene function specifically in the DFC/KV cell lineage12, without entering most other embryonic cell lineages. As an important control to test whether gene function is required in DFC/KV or also in yolk12,16, it is also possible to restrict MO to the yolk cell by injecting between the dome-30% epiboly stages (~4.5 hpf) after all cytoplasmic bridges have closed (Figures 1C, F, F’). These injections have been used in combination to analyze gene function in DFC/KV cells17-24. To assess fluid flow in KV, fluorescent microbeads are injected into the KV lumen between the 6-10 somite stages (12-14 hpf) and then immediately imaged using videomicroscopy (Figures 1G-J). Microbeads are available that emit red or green fluorescence (or both), so it is possible to use different channels to image fluorescent microbeads and MO.
1. Stage-specific Injection of Morpholinos (MO)
Injection of MO into zebrafish embryos has been demonstrated previously25,26. Here, we briefly describe stage-specific MO injections. Following all injections, embryos are transferred to a Petri dish and incubated at 28.5 °C.
2. Selecting Injected Embryos for Analysis
3. Mounting Embryos to Analyze Fluid Flow in KV
4. Injection of Fluorescent Microbeads into KV
5. Visualization and Analysis of KV Fluid Flow
Stage-specific MO injections provide a useful approach to analyze gene function in specific compartments of the embryo. Figure 1 presents a flow chart of the injection strategies used to test gene function in DFC/KV cells and how to introduce fluorescent beads to visualize fluid flow in KV. The distribution of fluorescent MO in successful stage-specific injected embryos is shown schematically in Figures 1D-F and in live embryos in Figure 2. An unsuccessful MO injection, in which the MO remains aggregated in the yolk cell, is shown in Figure 2D.
Successfully injected embryos-selected based on the localization of fluorescent MO-can be mounted at the 4-6 somite stages for delivery of fluorescent microbeads into the KV lumen (Figures 1G-H) to analyze fluid flow. Videomicroscopy is used to record bead movements in KV (Figures 1I-J), which can be analyzed qualitatively (Figures 3A-B) or quantitatively (Figures 3C-E) using ImageJ software. In a control embryo with normal flow, beads follow counterclockwise paths that can be visualized by making a maximum projection of fluorescent bead positions over time (Figure 3A) or by tracking individual beads over time (Figure 3C). To demonstrate loss of coordinated flow, we injected embryos with MO to knockdown Rho kinase 2b (Rock2b), which we have previously shown disrupts flow18. In Rock2b MO injected embryos, beads move randomly in KV (Figures 3B, D). ImageJ software was used to calculate the velocity of individual bead tracks. The average velocity of 5 beads from control and Rock2b MO embryos is shown in Figure 3E.
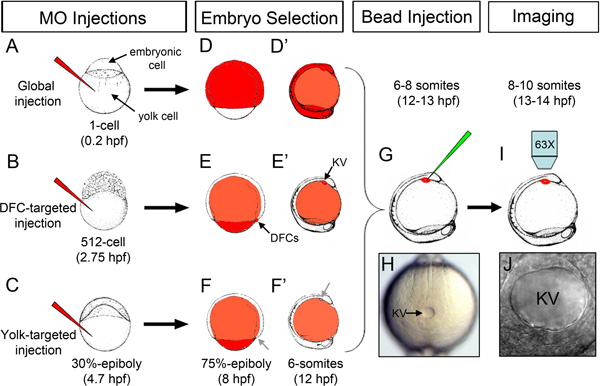
Figure 1. Overview of stage-specific MO injections and microbead injection into KV. (A) Injection of fluorescent MO (red) into the yolk at the 1-cell stage for global distribution of MO throughout the embryo. (B) DFC-targeted MO injection at the 512-cell stage to load MO into DFC/KV cells. (C) Yolk-targeted MO injection at 30%-epiboly stage to restrict MO to the yolk. (D-F’) Schematic representation of the distribution of fluorescent MO (red) in successfully injected embryos at the 75% epiboly stage (D, E, F) and the 6 somite stage (D’, E’, F’) following stage-specific injections. MO accumulates in the DFC/KV cell lineage when injected at the 512-cell stage (arrows in E, E’), but not when injected at 30% epiboly (arrows in F, F’). (G) Injection of fluorescent microbeads (green) into the KV lumen. (H) A properly mounted embryo with KV (arrow) facing up for microbead injection. (I) Imaging beads movement in KV using an upright microscope. (J) High magnification of an intact KV lumen injected with microbeads. Embryonic stages and embryo drawings are based on ref. 28.
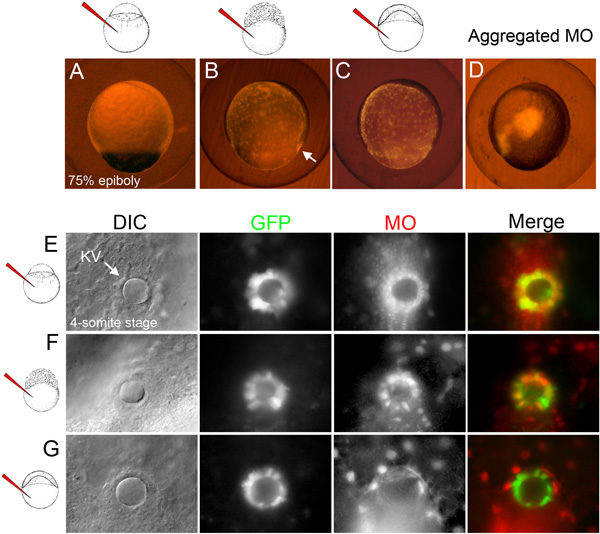
Figure 2. Selection of embryos following stage-specific MO injections. (A-C) Examples of selected embryos at the 75% epiboly stage (8 hpf) in which fluorescent MO (red) has either incorporated in all embryonic cells following global MO injection (A), diffused through the yolk and DFCs (arrow) following DFC-targeted MO injection (B) or remained in the yolk following yolk-targeted MO injection (C). (D) Example of an excluded embryo in which the fluorescent MO aggregated at the injection site. (E-G) Examples of fluorescent MO (red) distribution in selected embryos at the 4-somite stage (11.5 hpf). DIC images identify the KV lumen (arrow) in transgenic Tg(Dusp6:d2EGFP) embryos that express GFP in KV cells27. In the global MO injected embryo, MO was observed in KV and all surrounding cells (E). In the DFC-targeted MO injected embryo, MO co-localized with GFP in most KV cells and was also present in underlying yolk nuclei (F). In the yolk-targeted embryo, MO was found exclusively in yolk nuclei (G).
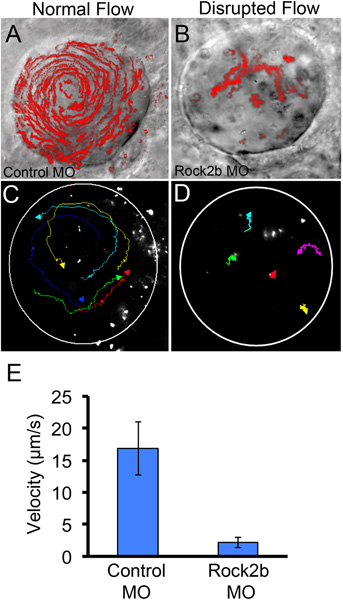
Figure 3. Qualitative and quantitative analyses of fluid flow in KV. (A-B) For qualitative analysis of flow, a maximum projection of a 10 sec movie showing movement of all fluorescent microbeads injected into KV has been superimposed on a DIC image of the KV lumen in a global control MO (A) or Rock2b MO (B) injected embryo. (C-E) To quantify flow, movement of individual microbeads (n=5) was tracked in a control embryo (C) and Rock2b MO injected embryo (D) and used to calculate an average bead velocity (E). Circles (C-D) approximate the KV lumen boundaries. Error bars (E) represent one standard deviation.
Name of Reagent/Material | Company | Catalogue Number |
Standard Control oligo-Lissamine tagged | Gene Tools, LLC | |
Custom Rock2b morpholino oligo | Gene Tools, LLC | |
Fluoresbrite Multifluorescent 0.5 micron Microspheres | Polysciences, Inc. | 24054 |
Internal organs such as the heart, brain, and gut develop left-right (LR) asymmetries that are critical for their normal functions1. Motile cilia are involved in establishing LR asymmetry in vertebrate embryos, including mouse, frog, and zebrafish2-6. These ‘LR cilia’ generate asymmetric fluid flow that is necessary to trigger a conserved asymmetric Nodal (TGF-β superfamily) signaling cascade in the left lateral plate mesoderm, which is thought to provide LR patterning information for developing organs7. Thus, to understand mechanisms underlying LR patterning, it is essential to identify genes that regulate the organization of LR ciliated cells, the motility and length of LR cilia and their ability to generate robust asymmetric flow.
In the zebrafish embryo, LR cilia are located in Kupffer’s vesicle (KV)2,4,5. KV is comprised of a single layer of monociliated epithelial cells that enclose a fluid-filled lumen. Fate mapping has shown that KV is derived from a group of ~20-30 cells known as dorsal forerunner cells (DFCs) that migrate at the dorsal blastoderm margin during epiboly stages8,9. During early somite stages, DFCs cluster and differentiate into ciliated epithelial cells to form KV in the tailbud of the embryo10,11. The ability to identify and track DFCs—in combination with optical transparency and rapid development of the zebrafish embryo—make zebrafish KV an excellent model system to study LR ciliated cells.
Interestingly, progenitors of the DFC/KV cell lineage retain cytoplasmic bridges between the yolk cell up to 4 hr post-fertilization (hpf), whereas cytoplasmic bridges between the yolk cell and other embryonic cells close after 2 hpf8. Taking advantage of these cytoplasmic bridges, we developed a stage-specific injection strategy to deliver morpholino oligonucleotides (MO) exclusively to DFCs and knockdown the function of a targeted gene in these cells12. This technique creates chimeric embryos in which gene function is knocked down in the DFC/KV lineage developing in the context of a wild-type embryo. To analyze asymmetric fluid flow in KV, we inject fluorescent microbeads into the KV lumen and record bead movement using videomicroscopy2. Fluid flow is easily visualized and can be quantified by tracking bead displacement over time.
Here, using the stage-specific DFC-targeted gene knockdown technique and injection of fluorescent microbeads into KV to visualize flow, we present a protocol that provides an effective approach to characterize the role of a particular gene during KV development and function.