This orthotopic model of human prostate cancer allows for quantification of tumor size, circulating tumor cells, and formation of distinct metastasis to the lung. As cells must escape the primary organ, enter the blood stream, and implant into a secondary site, this model effectively recapitulates the scenario in humans.
Method Article
An Orthotopic Murine Model of Human Prostate Cancer Metastasis
In This Article
Summary
Abstract
Our laboratory has developed a novel orthotopic implantation model of human prostate cancer (PCa). As PCa death is not due to the primary tumor, but rather the formation of distinct metastasis, the ability to effectively model this progression pre-clinically is of high value. In this model, cells are directly implanted into the ventral lobe of the prostate in Balb/c athymic mice, and allowed to progress for 4-6 weeks. At experiment termination, several distinct endpoints can be measured, such as size and molecular characterization of the primary tumor, the presence and quantification of circulating tumor cells in the blood and bone marrow, and formation of metastasis to the lung. In addition to a variety of endpoints, this model provides a picture of a cells ability to invade and escape the primary organ, enter and survive in the circulatory system, and implant and grow in a secondary site. This model has been used effectively to measure metastatic response to both changes in protein expression as well as to response to small molecule therapeutics, in a short turnaround time.
Introduction
Prostate cancer (PCa) is the most commonly diagnosed cancer in men, and the second leading cause of cancer death in the United States1. Death from PCa is not due to formation of the primary tumor, but rather the formation of metastasis. Therefore, prevention of metastasis in patients is of high importance. Mouse models of PCa offer a diversity of options to uncover critical biological information about this disease.
A variety of mouse models of PCa exist, each with inherent benefits and limitations. While the frequency of PCa in humans is high, naturally occurring PCa is extremely uncommon in mice2, despite equal susceptibility of mice overall to cancer3. One rodent exception is the development of PCa in Lobund Wistar rats, which can achieve rates of PCa of 90% by 12 months of age via induction of methylnitrosourea and testosterone4. For this reason, induced model systems, such as the TRAMP (transgenic adenocarcinoma of the mouse prostate) model are commonly used. The TRAMP model can induce transgene expression specifically in the prostate, and undergoes the normal progression of PCa, from hyperplasia to prostatic intraepithelial neoplasia (PIN) to lymphatic and pulmonary metastasis5-6. These models provide the benefits of being able to measure the full range of tumor progression, as well as contain an intact immune system. However, the molecular events underlying PCa development can differ between mice and humans, and correlations between mice and human clinical studies have shown variability. Additionally, both of these models are time-consuming, as an example the TRAMP model requires approximately 28 weeks in order to develop metastasis.
In studying metastasis, frequently a tail-vein or left ventricle injection model is used. This model benefits from rapid turnaround time, and can additionally measure the presence of bone metastasis using specific cell lines and conditions. Yang et al. have reported that subcutaneous injection of GFP-positive PC3 cells can cause widely disseminated bone metastasis7, and tail vein and intercardiac injections have also generated bone metastasis development8-9. The major limitations of these models relate to the lack of a primary tumor residing within the prostate gland itself. Further, for models reliant upon injection of cancer cells into the circulation, this bypasses the whole first half of the metastatic cascade. It thereby precludes examination of initial steps, including invasion through the primary organ, which are biologically crucial measures of metastatic transformation. Many regulators of metastatic transformation directly affect early cell invasion. Early steps in the metastatic cascade constitute high priority sites for therapeutic targeting, as once cancer cells disseminate, clonal variation expands greatly, thereby increasing biological diversity and diminishing effective therapeutic targeting.
In an attempt to respond to many of the limitations of these models, our laboratory has developed an orthotopic model of human PCa in which the human PCa PC3-M cell line is directly implanted into the prostate of Balb/c athymic mice. After 4-6 weeks, tumor size, presence of circulating tumor cells (CTCs), and metastasis to the lungs and lymph nodes can all be quantified. We have effectively used this model to evaluate the efficacy of 4',5,7-trihydroxyisoflavone (genistein) to inhibit human PCa metastasis10. Dietary consumption of genistein has been linked to decreases in prostate cancer metastasis and death11-12, but previously no study had determined whether administering of genistein could alter PCa metastasis in animals or men. In this study we demonstrated that treatment with genistein greatly reduced the number of lung metastasis. Additionally, we determined genistein altered the activation and expression of several important pro-metastatic proteins in the primary tumor, including focal adhesion kinase (FAK), p38 mitogen-activated protein kinase (p38 MAPK), and heat shock protein 27 (HSP27).
These results corresponded with observations in the clinic. Using blood obtained from the mice, we were able to accurately measure the blood concentrations of genistein and observed these to be similar to levels in humans with regular dietary consumption of genistein. Additionally, a Phase II study performed by our group determined that upon treatment with genistein, men experienced decreases in prostate tissue mRNA expression of genes associated with cellular invasion and metastasis, specifically matrix metalloproteinase type 2 (MMP-2)13.
We have also used this model to evaluate the effect of altered gene-product expression in the primary tumor on human PCa metastasis14. The tumor suppressor endoglin is a member of the TGFβ superfamily and suppresses human PCa cellular invasion in vitro via alteration of Smad signaling15. We extended these studies to determine the effect of endoglin on human PCa metastasis. Stable endoglin knockdown, vector control or endoglin over expression cell lines were implanted into mice. Endoglin knockdown cells showed the highest number of lung metastasis, as well as CTCs in 38% of the mice. Mice implanted with control vector showed a medium response, with less lung metastasis per mouse, and CTCs in only 18% of mice. High endoglin implanted mice showed almost complete suppression of lung metastasis, and complete suppression of CTCs.
These are just two examples of the wide variety of applications this technique has. From drug discovery, to modeling changes in molecular biology, this model offers a high throughput method of evaluating the effects of various functions on tumor growth and molecular changes, presence of CTCs, and formation of distinct metastasis in the lung and lymph nodes.
Protocol
For all procedures involving animals, protocols were approved by the Institutional Animal Care and Use Committee (IACUC) at Northwestern University. Surgical techniques and animal care conditions were observed by veterinary staff and modified to minimize animal stress or mortality. Individual institutions may have different requirements and it is important to work with IACUC and animal staff when developing and executing this surgical technique.
1. Preparation of Cells for Injection
- This step should be performed as close as possible to starting surgeries. Trypsinize cells being used for the experiment, remove from plate, and neutralize with media. The PC3-M human PCa cell line stably transfected with GFP has been successfully used for these experiments, due to rapid growth conditions of the PC3-M cells. GFP was added for additional ease of detection of the lung metastasis in lung tissue samples, and rapid determination of cancer cells versus immune cells in cultures obtained from blood and bone marrow to identify circulating tumor cells. If modifying a specific gene of interest, then creation of stable cell lines with this gene alteration is performed first, followed by transfection with GFP. If GFP will alter the function of this gene of interest, GFP it can be omitted. This will make detection of lung metastasis more difficult, but still achievable. Additionally, if using specific imaging technology using fluorescent markers, such as luciferase-based IVIS, other fluorescent proteins can be used instead.
- Centrifuge for 5 min at 225 x g.
- Isolate 2.5 x 10⁵ cells, and centrifuge for 5 min at 225 x g.
- Remove supernatant and resuspend cells in 20 μl of sterile saline.
- Aspirate cell suspension into a 0.5 ml syringe with a permanent 28 ½ G needle (recommended: Kendall Monojet, as other brands have caused issues), ensuring no air enters the needle along with the suspension.
- Wrap syringe in sterile foil and store on ice until used.
2. Orthotopic Implantation of Human Prostate Cancer Cells
- Male 6-8 week old Balb/c athymic mice are used. The ideal mouse body weight for surgery is 19-21 g, and mice should be allowed to grow to at least 18 g before surgery. Smaller animals are technically more difficult to operate on. Larger animals tend to experience slower kinetics of tumor growth and metastasis. Animals should be housed in the animal facility at least one week prior to surgery to minimize animal stress. Depending on the experimental design, drug treatment may begin one week prior to surgery.
- Inject pre-surgery pain medication according to animal facility's instructions. 0.1 mg/kg body weight subcutaneous Buprenex using a 30 ½ G needle attached to a 1 ml syringe is suggested.
- Place animals into the isoflurane chamber and wait until animals are fully anesthetized. No toe reflex of muscle tone should be present at this point. This method is recommended, but if unavailable, other methods of anesthesia can be used according to animal facility's instructions.
- Move animal out of the isoflurane chamber into a sterile procedure hood. Place animal into the nose cone apparatus, and re-ensure that animal is under full anesthetization before proceeding.
- Disinfect lower abdominal region with a Betadine scrub with sterile cotton balls, wipe with alcohol wipe, and final spray with Betadine solution. Allow to dry.
- Using either a sterile scalpel or sharpened sterile surgical scissors, a low midline abdominal incision of approximately 3-4 mm is made. Gently lift the bladder using forceps and identify the ventral lobe of the prostate. These two lobes are located directly beneath the bladder. Some mice will have a small layer of fat covering the prostate which can be gently moved aside using a sterile cotton swab. Minimize all movement of organs and musculature if possible.
- Inject 20 ul volume cell solution into the prostate gland, minimizing leakage and ensuring a small bubble is observed.
- Replace bladder and close the muscle layer using 4.0 absorbable vicryl monofilament sutures in a simple interrupted pattern.
- Close the skin layer using sterile 9 mm staples.
- Remove animal from isoflurane anesthesia and monitor until awake and moving normally. Place on heating pad during recovery period.
- If multiple surgeries are being performed, between surgeries, clean all tools with 70% ethanol, and sterilize using a glass bead sterilizer. Allow tools to cool fully before next animal. Do not reuse sutures, cotton balls, or sterile swabs.
3. Monitoring Animals
- Administer pain medication based on animal facility's instructions. 4 hr post-surgery administering of one dose of subcutaneous Meloxicam at 1 mg/kg body weight using a 30 ½ G needle attached to a 1 ml syringe is suggested, followed by an additional dose every 12-24 hr for the next 48 hr.
- Staples can be removed from animals 7-10 days post-surgery once the wound has healed.
- Monitor animal weight, food consumption, and palpate mice for tumors twice a week until termination of experiment. Increase frequency up to every other day when tumors become visible to check for animals under significant tumor burden or duress. Early death from this model is due to the large primary tumor burden, as primary tumors can block urinary flow, so any animals with a loss of greater than 15% body weight or a primary tumor reaching a diameter of 1.5 cm should be necropsied immediately to prevent urinary obstruction and animal death.
- Monitor for need for additional enrichment of the animal environment. The stress of surgery increases animal infighting. The addition of two plastic huts per cage instead of one and additional behavioral enrichment can decrease these incidents. Discuss with veterinary staff options available at the facility the animals are housed at. Given the lack of eyelashes on this strain of mice, huts and enrichment made of paper are not recommended as they can irritate eyes.
4. Necropsy Procedures
- After 4-6 weeks, tumors are fully evident and animals begin to lose weight due to increased tumor burden. Tumors can typically be palpated and/or are visually apparent. Necropsy should be performed at this point. Perform an intraperitoneal injection of Nembutal at 260 mg/kg body weight using a 30 ½ gauge needle attached to a 1 ml syringe, and allow animals to become fully unconscious, with no toe reflex or muscle tone present.
- Once the animal is anesthetized, using sterile surgical scissors or a scalpel, cut horizontally across the torso of the animal directly under the rib cage, then vertically to the armpit along the side of the animal, expose the heart. Perform a terminal cardiac puncture using a 30 ½ G needle attached to a 1 ml syringe flushed with 4% sodium citrate in DPBS to prevent coagulation, obtaining as much blood as possible from the animal.
- Remove the lungs from the animal by cutting the trachea with surgical scissors or a scalpel and immediately place into a tissue culture cassette and into 10% formalin.
- Remove the primary prostate tumor from the animal by individually cutting any blood vessels attached to the tumor and ensuring no additional organs such as the vas deferens or seminal vesicles are attached.
- Record the weight and size of the tumor. Measure the weight of the tumor in grams on a laboratory scale. Using calipers, measure the length of the longest diameter of the tumor in centimeters, and the corresponding perpendicular axis. Multiply these values to obtain tumor size. Depending on intended usage, immediately snap freeze in liquid nitrogen, and/or place into a tissue cassette into 10% formalin.
- Expose the hip and knee joints with surgical scissors or a scalpel, and disconnect leg joints, being careful to keep the femur intact. Remove the femurs from the animal and place into sterile saline.
- Obtain any other organs or materials of interest, and dispose of animal according to your institute's instructions. In particular, regional lymph nodes tend to have metastasis, tend to be enlarged if harboring them, and can be harvested. However, care should be taken as this can be affected by changes in hydrostatic pressure caused by the surgical procedure.
5. Processing and Immunostaining of Lung Tissue Samples
- Within 24-48 hr of placing tissue into 10% formalin in PBS, embed the lungs into paraffin.
- Section the lungs at 45 μm step sections, taking 2-3 adjacent 4 μm lung tissue sections.
- If GFP-positive cells were used (recommended), perform immunostaining for GFP. If not, perform standard Hematoxylin and eosin (H&E) staining.
NOTE: The Dako Envision+ Kit combined with the GFP antibody from Invitrogen has been used successfully according to manufacturer's instructions, but this can be modified to any immunohistochemistry procedure.
- Score metastasis in a blinded fashion. If GFP-positive, tumor cells will stain brown in addition to having large and distinctive nuclei. When first scoring metastasis, consult a pathologist to ensure correct scoring, and use H&E stained lung tissue to confirm presence of tumor cells, and not infiltrating immune cells.
6. Identification of Circulating Tumor Cells from Blood and Bone Marrow
- Add all blood collected from the necropsy to a 1.5 ml centrifuge tube. Centrifuge 5 min at 800 x g.
- Remove the plasma and add 1 ml ACK Lysis Buffer (154.95 mM Ammonium Chloride, 9.99 mM Potassium Bicarbonate, 0.0995 mM EDTA,). Allow the blood to sit at room temperature 3-5 min.
- Centrifuge 5 min at 800 x g.
- Remove the supernatant and add 1 ml of cell culture media containing antibiotics. Add cells to a T75 flask containing 9 ml of cell culture media.
- Culture cells at 37 °C in a humidified atmosphere containing 5% CO2 for 10 days, checking for the presence of CTCs every 2-3 days.
- For bone marrow, remove all muscle tissue from femurs using a pair of scissors, a razor blade, or scalpel. Remove the ends of the bone, as close to the ends as possible.
- Using a 23 ¾ G needle, gently eject the bone marrow from the femur into a 1.5 ml centrifuge tube.
- Add to 1 ml of cell culture media and gently pipette well to mix.
- Add cells to a T75 flask containing 9 ml of cell culture media.
7. Molecular Characterization of Tumors
- For polymerase chain reaction (PCR) assays, tumor samples that were snap frozen in liquid nitrogen are first pulverized on dry ice and then homogenized using a tissue homogenizer for 3-5 min with 1 ml TRIzol. TRIzol extraction is performed per manufacturer's instructions. Purify RNA using the RNeasy RNA isolation kit according to manufacturer's instructions. Performing cDNA synthesis and quantitative real time PCR (qRT/PCR) using TaqMan reagents according to manufacturer's instructions is recommended but can be modified for any PCR method currently employed.
- For Western blot assays, homogenize tissues using a tissue homogenizer for 3-5 min with 1 ml of lysis buffer: PBS (137 mM NaCl, 10 mM Na phosphate, 2.7 mM KCl), 0.5% Triton X-100, 1 mM EDTA, 2.5 mM sodium pyrophosphate, 1 mM β-glycerophosphate, with addition of protease inhibitor cocktail, phosphate inhibitor cocktails 2 and 3, 10 mM sodium fluoride, and 1 mM sodium orthovanadate. The cell lysate mixture is placed in a 1.5 ml centrifuge tube.
- Centrifuge cell lysate mixture for 10 min at 13,000 x g.
- Remove supernatant and place in a new 1.5 ml centrifuge tube and centrifuged again for 10 min at 13,000 x g. If cell debris is still present, an additional centrifugation step can be performed.
- Remove supernatant and perform a Western blot as per normal laboratory conditions.
Results
For this experiment, we show a representative group of mice obtained during these surgical procedures. Five mice were implanted with GFP-positive PC3-M cells containing a control vector. Tumors were allowed to grow for six weeks, and then multiple parameters were evaluated. In Figures 1A and 1B, we show the change in body weight and food consumption of mice, respectively. There is a small dip in body weight and food consumption around the date of surgery due to the anesthesia. During the course of the experiment, body weight slowly increases post-surgery, and then begins to decline towards the end of the experiment as tumor burden reaches a critical level. This is matched by the food consumption in these mice.
In Figures 2A and 2B, representative tumor sizes obtained are shown. Individual tumor sizes vary, but on average we achieve tumors of approximately 1 gram, with normal variance between 0.5-1.5 g, and a tumor size of 1 cm2, with a normal variance of 0.5-1.5 cm2. Though the size of the tumors varies, these do not correlate with the number of resultant metastasis, shown both in this paper and our previously published works10. However, from this model, one can determine the effect of drug treatment or molecular changes on the tumor weight and size. An important consideration in this model is when the appropriate endpoint for the experiment is. In Figures 2C and 2D, we show changes in tumor weight and tumor size in one particular PC3-M cell line stably transfected with GFP and a control vector at 4 weeks and at 6 weeks. In the last two weeks, the average tumor weight increased 2.7 fold, and the tumor size 1.9 fold. This shows the addition of 1-2 extra weeks on the experiment can dramatically influence results. As a multitude of factors can alter the growth of the tumors, including the age and size of mice, number of passages of the cells, etc. we recommend not terminating experiments until visible tumors are observed in the majority of the mice.
In Figures 3A-3C, the number of metastases is quantified three different ways. In Figure 3A, the total number of GFP-positive human PCa cells are represented. In Figure 3B, the number of cell loci, or locations where metastatic deposits are present, is shown. Finally, in Figure 3C, the number of distinct metastasis, as defined by a clearly bound group of cells showing 5 or more GFP-positive human PCa cells, is displayed. Representative pictures of these different conditions are shown in Figures 4A-4D. In Figure 4A, an individual cell at 40x magnitude is highlighted with an arrow. Note the brown staining and large distinct nuclei. An adjacent lung section stained using H&E staining is shown in Figure 4B, confirming that without GFP, detection of cancer cells is still readily achievable. This photo is taken at 40x magnitude and the cell is highlighted with an arrow. In Figure 4C, several loci of varying cell number at 10x magnitude are displayed and each locus highlighted with an arrow. . Lastly, in Figure 4D, a metastatic deposit of 10 cells is shown. How these methods influence the data is shown by differences in Mouse 1 and Mouse 3. Mouse 1 has a lower number of total cells in the lung, with an average of 21.5 cells per lung section, compared to Mouse 3 which has an average of 700 cells per lung section. However, Mouse 3 has fewer loci, or locations where cells are present than Mouse 1. Mouse 3 has relatively few sites of metastasis, but the number of cells per area is very high at 82 cells per loci due to several very large cell number metastases. In contrast, Mouse 1 has more unique loci, but significantly fewer cells per location at only an average of two cells per location. These different parameters can shed light on the kinetics of cells trafficking to the lung and their ability to begin to grow and proliferate.
Additionally, in Figure 3D, we show changes in total metastatic cells per lung in mice necropsied at four versus six weeks. As described in Figures 2C and 2D, significant changes are observed in the tumor weight and size in the final two weeks of an experiment. This is recapitulated in Figure 3D. Mice necropsied at four weeks showed no metastatic development, while mice at 6 weeks showed metastatic cells in all mice evaluated. This further demonstrates the importance of ensuring mice necropsies are performed at a late-stage endpoint to ensure formation of metastasis has occurred.
An added measurement in this model is molecular changes occurring inside the primary tumor. In Figures 5A-5C we show three example qRT/PCR experiments measuring three genes of interest in metastatic progression, matrix metalloproteinase type 2 (MMP-2), matrix metalloproteinase type 9 (MMP-9), and heat shock protein 27 (HSP27) respectively. Any gene of interest measured via qRT/PCR can be detected using this technique. Additionally, protein levels can be quantified using Western blot procedures.
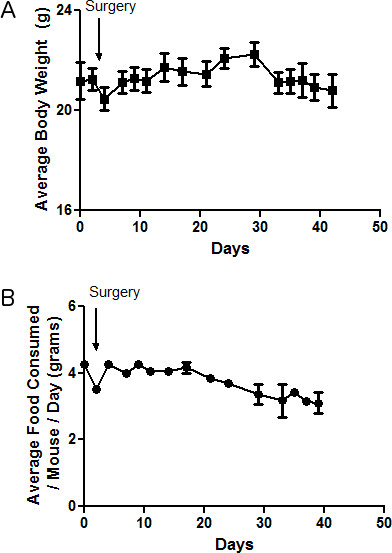
Figure 1. Observed body weight and food consumption in animals. A-B) Body weight in grams, or average food consumption per mouse per day in grams, is recorded throughout the experiment and shown in A) and B) respectively.
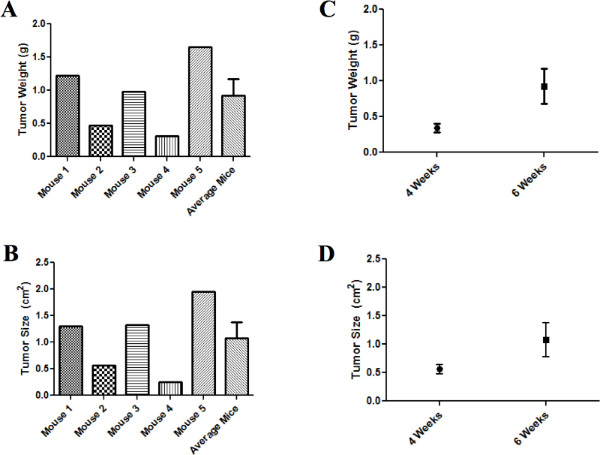
Figure 2. Tumor size and tumor weight in individual and groups of mice. A-B) Tumor weight in grams and tumor size in centimeters squared of five representative control mice and the average of the five mice at the end of six weeks are shown in A) and B) respectively. C-D) A comparison of tumor weight in grams and tumor size in centimeters squared between groups of mice necropsied at four and six weeks. Click here to view larger figure.
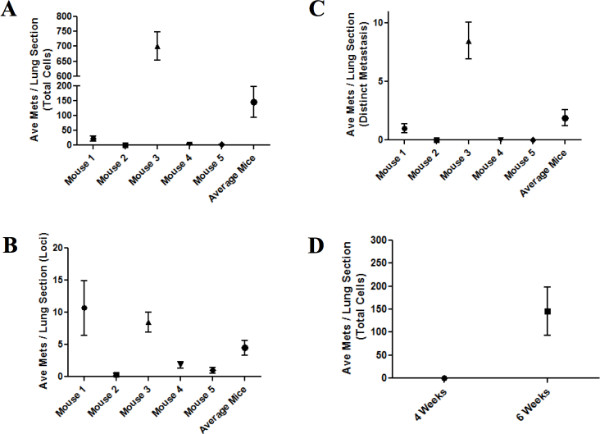
Figure 3. Metastatic spread in individual and groups of mice. A-C) The average metastatic spread per lung section for five individual mice and the average of the five mice at the end of six weeks represented as either total number of cells (A), locations of metastatic cells (B), or distinct metastasis as defined by 5+ cells in a clearly defined cluster (C). D) A comparison of the average number of metastatic cells per lung section per mouse between mice necropsied at four and six weeks. Click here to view larger figure.
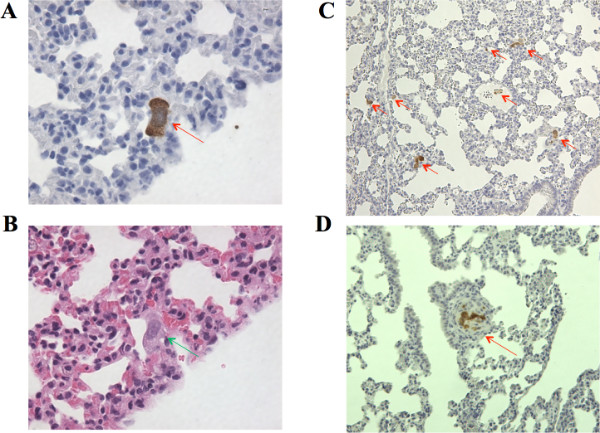
Figure 4. Representative images of lung metastases. A) An individual GFP positive lung cell at 40X objective is highlighted with an arrow. B) An adjacent lung section from A), showing the same cell under H&E staining. C) One lung section at 10X objective with seven individual loci containing varying numbers of cells. D) One distinct metastasis at 10X objective containing 10 cancer cells clearly defined as one group.
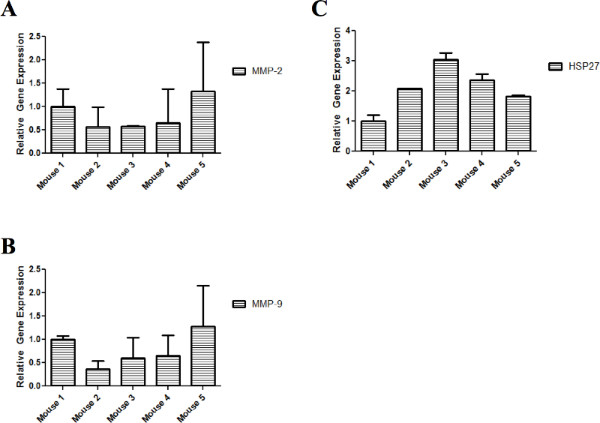
Figure 5. PCR analysis of three metastatic genes of interest. qRT/PCR was performed on individual tumor samples collected from mice at six weeks. Relative mRNA transcript levels of MMP-2 (A), MMP-9 (B), and HSP27 (C) are measured, normalized to GAPDH. Click here to view larger figure.
Discussion
In this paper we provide a novel murine model of human PCa metastasis. In this model, the human PCa cell lines PC3-M is orthotopically implanted directly into the prostate of Balb/c athymic mice and tumors allowed to develop for 4-6 weeks. In the representative results section, we show examples of data that can be collected, including mouse weight and food consumption, tumor size and weight, molecular characteristics of the tumor, and formation of distinct metastasis to the lung. Additionally, a wide variety of additional outputs can be studied depending on particular research interests. One example is the presence of CTCs to the blood and bone marrow. As CTCs are a relatively infrequent event (we observe CTCs in approximately 5-20% of control animals), we were not surprised that none of the five mice in these experiments developed CTCs. Our laboratory has also used this model to determine changes in cellular adhesion by measuring nuclear cell morphology in the prostate tissue10. We also have used this model to evaluate primary tumor proliferation and apoptosis status using Ki67 and TUNEL staining of the prostate tumor14.
In addition to the wide variety of data outputs that can be obtained, this model can be used to determine the effects of both changes in protein expression as well as small molecule therapeutics. Compared to many spontaneous and induced models of human PCa metastasis, there is a higher turnaround time of only 4-6 weeks. Other models with a high turnaround time, such as tail vein or intercardiac injection models, have limitations of no primary tumor, thus not fully recapitulating the clinic metastatic cascade. In our model, tumor cells must escape the primary site of origin, enter and survive the circulatory system, and implant into a secondary site. This provides additional steps at which a therapeutic intervention or change in protein expression could deliver an effect. Additionally, the presence of the primary tumor should allow for easy application of this model to new imaging technologies such as luciferase-based IVIS16-17.
Despite the wide variety of benefits of this model, there are also several limitations to consider. An increasing number of studies show the importance of the immune system in the tumor microenvironment and the development of metastasis18. In this model, due to the usage of an athymic rodent, the ability to assess the effects of the immune system is not possible. A second limitation is the lack of androgen responsiveness in PC3-M cells. Upon initial diagnosis of PCa, patients frequently will undergo androgen therapy as a first line treatment. However, patients will eventually become androgen-resistant and tumors will begin to grow again. As PC3-M cells lack the androgen receptor, this model only measures the effects of drug treatment or protein modulation on post-androgen resistant cancer. Though this is a limitation, androgen-responsive PCa is currently well manageable and has a variety of effective treatment options, and thus androgen-resistant cancer has become more prominently studied. This model also specifically uses an inbred strain of mice, which minimizes mouse to mouse variability. However, this strain may be particularly responsive to particular proteins or small molecules, thus care should be taken when extrapolating this data to the clinic.
Though this model provides an effective measurement of drug efficacy in a rapid turnaround time of 4-6 weeks, this may not take into consideration long-term drug dosing effects. After prolonged exposure to many currently available treatments, patients may return with drug-resistant cancers many years post-treatment. The rapid turnaround of this technique does not allow for effective modeling of the ability of a tumor to become resistant to a treatment. However, with modulation of this experiment, treatment-resistant human prostate cancer cells can be implanted, and the effectiveness of a second-generation therapeutic in preventing PCa tumor growth and metastasis can be modeled. Additionally, if a group was attempting to study the molecular changes in a primary tumor over time, a longer-term model such as the TRAMP model will likely be more effective for those studies.
Another limitation of this model is the dissemination of distinct metastasis only to the lymph nodes and lungs of the animals. Both of these sites are frequent and clinically relevant sites of metastasis, as demonstrated by human warm autopsy studies 19. However, clinically bone metastasis constitutes a prominent feature of human PCa, and thus models recapitulating this are of interest. Unfortunately, these are difficult to recapitulate in a mouse model, with very few models showing bone metastasis without tail vein, intercardial injection, or direct implantation into the bone20. Thus if targeting to the bone is of key experimental importance, another model may be more effective. However, this model does provide some measure of traffic to the bone in the form of bone marrow circulating tumor cells.
Despite these limitations, this technique is a powerful model of human PCa. The ability to measure effects on both the primary tumor as well as metastatic formation in a short turnaround time provides a wide variety of applications. In this model, cells must escape the primary organ, enter and survive in the bloodstream, and implant in a secondary site, recapitulating the process in humans. The additional measurement of molecular characteristics of the primary tumor, changes in cell morphology, and presence of circulating tumor cells provides a wide breath of information from one model. This procedure can be used both in the context of drug discovery as well as to study changes in tumor biology.
Disclosures
The authors declare that they have no competing financial interests.
Acknowledgements
This work was supported by grants from the National Institutes of Health (NIH) to R.C.B., CA122985 and Prostate SPORE CA90386, and to J.M.P, NIH T32 AG000260 "Drug Discovery Training in Age-Related Disorders", and by the Walter S. And Lucienne Driskill Graduate Program in Life Sciences at Northwestern University. We would also like to thank the Mouse Phenotyping and Histology Laboratory and Pathology Core Facility at Northwestern University.
Materials
| Name | Company | Catalog Number | Comments |
|---|---|---|---|
| Equipment | |||
| 1 ml Syringe, Tuberculin, Slip-Tip | Becton Dickinson | 309659 | |
| 23 G 3/4 Precison Glide Needle | Becton Dickinson | 305143 | |
| 30 G 1/2 Precision Glide Needle | Becton Dickinson | 305106 | |
| Alcohol Wipes | Triad | 10-3001 | |
| Autoclip Applier, 9mm, Stainless Steel | Becton Dickinson | 427630 | |
| Clips, 9mm | VWR | 15431-673 | |
| Convertors Polyline Towel (Sterile) | Cardinal Health | 3520 | |
| Cotton-Tipped Applicators, 6 inch, Sterile, Wooden Shaft | Fisher | 23-400-125 | |
| Curad Sterile Cotton Balls | VWR | 500043-544 | |
| Derf Needle Holder, Integra Miltex, 121 mm (4 3/4") | VWR | 95039-192 | |
| Duraprene SMT Sterile Neoprene Powder-Free Surgical Gloves | Cardinal Health | 2D72PN70 | |
| Germinator 500 | Cell Point Scientific | SN 7030 | |
| Kendall Monojet Needles, 1/2 cc syringe with permanent 28 G 1/2 needle | Tyco | 1180528012 | |
| Medium Heating Pad | VWR | 100229-094 | |
| Merit Iris Scissors, Sklar, 11.4 cm (4 1/2") | VWR | 94000-000 | |
| Metric/English Vernier Caliper | VWR | 19155-057 | |
| PDS*11 Violet Monofilament Sutcher 4-0, 27" | Ethicon | Z304H | |
| VetEquip Inhalation Anesthesia System | Contact Your Animal Facility for Availability | ||
| VWR Premium Tissue Cassettes | VWR | 18000-010 | |
| VWR Specimen Forceps, Serrated, Straight, 114 mm (4 1/2") | VWR | 82027-440 | |
| Reagents | |||
| Betadine Surgical Scrub | Fisher Healthcare | 19-027132 | |
| Buprenex | Controlled Substance - Obtain from Animal Facility | ||
| Dako DAB + Chromagen | Dako | K3468 | |
| Dako Envision + System HRP-Labeled Polymer, Anti-Rabbit | Dako | K4003 | |
| Dako Envision Kit Protein Block | Dako | X0909 | |
| Formalin | VWR | 95042-908 | |
| GFP Antibody | Invitrogen | A11122 | |
| Hematoxylin | Mayer | MH580-2.5L | |
| Meloxican | Obtain from Animal Facility | ||
| Nembutal | Controlled Substance - Obtain from Animal Facility | ||
| Rneasy RNA Isolation Kit | Qiagen | 74104 | |
| Sterile Saline | Obtain from Animal Facility | ||
| Taqman Reverse Transcription Reagents | Life Technologies | N8080234 | |
| TaqMan Universal PCR Master Mix | Life Technologies | 4304437 | |
| Trizol | Invitrogen | 10296 |
References
- Jemal, A., et al. Global cancer statistics. CA Cancer J Clin. 61, 69-90 (2011).
- Shappell, S. B., et al. Prostate pathology of genetically engineered mice: definitions and classification. The consensus report from the Bar Harbor meeting of the Mouse Models of Human Cancer Consortium Prostate Pathology Committee. Cancer Res. 64, 2270-2305 (2004).
- Rangarajan, A., Weinberg, R. A. Opinion: Comparative biology of mouse versus human cells: modelling human cancer in mice. Nat. Rev. Cancer. 3, 952-959 (2003).
- Pollard, M. Lobund-Wistar rat model of prostate cancer in man. Prostate. 37, 1-4 (1998).
- Gingrich, J. R., et al. Androgen-independent prostate cancer progression in the TRAMP model. Cancer Res. 57, 4687-4691 (1997).
- Gingrich, J. R., et al. Metastatic prostate cancer in a transgenic mouse. Cancer Res. 56, 4096-4102 (1996).
- Yang, M., et al. A fluorescent orthotopic bone metastasis model of human prostate cancer. Cancer Res. 59, 781-786 (1999).
- Wu, T. T., et al. Establishing human prostate cancer cell xenografts in bone: induction of osteoblastic reaction by prostate-specific antigen-producing tumors in athymic and SCID/bg mice using LNCaP and lineage-derived metastatic sublines. Int. J. Cancer. 77, 887-894 (1998).
- Dolman, C. S., et al. Suppression of human prostate carcinoma metastases in severe combined immunodeficient mice by interleukin 2 immunocytokine therapy. Clin. Cancer Res. 4, 2551-2557 (1998).
- Lakshman, M., et al. Dietary genistein inhibits metastasis of human prostate cancer in mice. Cancer Res. 68, 2024-2032 (2008).
- Messina, M. J., Persky, V., Setchell, K. D., Barnes, S. Soy intake and cancer risk: a review of the in vitro and in vivo data. Nutr. Cancer. 21, 113-131 (1080).
- Adlercreutz, H., Markkanen, H., Watanabe, S. Plasma concentrations of phyto-oestrogens in Japanese men. Lancet. 342, 1209-1210 (1993).
- Xu, L., et al. MEK4 function, genistein treatment, and invasion of human prostate cancer cells. J. Natl. Cancer Inst. 101, 1141-1155 (2009).
- Lakshman, M., et al. Endoglin suppresses human prostate cancer metastasis. Clin. Exp. Metastasis. 28, 39-53 (2011).
- Craft, C. S., Romero, D., Vary, C. P., Bergan, R. C. Endoglin inhibits prostate cancer motility via activation of the ALK2-Smad1 pathway. Oncogene. 26, 7240-7250 (2007).
- Lim, E., Modi, K. D., Kim, J. In vivo bioluminescent imaging of mammary tumors using IVIS spectrum. J. Vis. Exp. , e1210(2009).
- Cordero, A. B., Kwon, Y., Hua, X., Godwin, A. K. In vivo imaging and therapeutic treatments in an orthotopic mouse model of ovarian cancer. J. Vis. Exp. , e2125(2010).
- Buijs, J. T., vander Pluijm, G. Osteotropic cancers: from primary tumor to bone. Cancer Lett. 273, 177-193 (2009).
- Rubin, M. A., et al. Rapid ("warm") autopsy study for procurement of metastatic prostate cancer. Clin. Cancer Res. 6, 1038-1045 (2000).
- Singh, A. S., Figg, W. D. In vivo models of prostate cancer metastasis to bone. J. Urol. 174, 820-826 (2005).
Reprints and Permissions
