We demonstrate a microfluidics-based assay to measure the timescale for cells to transit through a sequence of micron-scale constrictions.
Here we detail the design, fabrication, and use of a microfluidic device to evaluate the deformability of a large number of individual cells in an efficient manner. Typically, data for ~102 cells can be acquired within a 1 hr experiment. An automated image analysis program enables efficient post-experiment analysis of image data, enabling processing to be complete within a few hours. Our device geometry is unique in that cells must deform through a series of micron-scale constrictions, thereby enabling the initial deformation and time-dependent relaxation of individual cells to be assayed. The applicability of this method to human promyelocytic leukemia (HL-60) cells is demonstrated. Driving cells to deform through micron-scale constrictions using pressure-driven flow, we observe that human promyelocytic (HL-60) cells momentarily occlude the first constriction for a median time of 9.3 msec before passaging more quickly through the subsequent constrictions with a median transit time of 4.0 msec per constriction. By contrast, all-trans retinoic acid-treated (neutrophil-type) HL-60 cells occlude the first constriction for only 4.3 msec before passaging through the subsequent constrictions with a median transit time of 3.3 msec. This method can provide insight into the viscoelastic nature of cells, and ultimately reveal the molecular origins of this behavior.
Changes in cell shape are critical in numerous biological contexts. For example, erythrocytes and leukocytes deform through capillaries that are smaller than their own diameter1. In metastasis, cancer cells must deform through narrow interstitial gaps as well as tortuous vasculature and lymphatic networks to seed at secondary sites2. To probe the physical behavior of individual cells, microfluidic devices present an ideal platform that can be customized to study a range of cell behaviors including their ability to migrate through narrow gaps3 and to passively deform through micron-scale constrictions3-9. Polydimethylsiloxane (PDMS) microfluidic devices are optically transparent, enabling cell deformations to be visualized using light microscopy and analyzed using basic image processing tools. Moreover, arrays of constrictions can be precisely defined, enabling analysis of multiple cells simultaneously with a throughput that exceeds many existing techniques10,11.
Here we present a detailed experimental protocol for probing cell deformability using the ‘Cell Deformer’ PDMS microfluidic device. The device is designed so that cells passage through sequential constrictions; this geometry is common in physiological contexts, such as the pulmonary capillary bed12. To gauge cell deformability, transit time provides a convenient metric that is easily measured as the time required for an individual cell to transit through a single constriction4,6. To maintain a constant pressure drop across the constricted channels during cell transit, we use pressure-driven flow. Our protocol includes detailed instructions on device design and fabrication, device operation by pressure-driven flow, preparation and imaging of cells, as well as image processing to measure the time for cells to deform through a series of constrictions. We include both device designs and vision data processing code as supplemental files. As a representative sample of data, we show cell transit time through a series of constrictions as a function of the number of constrictions passaged. Analysis of the timescale for cells to transit though narrow constrictions of a microfluidic device can reveal differences in the deformability of a variety of cell types4,5,13. The device demonstrated here uniquely surveys cell transit through a series of micron-scale constrictions; this design emulates the tortuous path that cells experience in circulation and also enables probing additional physical characteristics of the cells such as relaxation time.
1. Microfluidic Device Design
NOTE: The device design has four basic functional regions: entry port, cell filter, constriction array, and exit port (Figure 1). The overall design can be applied to a wide array of cell types, with minor adjustments to dimensions. Provided here are a few basic design recommendations along with device parameters that are effective for a selection of both primary and immortalized cells.
2. Supplies and Preparation
NOTE: Before commencing any experiment, the following items must be prepared. A schematic of the entire setup is given in Figure 1.
3. Microfluidic Device Fabrication
4. Deforming Cells through Constricted Channels
5. Data Analysis
To investigate the deformability of different cell types, human myeloid leukemia cells (HL-60), differentiated neutrophil cells, mouse lymphocyte cells, and human ovarian cancer cell lines (OVCAR8, HEYA8) are evaluated using the ‘Cell Deformer’ microfluidic technique. Representative results for the transit time of HL-60 and neutrophil-type HL-60 cells show the timescale for a single cell to transit through a series of constrictions, as shown in Figure 6. Transit time is measured for a population of individual cells at each 7 µm constriction in a series of 7 constrictions at a driving pressure of 28 kPa (Figure 6).
As shown in Figure 6, HL-60 cells temporarily occlude the first constriction for a median time of 9.3 msec before passaging through the subsequent constrictions. By contrast, neutrophil-type HL-60 cells occlude the first constriction for only 4.3 msec before passaging. The shorter transit time of the HL-60 cells is consistent with their reduced elastic and viscous moduli, as determined by atomic force microscopy21 and micropipette aspiration22. These results are also consistent with the reduced levels of the mechanoregulating protein, lamin A, which determine transit times of cells through micron-scale gaps23. Once through the first constriction, cells transit more quickly through the remaining constrictions, from 2 to 7, with a median transit time of 4.0 msec for the HL-60 cells and 3.3 msec for the neutrophil-type cells (Figure 6). While the HL-60 cells still exhibit slightly longer but significant transit times (C2-C7, p = 1.7E-9), the distribution of transit times for constrictions 2-7 are nearly identical for each cell type. The observation of the longer transit time required for the first constriction may reflect that the viscoelastic cells do not fully relax to their initial shape on these ~msec timescales. This behavior may also be explained by irreversible structural changes that develop within the cell, and facilitate their transit through the subsequent micron-scale gaps. Importantly, by comparing transit time among cell populations, even for the first constriction, can reveal differences in their deformability23.
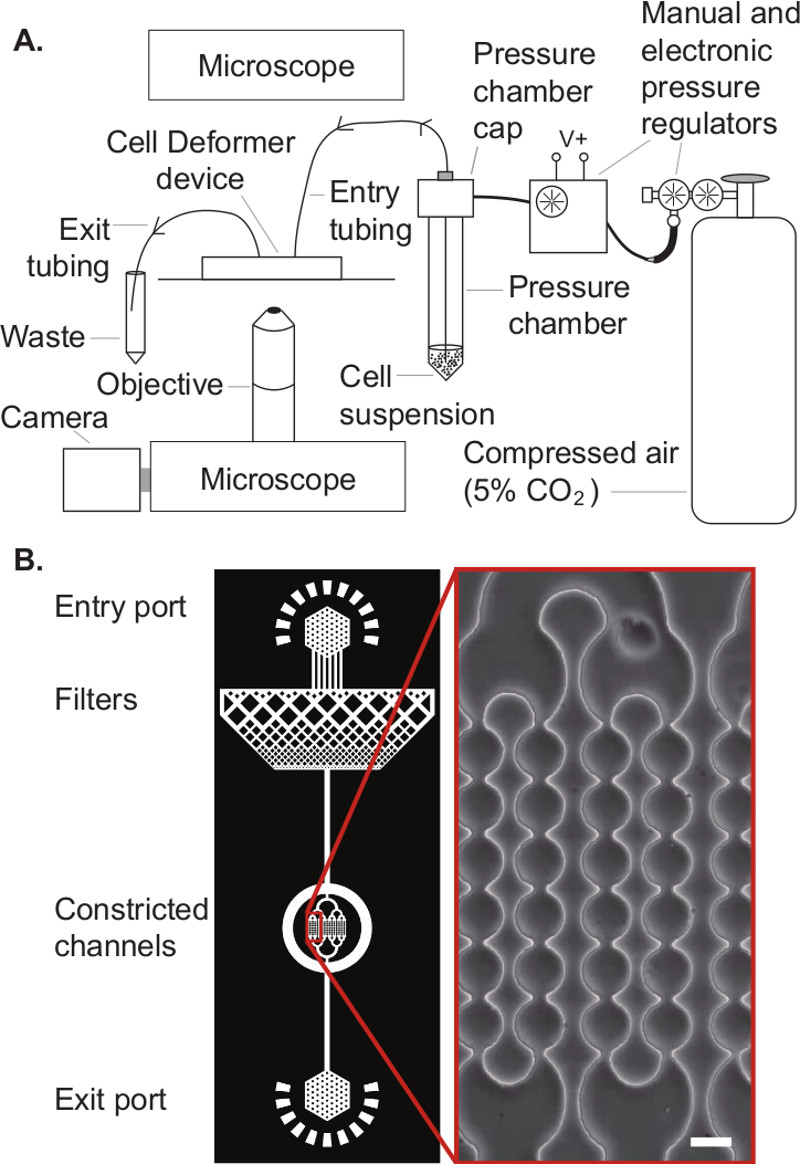
Figure 1. Schematic illustration of the experimental setup. A. ‘Cell Deformer’ device in the experimental setup showing the peripheral connections. B. The device design has 4 functional regions: entry port, cell filter, constriction array, and exit port. Architecture of the microfluidic device showing its main features; inset shows a transmitted light image of the constricted channels. Scale, 10 µm.
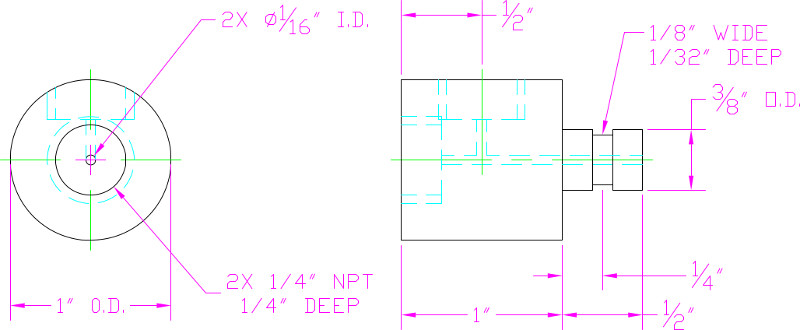
Figure 2. Engineering drawings for a custom cap to pressurize cell media contained in a flow cytometer tube.
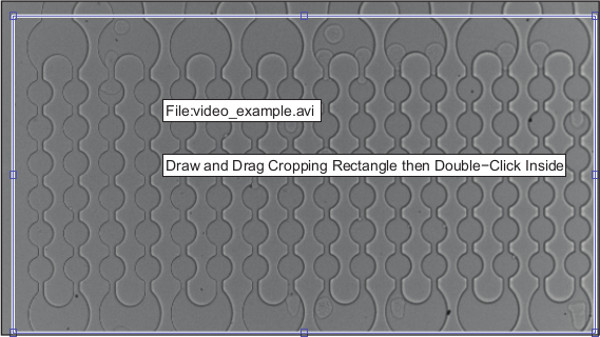
Figure 3. Demonstration of how to select the region of interest for video frame cropping.
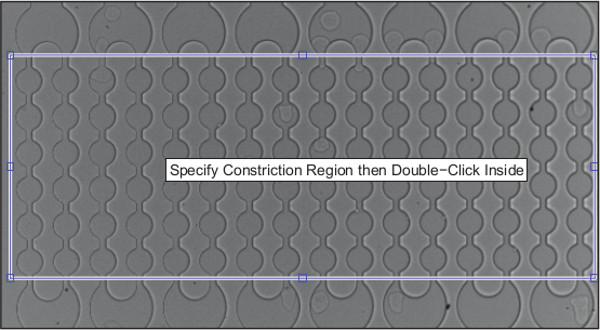
Figure 4. Demonstration of how to select constriction locations.
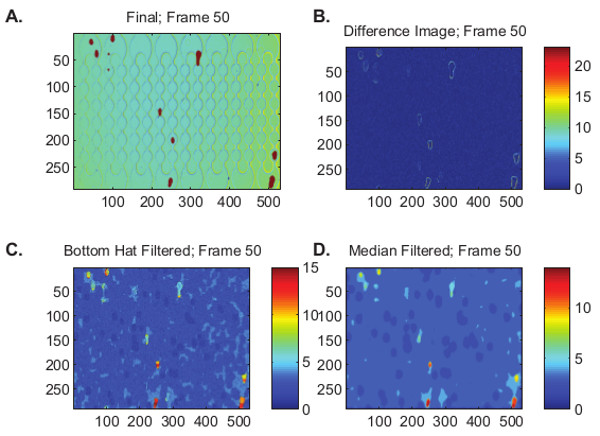
Figure 5. Observation window used to verify that the algorithm properly identifies cell locations as they process through the constriction array. A. Binarized image is superimposed on the source video to show the location of the cells. B. Difference image; C. Bottom hat filtered image; D. Median filtered.
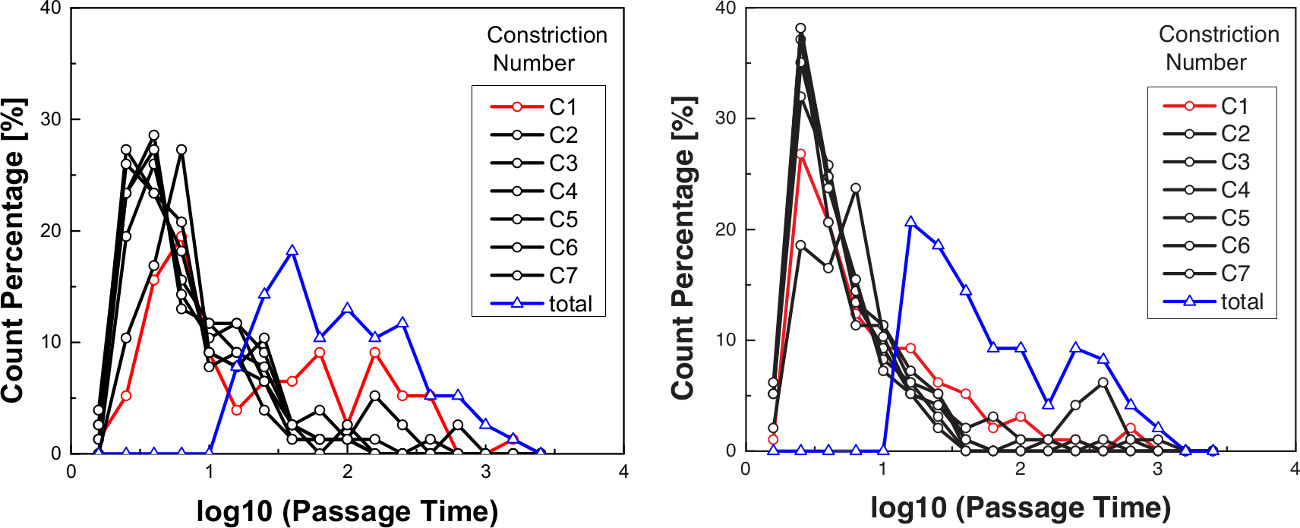
Figure 6. Representative transit time measurements as a function of constriction number. A. HL-60 cells exhibit a longer transit time through the first constriction than B. ATRA-treated HL-60 (neutrophil-type) cells. A comparison of the transformed passage time (log10) through the first constriction as evaluated using the nonparametric Mann-Whitney test reveals the difference is significant, p = 1.47E-5. Cells typically transit through the first constriction more slowly than the subsequent constrictions. Data is shown here for cells transiting through 7 μm-wide constrictions at a driving pressure of 28 kPa. Cell density, mean cell diameter, and surfactant concentration are given in Table 1. HL-60, N = 77; ATRA-treated HL-60, N = 97. Results were replicated in independent experiments over the course of 3 different days.
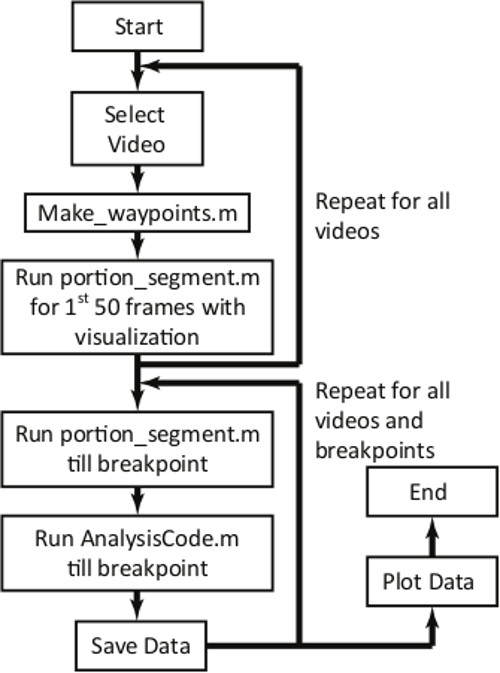
Figure 7. Overview of the MATLAB script for measuring the transit time. The first loop requires user intervention and observation for the first 50 frames for each video. After the first loop, the entire program will run without user intervention and automatically compiles and plots population data.
Cell Type | Channel Height (µm) | Channel constriction (µm) | Mean Cell Diameter (µm) | Cell Concentration (cells/ml) | Surfactant Concentration (vol%) |
HL-60 | 10.2 | 5, 7, 9 | 14 | ~1 x 10⁶ | F127: 0.1 |
Neutrophil-type HL-60 | 10.2 | 5, 7, 9 | 14 | ~1 x 10⁶ | F127: 0.1 |
OVCAR8 | 10.2 | 7, 9 | 16 | ~5 x 10⁶ | F127: 0.1 |
HEYA8 | 10.2 | 7, 9 | 17 | ~5 x 10⁶ | F127: 0.1 |
Mouse lymphocyte | 5.5 | 3, 5 | 8 | ~3 x 10⁶ | F127: 0.33 |
Table 1. Previously studied cell systems and their operating conditions.
Here we provide a comprehensive experimental procedure for analyzing the deformation of cells transiting through constricted microfluidic channels using pressure-driven flow. A MATLAB script enables automated data processing (Supplemental Material); an updated version of the code is maintained (www.ibp.ucla.edu/research/rowat). More broadly, the techniques presented here can be adapted in many cell-based microfluidic assays, including the effect of cytoskeletal and nuclear stiffening agents24,23 as well as assaying the deformability of cancer cell types4,5. Taken together with higher resolution microscopy to image subcellular deformations, this method provides a powerful approach to study cell mechanical properties and alterations that occur in physiological and pathological conditions.
Automatic Cell Processing Algorithm
The acquired movies can be analyzed with little user intervention using a MATLAB script. The algorithm is outlined in Figure 7, and the set of MATLAB functions is provided in the Supplementary Information. In brief, the user is instructed to select all the videos to analyze; crop each video for the region of interest; and specify a frame rate for the set of videos; thereafter, the software automatically processes video data to determine the transit time of each cell for each constriction. There are certain requirements for the script to operate: cells should flow from the top of the frame to the bottom of the frame in the video; the microfluidic device position and the lighting conditions should not change appreciably over the duration of the video; and videos should be in .avi format. Importantly, the tracking algorithm includes cells that both enter and passage in the time window of a single video recording, which is approximately 8 sec. Therefore, any objects that have a longer transit time are excluded from the analysis. By performing background subtraction, objects that are present throughout the entire video are removed from the analysis. The code also implements a lower size cutoff, which may be set by the user. The size cutoff for the video analysis was 5 pixels, equivalent to a cell diameter of 2.7 µm.
Since the high-speed video data files can be sizable (~500 MB), the program is computationally intensive. Code is most efficiently run using a desktop computer with at least 6 GB of RAM and a 64-bit chipset with either a local hard drive with at least a 1 TB capacity or interfaced with a large external hard drive or data server with a USB 3.0, FireWire, or Ethernet connection. Data is output in a histogram format for rapid visualization of results; it is also tabulated as data that is stored in a MATLAB (.mat) data file and in an Excel spreadsheet.
The code that is presented provides a simple way to compare cell populations by analysis of the transit time for cells to passage through each constriction. For more detailed analysis, the code could be extended to investigate other parameters including cell size, aspect ratio, as well as relaxation timescale. Previous studies reveal only a weak dependence of cell size on transit time6.
Device-related Pitfalls
Occluded channels are a major hindrance in any flow experiment. Cell adhesion to the device walls will impair the flow of cells through the constricted channels: cells may be observed to smear out along the channel walls. To prevent adhesion, proper surface treatment with F-127 is essential.
The surface properties of PDMS change with time after plasma treatment, which renders the PDMS temporarily hydrophilic25,26. Over the course of one week, hydrophilic PDMS surfaces slowly degenerate to their natural hydrophobic surface energy; this can challenge the removal of air bubbles through the channels. Devices should thus be used within seven days of plasma treatment. Most importantly, the time between plasma treatment and the deformability assay should be consistent across all experiments.
While we have successfully distinguished transit times between distinct cell types using devices fabricated with a glass floor and three PDMS walls, devices can also be fabricated so they have uniform surface properties on all four channel walls27. The PDMS device can be bonded to a glass substrate spincoated with a thin PDMS layer: mix curing agent to base at a ratio of 1:5 (w/w), pour onto the device mold, and cure for 20 min at 65 °C. Meanwhile, spincoat a thin layer of 1:20 (w/w) curing agent to base onto the glass substrate; bake at 85 °C for 4 min. Place the PDMS device on the PDMS-coated slide, and finish baking overnight to complete bonding. This method is also valuable if a plasma machine for glass-PDMS bonding is not available.
Cell-related pitfalls.
hen preparing the cell suspension, the density of cells is critical: if the cell density is too low, cell transit events will be infrequent; if the cell density is too high, there will be multiple cells passaging a single channel simultaneously, the pressure drop across a single cell will not be consistent, and it will be difficult to delineate individual cells with an automated script.
While experiments are typically performed within 30 min of cell suspensions being prepared, cells can settle to the bottom of the pressure chamber over longer times of >30 min. To avoid settling over longer time periods, the pressure chamber and connecting tubing can be periodically rotated. For longer experiments, a small magnetic stir bar can be added to the cell suspension, with a stir plate positioned beneath the pressure chamber to agitate the cells and prevent settling.
The authors have nothing to disclose.
The authors would like to acknowledge Lloyd Ung for constructive input in early versions of this technique, Dr. Jeremy Agresti for pressure cap design tips, and Dr. Dongping Qi for his help in fabricating the pressure cap. We are grateful to the laboratories of M. Teitell and P. Gunaratne for providing a variety of cell samples for testing. We are grateful to the National Science Foundation (CAREER Award DBI-1254185), the UCLA Jonsson Comprehensive Cancer Center, and the UCLA Clinical and Translational Science Institute for supporting this work.
Name of Material/ Equipment | Company | Catalog Number | Comments/Description |
Pluronic F-127 Block Copolymer Surfactant | Fisher Scientific | 8409400 | Produced by BASF, also available through Sigma |
PDMS base and crosslinker | Essex Brownell | DC-184-1.1 | Product commonly named Sylgard 184 Elastomer |
Oxygen plasma discharge unit | Enercon | Dyne-A-Mite 3D Treater | |
Biopsy Punch, Harris Uni-Core (0.75 mm) | Ted Pella, Inc. | 15072 | |
Fingertight Ferrule, 1/32" | Upchurch Scientific | UP-F-113 | |
Fingertight III Fitting, 10-32 | Upchurch Scientific | UP-F-300X | |
polyetheretherketone (PEEK) tubing, outer diameter = 1/32"or 0.79 mm | Valco | TPK.515-25M | |
polyethylene (PE-20) tubing, 0.043" or 1.09 mm | Becton Dickinson | 427406 | |
Pressure regulator | Airgas or Praxair | ||
Polyurethane tubing, 5/32” OD | McMaster Carr | 5648K284 | |
Push-to-connect fittings | McMaster Carr | 5111K91 | |
Voltage to Pressure (E/P) Electropneumatic Converter | Omega | IP413-020 | |
16-bit,250 kS/S, 80 Analog Inputs Multifunction DAQ | National Instruments | NI PCI 6225-779295-01 | |
Analog Connector Block-Screw Terminal | National Instruments | SCB-68-776844-01 | |
LabView System Design Software | National Instruments | ||
Matlab Software | The MathWorks, Inc. | Matlab R2012a | Code requires the Image Processing Toolbox |
Shielded Cable | National Instruments | SHC68-68 |