With this study, we introduce a standardized stress model for the isolated superfused bovine retina for future preclinical therapeutic testing. The effect of either hypoxia (pure N2) or glutamate stress (250 µM glutamate) on retinal function represented by a- and b-wave amplitudes was evaluated.
Neuroprotection has been a strong field of investigation in ophthalmological research in the past decades and affects diseases such as glaucoma, retinal vascular occlusion, retinal detachment, and diabetic retinopathy. It was the object of this study to introduce a standardized stress model for future preclinical therapeutic testing.
Bovine retinas were prepared and perfused with an oxygen saturated standard solution, and the ERG was recorded. After recording stable b-waves, hypoxia (pure N2) or glutamate stress (250 µm glutamate) was exerted for 45 min. To investigate the effects on photoreceptor function alone, 1 mM aspartate was added to obtain a-waves. ERG-recovery was monitored for 75 min.
For hypoxia, a decrease in a-wave amplitude of 87.0% was noted (p <0.01) after an exposition time of 45 min (decrease of 36.5% after the end of the washout p = 0.03). Additionally, an initial decrease in b-wave amplitudes of 87.23% was recorded, that reached statistical significance (p <0.01, decrease of 25.5% at the end of the washout, p = 0.03).
For 250 µm glutamate, an initial 7.8% reduction of a-wave amplitudes (p >0.05) followed by a reduction of 1.9% (p >0.05). A reduction of 83.7% of b-wave amplitudes (p <0.01) was noted; after a washout of 75 min the reduction was 2.3% (p = 0.62). In this study, a standardized stress model is presented that may be useful to identify possible neuroprotective effects in the future.
Neuroprotection has been a strong field of investigation in ophthalmological research in the past decades. The retina is a highly sensitive neuronal network that depends significantly on oxygenation and is influenced strongly by the metabolism of its surrounding cells. Major ocular pathologies related to nerve cell damage are retinal vascular occlusions, glaucoma, and retinal detachment.
Retinal artery occlusion, as an example for retinal vascular occlusion, leads to a sudden loss of vision due to hypoxia of the inner retina1. It is often associated with general vascular pathologies2 and leads to a persistent visual loss1, with only 8% of patients recovering visual acuity significantly1. Although arterial fibrinolysis has been suggested as a treatment option, the benefit could not be shown in a randomized clinical trial3.
Glaucoma and retinal detachment both have an increase in glutamate concentration4-6. Glutamate under physiologic conditions is encountered as an excitatory transmitter throughout the whole central nervous system and the inner retina7,8. Elevated glutamate levels have been found not only in glaucoma and retinal detachment5,6 but also in proliferative diabetic retinopathy9. An increase in glutamate possibly leads to excitotoxicity and, therefore, nerve cell damage10. In most cases of retinal detachment and in some cases of proliferative diabetic retinopathy surgery on the retina (pars plana vitrectomy) are necessary. During pars plana vitrectomy mechanical manipulation, bright light of the optic fiber or shear stress exerted by high flow rates of irrigation solutions during long operations exert an additional stress on the retina11,12.
All the mentioned diseases have in common that the pathology is localized to the retina alone and pose the ophthalmologic community with the challenge to find ways to protect the retina as a neurosensory system.
The electroretinogram (ERG) is the standard method for the evaluation of in vivo photoreceptor function (a-wave) and the function of the inner retina (b-wave). The ERG is measured by silver-electrodes introduced into the cornea and the eyes are being stimulated by an increasing level of light to detect defects in rods or cones or in the inner retina. Different defects in the retina can be detected by changes in the amplitude (the strength of the response) or the latency (the time-to-response-interval) of the ERG. Different ERG protocol and measurement methods (pattern-ERG, multifocal-ERG or bright field ERG) allow further differentiation of defects. The technique of the isolated retina has been introduced recently, making it possible to evaluate effects on the retina without interferences from e.g. a study animal’s general reactions13,14.
It was the purpose of this study to evaluate and introduce a defined and standardized stress model for hypoxia and glutamate stress on the superfused isolated retina. Thus, we are hoping to lay the foundations for future studies on neuroprotective effects of certain agents or intraocular irrigation solutions.
1. Preparation of Bovine Eyes
2. Recording the Electroretinogram (ERG)
3. Data Analysis
After 1 hr of perfusion of the retinal preparations with oxygen-saturated standard solution (Figure 1A and B) ERG-amplitudes showed stabilization and less variation of amplitudes between single measurements. pH, osmotic pressure, temperature, and pO2 (except for hypoxia testing) were kept constant for all tests.
To isolate the photoreceptor signal from the signal of the inner retina, 1 mM aspartate was added to the standard solution to suppress the b-wave (Figure 1A). During testing of the effect of hypoxia, a decrease in a-wave amplitude of 87.0% was noted (p <0.01) after an exposition time of 45 minutes. At the end of the washout, a decrease of 36.5% was noted that was statistically significant (p = 0.03, Figure 2A). Additionally, an initial decrease in b-wave amplitudes of 87.23% was recorded, that equally reached statistical significance (p <0.01). In this setting a reduction of 25.5% was noted, that was statistically significant (p = 0.03, Figure 2B).
After exposition with 250 µm glutamate, a 7.8% non-significant reduction of a-wave amplitudes was detected after (p >0.05) the defined time interval. This was followed by a non-significant reduction of 1.9% (p >0.05, Figure 3A). Single measurements are shown in Table 1 and 2.
Concerning the b-wave, decreased amplitudes of the ERG by 83.7% were recorded that were statistically significant (p <0.01, Figure 3B). At the end of the washout, a b-wave recovery was noted resulting in a non-significant reduction of 2.3% after 75 minutes of perfusion with standard solution (p = 0.62).
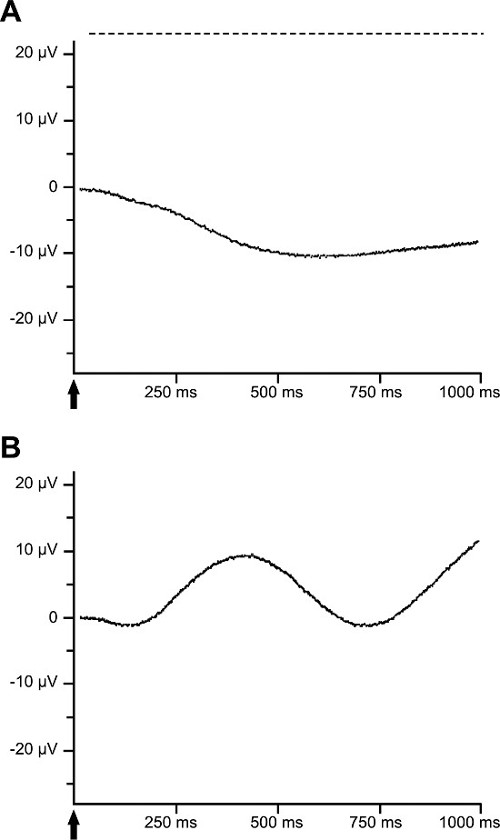
Figure 1: Example of an ERG measurement from the isolated perfused bovine retina. (A) The a-wave is shown in the ERG of the isolated perfused bovine retina. The b-wave is suppressed by adding 1 mM aspartate to the nutrient solution. (B) The b-wave is dominant under scotopic light conditions. A 10 ms light stimulus at a light intensity of 6.3 mlx is used.
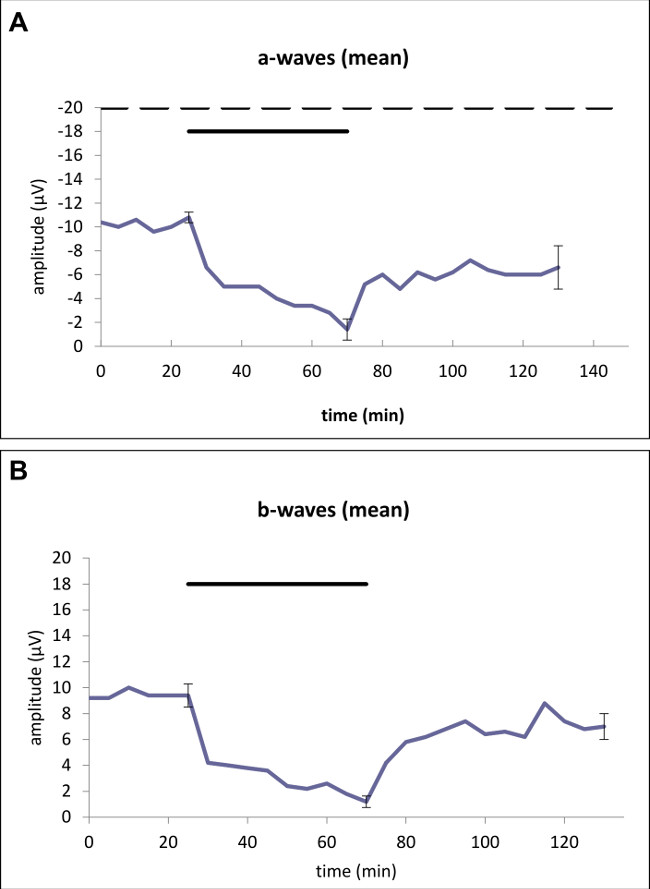
Figure 2: Effects of hypoxia after an exposure time of 45 min on the (A) a-wave and on the (B) b-wave amplitude of the ERG. Average of representative drug series (n = 5). The horizontal bar above the curve marks the hypoxia time. The dotted line (A) marks the application of aspartate 1 mM to unmask photoreceptor potential. Standard deviations for each series of experiments are given directly before and after application as well as at the end of the trial. Statistical analysis was performed at the time-points using the standard deviation (directly before and after application as well as at the end of the trial): (A) A decrease in a-wave amplitude of 87.0% was noted after an exposition time of 45 minutes compared to the beginning of the trial. At the end of the trial, a significant decrease of 36.5% was noted. (B) A significant decrease in b-wave amplitudes of 87.23% was recorded at the end of the exposition time. At the end of the trial, a significant reduction of 25.5% was noted.
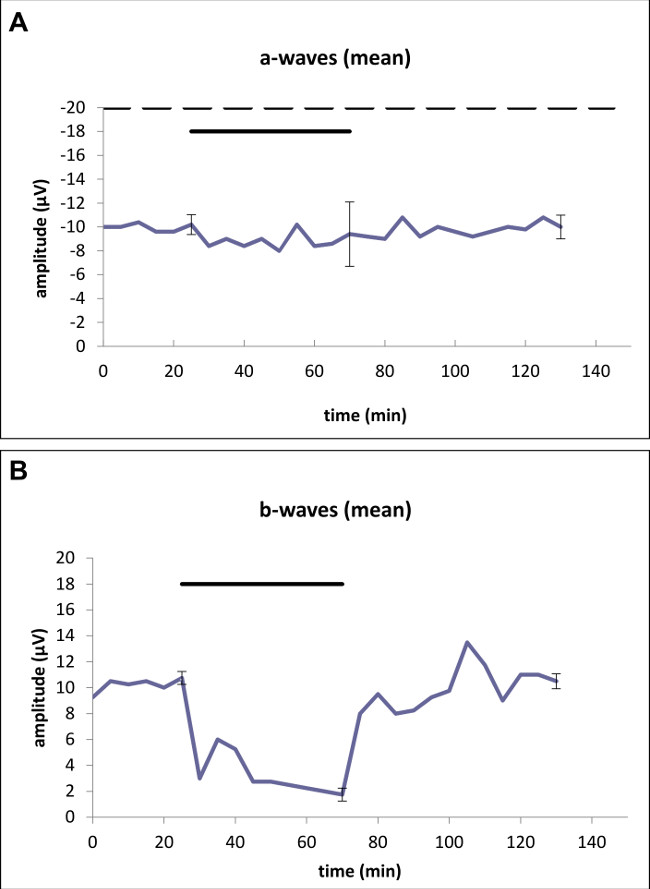
Figure 3: Effects of 250 µM glutamate applied for 45 min on the (A) a-wave amplitude and the (B) b-wave amplitude of the ERG of the isolated perfused bovine retina. Average of representative drug series (n = 5). The horizontal bar above the curve marks the application of glutamate. The dotted line (A) marks the application of aspartate 1 mM to unmask photoreceptor potential. Standard deviations for each series of experiments are given directly before and after application as well as at the end of the trial. Statistical analysis was performed at the time-points with the standard deviation (directly before and after application as well as at the end of the trial): (A) After the exposure time of 250 µm glutamate a non-significant reduction of a-wave amplitudes (7.8%) was detected. At the end of the trial, a non-significant reduction of 1.9% was found. (B) Concerning the b-wave, significantly decreased amplitudes of the ERG by 83.7% were recorded. At the end of the trial, a non-significant reduction of 2.3% was noted.
Time [min] | b-wave amplitude [µV] | SD | a-wave amplitude [µV] | SD |
0 | 9.2 | 0.836660027 | -10.4 | 1.140175425 |
5 | 9.2 | 1.095445115 | -10 | 1 |
10 | 10 | 0 | -10.6 | 0.547722558 |
15 | 9.4 | 1.140175425 | -9.6 | 0.547722558 |
20 | 9.4 | 0.547722558 | -10 | 1 |
25 | 9.4 | 0.894427191 | -10.8 | 0.447213595 |
30 | 4.2 | 2.774887385 | -6.6 | 2.50998008 |
35 | 4 | 2.449489743 | -5 | 2.236067977 |
40 | 3.8 | 1.788854382 | -5 | 1 |
45 | 3.6 | 1.341640786 | -5 | 2.121320344 |
50 | 2.4 | 1.140175425 | -4 | 1.870828693 |
55 | 2.2 | 0.836660027 | -3.4 | 1.140175425 |
60 | 2.6 | 0.547722558 | -3.4 | 1.816590212 |
65 | 1.8 | 0.836660027 | -2.8 | 1.303840481 |
70 | 1.2 | 0.447213595 | -1.4 | 0.894427191 |
75 | 4.2 | 0.836660027 | -5.2 | 2.683281573 |
80 | 5.8 | 1.303840481 | -6 | 2.828427125 |
85 | 6.2 | 1.095445115 | -4.8 | 0.836660027 |
90 | 6.8 | 1.095445115 | -6.2 | 2.387467277 |
95 | 7.4 | 1.816590212 | -5.6 | 2.302172887 |
100 | 6.4 | 0.547722558 | -6.2 | 2.863564213 |
105 | 6.6 | 0.894427191 | -7.2 | 2.049390153 |
110 | 6.2 | 1.643167673 | -6.4 | 2.966479395 |
115 | 8.8 | 3.898717738 | -6 | 3.16227766 |
120 | 7.4 | 1.516575089 | -6 | 2.34520788 |
125 | 6.8 | 1.095445115 | -6 | 2.645751311 |
130 | 7 | 1 | -6.6 | 1.816590212 |
Table 1: Kolmogorov-Smirnov results.
Time [min] | b-wave amplitude [µV] | SD | a-wave amplitude [µV] | SD |
0 | 9.25 | 0.5 | -10 | 1 |
5 | 10.5 | 0.577350269 | -10 | 1 |
10 | 10.25 | 0.5 | -10.4 | 0.894427191 |
15 | 10.5 | 0.577350269 | -9.6 | 0.894427191 |
20 | 10 | 0.816496581 | -9.6 | 0.547722558 |
25 | 10.75 | 0.5 | -10.2 | 0.836660027 |
30 | 3 | 1.825741858 | -8.4 | 2.701851217 |
35 | 6 | 3.559026084 | -9 | 1 |
40 | 5.25 | 2.62995564 | -8.4 | 2.966479395 |
45 | 2.75 | 2.061552813 | -9 | 1.414213562 |
50 | 2.75 | 0.957427108 | -8 | 0.707106781 |
55 | 2.5 | 1 | -10.2 | 1.095445115 |
60 | 2.25 | 0.957427108 | -8.4 | 1.816590212 |
65 | 2 | 1.414213562 | -8.6 | 1.140175425 |
70 | 1.75 | 0.5 | -9.4 | 2.701851217 |
75 | 8 | 3.464101615 | -9.2 | 2.28035085 |
80 | 9.5 | 3.696845502 | -9 | 1 |
85 | 8 | 2.160246899 | -10.8 | 2.48997992 |
90 | 8.25 | 0.957427108 | -9.2 | 2.167948339 |
95 | 9.25 | 2.872281323 | -10 | 1.870828693 |
100 | 9.75 | 0.957427108 | -9.6 | 1.140175425 |
105 | 13.5 | 3.872983346 | -9.2 | 1.643167673 |
110 | 11.75 | 2.5 | -9.6 | 1.140175425 |
115 | 9 | 1.825741858 | -10 | 1.870828693 |
120 | 11 | 3.366501646 | -9.8 | 1.303840481 |
125 | 11 | 2.708012802 | -10.8 | 0.447213595 |
130 | 10.5 | 0.577350269 | -10 | 1 |
Table 2: Representative measurements for hypoxia for b-wave amplitudes and a-wave amplitudes.
Glutamate a-wave data | Glutamate b-wave data | Hypoxia a-wave data | Hypoxia b-wave data | |
D | 0.103827009 | 0.17415038 | 0.195 | 0.125 |
p-value | 0.928603977 | 0.375501627 | 0.250 | 0.781 |
alpha | 0.05 | 0.05 | 0.05 | 0.05 |
Table 3: Representative measurements for 250 µM glutamate for b-wave amplitudes and a-wave amplitudes.
In this study, a significant impact on the b-wave amplitude after 45 min of hypoxia was found. This reduction was still significant after the washout phase. A similar effect on the photoreceptor potential could be observed.
The results are supported by other published data16 and give us the opportunity to study possible neuroprotective effects after hypoxia.
After 45 min exposition of 250 µM glutamate, we did find a statistically significant impact only on the b-wave amplitude that was fully reversible at the end of the washout period. The photoreceptor potential was not influenced by 250 µM glutamate. The fact that only the inner retina was affected by hypoxia indicates that the changes are very subtle and that we, therefore, have a very sensitive and standardized indicator for possible neuroprotection. Aspartate specifically inhibits transmission from the photoreceptor to the horizontal or bipolar cells and thus suppresses the b-wave.
This finding is contrary to the findings of Green D.G. and Kapousta-Bruneau N.V., who found that with concentrations of 250 and 500 mM glutamate their b-waves recording were more stable over time compared to media alone17. To explain this contradiction several differences in the settings need to be taken into consideration: Sickel-solution was used in this model the other publication used Ringer-solution.
Measurements were performed with an array the other publication with a single electrode. Bovine eyes from the slaughterhouse were used while the other publication described fresh rat eyes. The effect was reversible with a temporal inhibition at high glutamate concentrations. It is commonly known that a certain very low amount of glutamate is necessary for good maintenance of the eye and that higher amounts are toxic. We could assume that in the bovine eyes from the slaughterhouse more glutamate is being released compared to freshly prepared eyes resulting in glutamate levels being different than expected from the experimentally added glutamate.
Measuring the response using an array over the whole retina rather than an electrode, which is mainly influenced by the closest cells, might also lead to a longer survival time due to lower mechanical damage. Finally, the composition of the media is crucial. In the 1960s, Prof. Sickel heavily invested in developing this specialized media for these measurements and he was able to find an optimized media without needing glutamate for a stable retinal response13,14.
The described model relies on an isolated retina rather than a whole animal. In an in vivo system, the eye is isolated by the blood-retina-barrier from other organs of the animal. The advantage of this model is that interfering parameters in study animals, such as anesthesia or position of electrodes do not occur, which allows a higher degree of standardization. Standardization is a critical point in animal experiments, especially concerning the eye18.
The limitations of this method are the short testing period and the fact, that it is not an animal model. We know from experience that ERG amplitudes remain stable for about 8 hr, therefore the testing period mentioned in the introduction can be extended to a longer exposition and follow-up period, but one should always consider that the longer a single experiment is extended, the more likely higher standard deviations will occur.
A disadvantage of the model is, therefore, that no long-term studies can be performed and only a limited amount of manipulations to the retina are possible. For extensive manipulation and special ERGs like multi-focal ERG guided by SLO as described in Dutescu et al. for example, in vivo experiments are necessary19.
This model can easily be used for human explanted retinas e.g. from enucleated eyes. Since this sensitive material is complicated to obtain, experiments on bovine retinas are more feasible but should be interpreted keeping this in mind.
The critical steps in the protocol are transporting and preparing the retina under dark adapted conditions. This is important to obtain the maximal possible responses. It can sometimes take a few min to gently separate the retina from the underlying pigment epithelium. Gentle shaking of the punched out retina sometimes facilitates this process. While placing the retina on the net, it is important to place the retina with the outer retina on the net. After trephanization, the edges of the retina will bend slightly upwards indicating the position of the inner retinal layer.
The bovine retina is more similar to the human retina compared to the retina of the rodent eye because of a similar vitreous-lens ratio and a vascular structure that resembles the one of the human eye20; thus, although small laboratory animals such as rats or mice are widely used for testing retinal biocompatibility, toxicity studies performed on such animals are often less applicable to humans20. Phylogenetic analysis of the myocilin gene – a gene that in its mutated form causes autosomal dominant juvenile open-angle glaucoma – shows that the bovine gene is more closely related to the human gene than that of the rat or mouse21. Myocilin can be found in trabecular meshwork cells, as well as in the retina. At last we showed a good correlation between bovine and human isolated ERGs and ERG effects12.
In our model aspartate was employed to unmask the photoreceptor potential P III by abolishing the b-wave. This gives the investigator the opportunity to differentiate between effects on the inner retinal network and the photoreceptor function22. While the b-wave is a much more sensitive parameter with regard to the integrated function, the a-wave amplitude is more stable and more resistant to stress, due to the fact that the a-wave only reflects the reaction of the photoreceptors to light it. In contrast, the b-wave depends on cell-to-cell interaction of different retinal cells and the activity of the photoreceptors. By using aspartate to isolate the a-wave it is possible to examine the effect of manipulations on the photoreceptors alone23.
In this study a standardized neuronal toxicity model that can be used to test neuroprotective agents was evaluated. As an outlook it will be interesting to correlate electrophysiological function with protein-biochemical analysis or to correlate function with cellular metabolism or even mRNA expression.
The authors have nothing to disclose.
This paper is dedicated to my beloved wife Maren and our little Karl.
Name of Material/ Equipment | Company | Catalog Number | Comments/Description |
120 mM NaCl | Merck Pharma, Germany | 1,064,041,000 | |
2 mM KCl, | Merck Pharma, Germany | 1,050,010,250 | |
0.1 mM MgCl2, | Merck Pharma, Germany | 58,330,250 | |
0.15 mM CaCl2 | Merck Pharma, Germany | 111 TA106282 | |
1.5 mM NaH2PO4/13.5 mM Na2HPO4 | Merck Pharma, Germany | 1,065,860,500 | |
5 mM glucose | Merck Pharma, Germany | 40,741,000 |