This manuscript describes how to conduct (single molecule) Förster Resonance Energy Transfer (FRET)- based assays to measure the binding dynamics between T-cell antigen receptor (TCR) and antigenic peptide-loaded MHC molecules as they occur within the immunological synapse of a T-cell in contact with a functionalized planar supported lipid bilayer.
Method Article
Measuring TCR-pMHC Binding In Situ using a FRET-based Microscopy Assay
Opens in a new tab
In This Article
Summary
Loading...
$$\rightleftharpoonup{xx}$$
$$\longleftharp{xx}$$,
$$\longrightharp{xx}$$,
Abstract
Loading...
$$\rightleftharpoonup{xx}$$
$$\longleftharp{xx}$$,
$$\longrightharp{xx}$$,
T-cells are remarkably specific and effective when recognizing antigens in the form of peptides embedded in MHC molecules (pMHC) on the surface of Antigen Presenting Cells (APCs). This is despite T-cell antigen receptors (TCRs) exerting usually a moderate affinity (µM range) to antigen when binding is measured in vitro1. In view of the molecular and cellular parameters contributing to T-cell antigen sensitivity, a microscopy-based methodology has been developed as a means to monitor TCR-pMHC binding in situ, as it occurs within the synapse of a live T-cell and an artificial and functionalized glass-supported planar lipid bilayer (SLB), which mimics the cell membrane of an Antigen presenting Cell (APC) 2. Measurements are based on Förster Resonance Energy Transfer (FRET) between a blue- and red-shifted fluorescent dye attached to the TCR and the pMHC. Because the efficiency of FRET is inversely proportional to the sixth power of the inter-dye distance, one can employ FRET signals to visualize synaptic TCR-pMHC binding. The sensitive of the microscopy approach supports detection of single molecule FRET events. This allows to determine the affinity and off-rate of synaptic TCR-pMHC interactions and in turn to interpolate the on-rate of binding. Analogous assays could be applied to measure other receptor-ligand interactions in their native environment.
Introduction
Loading...
$$\rightleftharpoonup{xx}$$
$$\longleftharp{xx}$$,
$$\longrightharp{xx}$$,
A more fundamental understanding of how T-cells recognize antigens requires looking at the right place, that is, within the immunological synapse formed between the T-cell and the APC. Here, molecular binding kinetics are not only determined by the inherent biochemical properties of the interaction partners involved but depend to a large extent on cellular parameters, which include cellular forces, membrane architecture and lateral interactions between membrane proteins as well as synapse-specific geometrical constraints 3. Biochemical approaches are limited in resolving power as they necessitate the disruption of at least one of the synaptic membranes involved. For this reason a FRET-based imaging methodology was developed to monitor binding of the TCR to antigenic pMHCs 2. Here T-cells are decorated with a recombinant and site-specifically labeled TCRβ-reactive single chain antibody fragment (scFV) and confronted with planar glass-supported lipid bilayers (SLBs), which harbor MHC class II molecules loaded with a fluorescently labeled antigenic peptide, costimulatory molecules and adhesion proteins. Synaptic binding between dye-labeled TCR and dye-labeled pMHC results in FRET, which can be monitored on a bulk and single molecule level by Total Internal Reflection Fluorescence (TIRF) microscopy.
In this article it is explained in detail how to utilize SLBs for assaying T-cell synapses, verify their integrity through a functional T-cell calcium-flux assay, conduct FRET measurements in bulk and with single molecule sensitivity, and analyze the acquired data. Recommendations are offered to producing properly conformed proteins required for bilayer functionalization. For more specific information regarding bilayer formation and setup of a suitable TIRF microscope please refer to an additional public access JoVE publication published back to back 4.
Nature of SLBs
Functionalizable SLBs can be readily generated from unilamellar vesicles (SUVs) containing the two lipids 1-palmitoyl-2-oleoyl-sn-gylcero-3-phosphocholine (short: POPC, 90-99%) and 1,2-dioleoyl-sn-glycero-3-{[N(5-amino-1-carboxypentyl) iminodiacetic acid] succinyl} (short: DGS NTA-Ni, 1-10%). SUVs spread on clean glass slides to form a contiguous planar bilayer 4. DGS-NTA-Ni serves to anchor polyhistidine-tagged proteins via polyhistidine-mediated complex-formation with the synthetic NTA-Ni-containing head group (Figure 1A). For stable association one typically replaces the native transmembrane domain and cytoplasmic tail of the adhesion protein ICAM-1 and the costimulatory molecule B7-1 with one tag containing twelve histidines (ICAM-1-12H, B7-1 -12H) (Figure 1B). The peptide-loaded class II molecule I-Ek contains two membrane-embedded (α and β) polypeptide chains. The transmembrane/cytoplasmic domains of both chains have to be replaced with a tag containing six histidines each (I-Ekα6H β6H or I-Ek-2x6H). As an alternative, extending the α-chain with twelve histidines and leaving the extracellular domain of the β-chain untagged (giving rise to I-Ekα12H β0H or I-Ek-12H) gives rise to satisfactory results (Figure 1B).
Site-specific labeling of pMHCs
It is important to label the pMHC stoichiometrically and site-specifically in order to be able to convert measured FRET yields into meaningful equilibrium binding constants. This can be achieved by chemical labeling of a synthetic peptide that is loaded into the peptide-binding cleft of recombinant histidine-tagged MHC class II molecules 2,5. The peptide includes all residues of the T-cell epitope as well as a short C-terminal linker (GGS) followed by cysteine (e.g. in the moth cytochrome c (MCC) peptide ANERADLIAYLKQATK-GGSC, the linker is marked in bold). This cysteine is used to label the peptide stoichiometrically with the use of maleimide-dye derivatives. At this point extra care should be devoted to verifying quantitative dye-coupling to the cysteine-containing peptide. HPLC-purification of the peptide-dye adduct is recommended and has to be followed by electrospray ionization mass spectroscopy. Any recorded masses corresponding to the peptide educt (without dye) reflect incomplete labeling. If this is true, the HPLC-purified peptide should be subjected to consecutive rounds of dye-labeling until labeling is deemed quantitative. Note that MALDI-TOF mass spectroscopy should be avoided as this method involves laser radiation for sample ionization. This treatment disintegrates the attached sensitive fluorophores before peptide mass is read out and thus underrepresents degrees of dye-conjugation.
Indirect yet site-specific labeling of cell-bound TCRs with the use of monovalent single chain FV fragments
It is still challenging to attach dyes to cell surface-associated proteins of living cells in a site-specific manner. To overcome this hurdle for surface-exposed TCRs, a monovalent single chain version (scFV) from the genes of the TCRβ -reactive monoclonal antibody H57-197 2has been constructed. The crystal structure of this antibody in complex with the TCR allows to rationally design a version, in which a serine residue in close proximity to the C-terminus of the MHC associated peptide (where the corresponding FRET partner dye is attached) is substituted for a cysteine residue. This mutant cysteine then serves as an acceptor for dye conjugation (Figure 2).
Methodologies to record FRET
Bulk FRET values are best suited to verify the relationship between chosen inter-dye distances and FRET efficiencies measured in this TCR-pMHC binding system 2. In addition, bulk FRET measurements reveal qualitative and quantitative differences in synaptic TCR-pMHC affinities (see below and protocol section 3.2). Various approaches for quantifying FRET efficiencies have been introduced in the literature 6. In this article FRET is recorded via
(a) donor recovery after acceptor bleaching, and via
(b) sensitized FRET acceptor emission.
The first method (a) requires the use of a FRET acceptor that can be easily photobleached, and a donor, which is rather photostable. In addition it is important to ensure that the photobleached acceptor is no longer capable of quenching the donor fluorescence. As the same detection channel (donor) is used for quantification, no correction factors and no chromatic aberrations have to be considered, which renders this methodology simple and reliable. However, quantitative measurements cannot be repeated on the same specimen spot and changes in FRET cannot be recorded over time. To avoid effects caused by molecular diffusion or cellular motility a fast bleaching step should be aimed for, which minimizes the time passing between the first FRET donor (before acceptor bleaching) and the second FRET donor image acquisition (after FRET acceptor bleaching). It is recommend to employ a powerful laser light source of the FRET acceptor excitation wavelength in order to minimize illumination and bleaching times.
In contrast, in the approach of sensitized FRET emission measurement (b) the FRET donor is excited and the emission of the FRET acceptor is observed in the FRET acceptor channel. Changes in FRET acceptor signal can be recorded over time but emission of the FRET donor into the red-shifted acceptor channel (termed bleedthrough) and FRET acceptor cross-excitation via donor excitation have to be accurately determined and subtracted from the recorded FRET acceptor channel. For this the corresponding FRET donor and FRET acceptor images have to be spatially aligned.
Detection of single molecule (sm) FRET events
With the use of lasers as excitation source, a sensitive camera and noise-attenuated TIRF microscopy the fluorescence of single fluorophores can be easily traced over time. Similar is true for the detection of intermolecular smFRET events. However, complications may be caused by FRET donor bleedthrough and cross-excitation of the FRET acceptor, and thus great care has to be taken when adjusting the fluorophore densities in the smFRET experiment.
In the protocol provided below (protocol section 4) the TCR was chosen as FRET donor in high abundance and pMHC as FRET acceptor in low abundance. To attenuate FRET donor bleedthrough sufficiently, decorate 10-30% of the TCRs with fluorescent scFV and 90-70% of the TCRs with non-fluorescent scFV. Here the FRET acceptor channel was chosen as single molecule channel because it is confocal with the single molecule FRET channel. This helps to align smFRET events with single molecule FRET acceptors, which is the basis of smFRET validation.
Extracting synaptic off-rates through smFRET measurements
Photobleaching of both FRET donor and FRET acceptor have to be accounted for when extracting the half-life of interactions from single molecule FRET traces. The number of observable FRET-signals at the beginning of their appearance as single donor-acceptor pair N(0) is reduced over time by both unbinding of the receptor-ligand complex and photobleaching. The number of surviving complexes at a given time N(t) can be mathematically expressed as follows:
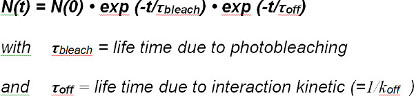
In the photobleaching term exp(-t/τbleach) the time t is described by the product of the number of observations n and the illumination time till because of the non-continuous, discrete observation mode (i.e., bleaching only occurs during illumination). Within the kinetic term exp-(t/τoff) the time t is the product of the number of observations n and the time tlag for a single FRET observation (i.e., kinetic unbinding happens continuously). Equation 1 can be expressed as:

The term τbleach/τill describes the number of observations until bleaching occurs and is defined as the expectation value bleach> of its exponential function. Equation 2 can be simplified as follows:
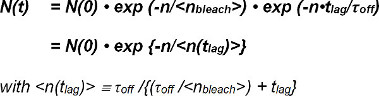
The expectation value lag)> of the number of frames N(t) with observable FRET-events after time t is directly determined from the experiment. It depends on the settable time between observations (tlag) chosen in the experiment and the unknown values for τoff (the inverse of the off-rate koff ) and bleach>, the expectation value of number of observations before bleaching occurs.
Thus, calculation of the expectation value lag)> for at least two values of tlag allows the experimental determination of bleach> and τoff .
Extracting synaptic 2D-KD values through FRET-based measurements
Measuring TCR occupancy a, i.e., the ratio between bound TCRs and total TCRs, is central to determining synaptic 2D-KD values. According to equation 4 this term is directly proportional to the measured FRET yield as long as TCRs serves as FRET donors and pMHCs as FRET acceptors.

with a = TCR occupancy, C =conversion factor
C is a constant, which depends on the FRET system and the fluorophores used. It can be determined experimentally as shown below. a can be converted into a 2D-KD according to equation 5 when the initial density of TCR ligands prior to addition of T-cells to the bilayer is known. This is because of the high mobility of SLB-attached proteins and also because SLBs provide an almost inexhaustible reservoir of ligands 2.

with [pMHC initial] = initial density of pMHC prior to the addition of T-cells
With equations 4 and 5 one can now easily determine the synaptic 2D-KD between TCR and pMHC. This is most reliably done with FRET measurements based on donor recovery after acceptor bleaching (see protocol section 3.1).
However, to measure C the relationship between the FRET intensity IFRET (corrected for background, FRET donor bleedthrough and FRET acceptor cross-excitation) and TCR occupancy a has to be determined. For this, one needs to know the ratio R between the average fluorescence intensity of single TCR-associated FRET donor fluorophores (e.g. Cy3 or AF555) sm IFRET donor and the average intensity of single molecule FRET events sm IFRET. R depends on the FRET system in question, emission filters and camera used for fluorescence detection.
The TCR occupancy a can then be directly determined according to equation 6.
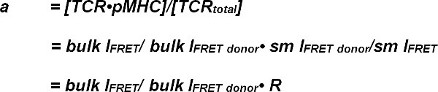
with R = sm IFRET donor / sm IFRET
R was determined as 1.45 for the H57 scFv- Cy3/pMHC-Cy5 system leads to:
a= bulk IFRET/ bulk ITCR-cy3 • 1.45
The relationship between the TCR occupancy a and the FRET yield can be determined by FRET donor recovery after acceptor bleaching. For this both parameters are plotted against one another for a number TCR microclusters as shown in Figure 4A.The slope of the linear fit indicates the conversion factor C (from equation 4).
As demonstrated in Figure 4A, C amounts for (a) the H57 scFV- Cy3/pMHC-Cy5 FRET system and (b) the applied microscope system configuration to 1.995. The TCR occupancy a can be readily deduced as follows:
TCR occupancy a = FRET yield • 1.995
Protocol
Loading...
$$\rightleftharpoonup{xx}$$
$$\longleftharp{xx}$$,
$$\longrightharp{xx}$$,
1. Protein Production
1.1. Bilayer-resident proteins: B7-1, ICAM-1, pMHC (e.g., I-Ek/peptide)
- B7-1 -12H, ICAM-1-12H
- Express B7-1-12H and ICAM-1-12H constructs in high quantities as secreted native proteins using a baculovirus expression system.
- Purify proteins from culture supernatants via Ni-NTA affinity chromatography, followed by MonoQ anion exchange chromatography and S200 size exclusion chromatography.
- Label one aliquot of the purified protein with amine-reactive dyes such as NHS succinimidyl-ester preparations of Alexa Fluor 488 (or FITC), Alexa Fluor 555 (or Cy3), Alexa Fluor 647(or Cy5).
- After S200 size exclusion chromatography determine the labeling degree of monomeric proteins according to the dye-manufacturer’s specifications by comparing the protein absorption at 280 nm and the dye absorption at 488 nm (Alexa Fluor 488, FITC), 555 or 552 nm (Alexa Fluor 555 or Cy3) or 647 nm (Alexa Fluor 647 or Cy5).
Note: This ratio will later be needed to determine the protein density on the SLB from the bulk fluorescence signal of the dye-labeled protein. - Store the unlabeled and fluorophore-labeled proteins at -20°C in PBS plus 50% glycerol.
- pMHC (here: I-Ek -2x6H or I-Ek-12H)
- Refold MHC class II from inclusion bodies expressed in E.coli in the presence of a much cheaper UV-cleavable peptide substitute, which can later be quantitatively exchanged with a fluorophore-conjugated peptide of choice 5,7.
- Purify refolded pMHC complexes by standard techniques (Ni-NTA-affinity chromatography, MonoQ anion-exchange chromatography, S200 gel filtration).
- Exchange the UV cleavable peptide with fluorescent peptide 5,7.
- Purify monomeric fluorescent pMHC complexes finally by S200 gel filtration. A representative chromatogram is shown in Figure 3.
- Verify quantitative peptide loading by spectrophotometry.
- Store proteins at -20°C in PBS/50% glycerol.
1.2. Generation of single chain antibody fragments (scFVs), introduction of cysteines for site-specific labeling
- Refold scFVs from inclusion bodies expressed in E.coli. Here a protocol devised by Tsumoto and colleagues 8 is followed in which inclusion bodies are first unfolded in 6 M guanidinium chloride, fully reduced and then refolded in the course of a week by gradually decreasing the concentration of the protein-unfolding guanidinium chloride.
- Concentrate properly folded scFV using molecular filter units with a molecular cutoff of 10 KDa.
- Purify the concentrate by S200 gel filtration.
- Label monomeric scFV in the presence of 0.05 mM tris(2-carboxyethyl)phosphine (TCEP) with Alexa Fluor 647 immediately after purification. Perform the labeling reaction best at a molar ratio of protein:dye of no more than 1:2 at RT for no longer than 2 hr.
Note: TCEP is a phosphorous- based reduction agent and does not react with maleimides at these concentrations 9. It can hence be present during the labeling reaction to keep the unpaired sulfhydryl group reduced until it reacts with the dye-maleimide derivative. - Purify labeled monomeric scFV finally via S75 gel filtration. A representative chromatogram is shown in Figure 3.
- Determine the dye:protein ratio spectrophotometrically.
- Store proteins at -20°C in PBS/50% glycerol.
2. Calcium Flux Measurements
- Take a fresh vial containing 50 µg fura-2-AM and dissolve it in 50 µl water-free DMSO.
- Spin down 106 T-cells in a 5 ml polypropylene round-bottom tube for 2 min at 250-400 g.
- Resuspend T-cells in 200 µl imaging medium containing Hank's Balanced Salt Solution plus calcium/magnesium and 1% ovalbumin at RT, add 1 µl of the fura-2-AM stock solution (1:200 dilution), mix the cell suspension and incubate at RT for 30 min.
- Wash the T-cells once in imaging buffer. For this, fill the tube containing the cells with imaging buffer at RT and pellet the cells as described in step 2. Remove the supernatant and resuspend the cell pellet in 200 µl imaging buffer (i.e., at a final cell density of 5 x 10⁶ cells ml-1). Cells can be used immediately for calcium measurements or stored on ice for up to 3 hr.
- Place cells on a functionalized SLB in imaging buffer (37° C). As soon as T-cells start contacting the SLB, acquire the following set of images every 15 to 30 sec for 30 min:
excitation at 340 +/- 5 nm, emission detection at 510 +/- 40 nm
excitation at 380 +/- 5 nm, emission detection at 510 +/- 40 nm
DIC (optional)
Note: Respective exposure times depend on the intensity of the excitation light source. Satisfactory results are obtained when the pixel intensities of 340 nm (380 nm) channel amount to about one fourth (one half) of the maximally possible intensity value. Keep in mind that fura-2 values excited at 340 nm will increase and those excited at 380 nm will decrease upon T-cell activation. - 20-25 min into the run, add 50-100 µl of the pre-warmed anti-pMHC blocking antibody at a final concentration of 20-50 µg ml-1. The antibody saturates all pMHCs and as a consequence T-cells will cease to recognize antigen and stop fluxing calcium. Continue recording images for another 5 - 10 min to acquire the baseline of the intracellular calcium concentration, which corresponds to the non-activated state of the T-cells.
- Determine the average background fluorescence signal at 340 nm and 380 nm excitation within a region of interest of at least 1,000 pixels, which contains no cell. Background-subtract all measured fura-2 images excited at 340 nm and 380 nm and calculate 340 nm/380 nm intensity ratios of individual cells or a group of cells. Normalize intensity ratios by dividing all ratios through the ratio of the five last time frames (i.e., with complete antibody-blockade of the pMHC).
- Plot normalized fura-2 ratios against time. Note: When cells and bilayers are in good condition, fura-2 340 nm/380 nm intensity ratios adopt typically values between 2 and 5, 15-45 sec after cells have made contact with the bilayer. Ratios then drop to a value between 1.6 and 2 where they stay constant for at least 20 min or longer. Values should drop to 1 only after the addition of anti-pMHC antibodies. A typical example is shown in Figure 5.
3. Bulk FRET Measurements
3.1. TCR decoration with the H57scFV
- Spin down 106 T-cells in a 5 ml polypropylene round-bottom tube for 2 min at 250-400 g.
- Decant the media, flick the cell pellet gently and add 0.3 µl of scFV (concentration ~ 1 mg/ml) to the cell suspension. For bulk FRET measurements employ only dye-labeled scFv. For single molecule FRET measurements use a mix of unlabeled scFv (5 to 9 parts, contains no unpaired cysteine) and dye-labeled scFv (1 part, contains one unpaired dye-coupled cysteine).
- Incubate the cells on ice for 15 min and wash the cells twice through successive centrifugation using ice-cold imaging buffer.
Note: Cells can be stored on ice without significant loss of bound scFV (t1/2 of scFV dissociation at 0°C ~ 4 hr 2). The purity of primary T-cells derived from TCR-transgenic (and optionally also Rag-1/2 deficient mice) and stimulated in vitro is higher than 98% since T-cells are the only cells proliferating (up to 7 cell divisions) in response to the peptide, which has been added for stimulation to the T-cell culture. B-cells undergo apoptosis and are no longer alive after 7-10 days of cultivation. A few dendritic cells survive yet can be easily discriminated against not only because of their distinct morphology but also because they do not bind the H57 anti-TCR beta scFV fragment.
3.2. FRET measurement via donor recovery after acceptor bleaching
Note: Keep in mind that the half-life of TCR-H57 scFV complexes amounts to 4 hr on ice, to 50 min at 22.5°C and to 6.8 min at 37°C (and to about 4 hr on ice) 2. As long as the H57 scFV serves as FRET donor, measured FRET yields are not sensitive to H57 scFV dissociation, however, the signal to noise ratio increases with increased H57 dissociation.
- Prepare an SLB containing AF647/Cy5-labeled pMHCs as well as unlabeled ICAM-1 and B7 according to Axmann et al. 4.
- Exchange the PBS of the imaging chamber with imaging medium containing Hank's Balanced Salt Solution plus calcium/magnesium and 1% ovalbumin. For this pipet 400 µl of imaging buffer into the well, mix carefully and remove 400 µl from the well. Repeat this procedure 3-4 times. Do not expose the SLB to air at any time.
- Place the imaging chamber onto the microscope stage and adjust the focus until the fluorescent (AF647, Cy5) SLB comes into clear view.
- Set up TIRF illumination by translating the focused beam parallel to the optical axis to the periphery of the objective’s focal plane via moving of the periscope’s translational stage.
- To fine-tune the excitation laser beams in TIRF mode, add T-cells decorated with AF555/Cy3 labeled scFV and let them settle onto the SLB. Note: Conditions for TIRF illumination are met when the basal cellular membrane is in focus in addition to the SLB and no other parts of the cell come into view when focusing upwards. However, if TIRF is not properly adjusted, parts of the fluorescent T-cell plasma membrane, which are not in contact with the SLB, will appear as a ring. If this is the case, adjust the laser beam with the periscope’s translational stage until TIRF illumination is achieved.
- Acquire the following six images in the indicated order and in rapid succession (Figure 6):
(i1, optional) white light, to take an image of the cell,
(i2, optional) 647 nm excitation (low power) to take an image of the FRET acceptor (pMHC) prior to the bleach pulse,
(i3) 514 nm excitation (low power) to take an image of the FRET donor (TCR) prior to the bleach pulse,
(i4) 647 nm excitation (high power) to photo-bleach the FRET acceptor,
(i5) 514 nm excitation (low power) to take an image of the FRET donor (TCR) following the bleach pulse,
(i6) 647 nm excitation (low power) to verify complete FRET acceptor bleaching. - Keep the time passed between images (i3) and (i5) as short as possible in order to be able to correlate the images for later analysis. Keep FRET donor bleaching at a minimum by employing the excitation at the lowest possible power level, which still allows for proper imaging of the T-cells.
- Pick a region of interest (ROI), e.g., an entire synapse or an individual TCR microcluster, determine its average intensity in (i3) (= I(3)) and in (i5) (= I(5)). For background subtraction, pick a ROI of the same dimension outside the illumination spot in (3) or (5) and determine its average intensity (I(background)). To determine the FRET yield perform the following operation:
 (equation 7)
Note: It should be noted that in relation to the absolute FRET level, it can be necessary to correct for donor bleaching between images (i5) and (i3).
3.3. FRET measurement via sensitized emission
- Perform spatial donor and acceptor channel alignment with the use of multicolored beads, which fluoresce in all emission channels. The spatial shift between both channels due to chromatic aberration can be determined by super-positioning individual beads and has to be applied for correction of one of the two channels for all following 2-color image-pairs 10.
- Determine the degree of donor bleedthrough with the use of an SLB containing the FRET donor fluorophore alone. It is also feasible to use FRET-donor-labeled T-cells on a lipid bilayer with unlabeled pMHC. Background is first determined outside the illuminated field of view and then subtracted from both channels. This way the average background-corrected intensities of two corresponding ROIs (I donor channel and I acceptor channel) are determined. Calculate the bleedthrough coefficient (BTC) as follows:
 (equation 8)
Note: This BTC is a constant for a certain dye and filter set-combination. - Calculate the FRET donor bleedthrough image as follows:
 (equation 9)
 - Determine acceptor cross-excitation by exciting an SLB containing the FRET acceptor fluorophore alone (e.g., I-Ek/MCC-Alexa Fluor 647) first with FRET donor excitation light (e.g., 514 nm) and then with acceptor excitation light (e.g., 647 nm). Use background-subtracted images within the FRET acceptor channel to calculate the cross-excitation coefficient (CEC) as follows:
 (equation 10)
 - As the CEC depends on the laser intensity used for donor excitation, determine it on each measurement day. Use the resulting CEC to calculate the image solely generated through cross-excitation.
 (equation 11)
 - Calculate the FRET image corrected for bleedthrough and cross-excitation as follows:
 (equation 12)
Note: Absolute FRET signal (but not the relative FRET yield) is sensitive to the dissociation of the H57 scFV from T-cell membrane bound TCR. To avoid excessive loss of the TCR-FRET probe, aim to perform measurements at 37°C within the first 2 min after the addition of the T-cells to the bilayer. Measurements with quantitative (≥ 95%) TCR labeling are only possible at or below 22.5°C within the first 3 min after addition of T-cells to the bilayer.
4. Single Molecule FRET Measurements
- Adjust the power of both lasers to give rise to an intensity of 1-5 kW/µm2 at the specimen. For more information please refer to Axmann et al. 4.
- Label T-cells as outlined above with a mix of unlabeled scFV (5-9 parts) and Cy3/AF555-labeled scFV (1 part). Note: This way only a fraction of TCRs is marked with the FRET-donor. This reduces the number of detectable interactions, but noise generated from donor bleedthrough is also decreased significantly (by about the 51/2 to 101/2), which is critical when resolving individual single molecule FRET events.
Note: The dissociation of the H57 scFV probe from the TCR does not affect the measurements, as it occurs in a much larger time range (minutes to hours) than the dissociation of the TCR from SLB-bound pMHC (sub-second to second range). - Place an SLB featuring AF647-labeled pMHCs as well as ICAM and B7 on the microscope stage and adjust the focus so that the bilayer comes into clear view.
- Optional: Insert a slit aperture into the excitation pathway (as shown in Axmann et al. 4) to mask the majority of the field of illumination except the synapse. This way unbleached I-Ek/MCC (C)-Alexa Fluor 647 FRET acceptor molecules can move into the area of illumination.
- Add H57 scFV decorated T-cells to the bilayer (with imaging buffer), and wait until synapses appear in the field of view.
- Take in rapid succession a sequence of 10 to 20 image sets using 2-color detection:
i1) excitation 514 nm
i2) excitation 647 nm - Expose images for 1 to 5 msec and acquire as a set of images.
- To assess the identity of single molecule FRET events, apply the same correction regarding donor bleedthrough and acceptor cross-excitation. Moreover, single molecule FRET events have to align with single acceptor molecules and should appear and disappear in one step (see also Figure 7).
- Off-rate determination
- Record traces of single molecule FRET events for several acquisition time frames.
Note: In this example (in italics) the off-rate between the 5c.c7 TCR and I-Ek/K3 is measured at 25 °C with four different delay times (42 msec, 490 msec, 1,007 msec, 1,989 msec). - List FRET traces according to their trace lengths as shown in table 1.
- Convert table 1 into an inverse cumulative decay function (table 2) as shown (colored numbers are taken from table 1).
- To normalize the resulting decay function, divide the number of traces of table 2 by the sum of all traces in that particular group. Plot the normalized values against the number of time frames. When omitting the last time frame, which contains a zero, the decays can be readily fitted with a single exponential function (Figure 8A).
- As shown in Figure 8B, plot the expectation value lag)> , i.e., the negative inverse of the exponent of the decay function determined above against the delay time tlag employed (in this example: x= tlag = 0.042 s and y= lag)> = 1/0.662 = 1.511, x = 0.49 s and y = 1/0.902= 1.101, x = 1.007 s and y = 1/1.131 = 0.884, x = 1.989 s and y = 1/1.591= 0.629).
- Fit τoff and bleach> based on equation 3. This can be done using a non-linear fitting function of a scientific data analysis program such as Origin.
Note: The best fit shown in this example yields a τoff of 2.12 +/- 0.23 s and a bleach> of 1.53 +/- 0.06 sec. - Calculate the half life of the interaction t1/2 off with t1/2 off = τoff • ln(2) (in this example: 1.47 s).
- Record traces of single molecule FRET events for several acquisition time frames.
- 2D-KD determination
- Determine the conversion factor C for the FRET dye pair employed with the use of equation 6 and as outlined above (Figure 4A).
- Determine the FRET yields for individual TCR microclusters or entire synapses (Figures 3B and 5).
- Using equation 4 convert all individual FRET yields into TCR occupancies (Figure 4C).
- Apply equation 11 to convert all TCR occupancies into 2D-KDs. As is indicated below, synaptic binding is inhomogeneous. A meaningful measure for synaptic KDs is the median (indicated in red) of all measured microclusters (Figure 4D).
- Calculation of 2D-kons
- Calculate kon with the law of mass action with kon = koff/KD and the experimentally determined koff and KD values.
Note: The synaptic koff for the experiment shown in Figure 4 (I-Ek/MCC interacting with 5c.c7 TCR at 25 °C) is 0.41 s-1. Hence the KD plot (Figure 4D) can be converted into a kon plot as shown in Figure 4E.
- Calculate kon with the law of mass action with kon = koff/KD and the experimentally determined koff and KD values.
Results
Loading...
$$\rightleftharpoonup{xx}$$
$$\longleftharp{xx}$$,
$$\longrightharp{xx}$$,
The recording of intracellular calcium via the fura-2 calcium dye as well as the subsequent cellular analysis to verify the stimulatory potency and hence functionality of SLBs are shown in Figure 4. As becomes evident, calcium levels rise in T-cells (expressed as the normalized fura-2 340nm/380nm ratio with baseline being 1) immediately as soon as they settle onto the stimulatory SLBs. Calcium levels return to baseline levels shortly after the addition of a antibody which blocks pMHCs from TCR engagement and which terminates T-cell activation.
Figure 6 depicts a typical experiment involving FRET donor recovery after acceptor bleaching, which is employed to measure FRET yields and which serves to calculate 2D-KD values (shown in Figure 4). Please note the increase in FRET donor intensity, which represents TCR labeled via AF555, after rapid and complete ablation of the FRET acceptor species (here: AF647 associated with pMHCs). Also evident is the strong reduction in the FRET channel, i.e., the FRET-acceptor channel under FRET donor excitation, after FRET acceptor bleaching. The barely visible remaining signal corresponds to FRET donor bleedthrough. FRET yields within individual TCR microclusters or entire synapses are calculated based on the indicated measured intensity values (Figure 6B).
Figure 7 depicts a trajectory and time lapse of a single molecule FRET event visible in two time frames. As outlined above in the introduction such behavior is caused by both decay of synaptic TCR-pMHC binding and photobleaching. To discriminate between these two contributions, the experimental acquisition time frames have to be varied in duration: while photobleaching remains a constant, changes in FRET event trajectory length are only caused by the binding kinetics. A quantitation of tracelengths, which forms the basis for the calculation of off-rates and bleaching shown in Figure 7, are provided in tables 1 to 3.
Determination of 2D-KDs requires recording of bulk FRET yields for FRET-donor labeled TCRs. With the use of the experimentally deduced constant C (Figure 4), a FRET yield measured for a TCR microcluster or an entire synapse can be converted into the TCR occupancy a, i.e., the ratio of pMHC-engaged and total TCRs (Figure 4C). With known pMHC densities present on the SLB prior to addition of the T-cell, a values can be applied to determine synaptic 2D-KD values (Figure 4D). On-rates can be calculated with the law of mass action (2D-kon = 2D-koff/2D-KD) from the determined synaptic off-rate and 2D-KD values.
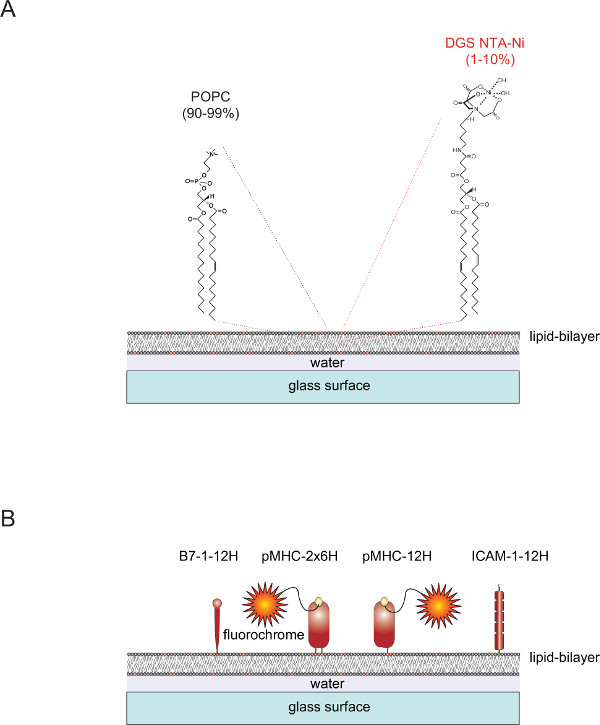
Figure 1. Schematic outline of the planar glass-supported lipid bilayer (SLB) system. (A) SLBs are composed of POPC (90-99%) and the synthetic lipid DGS Ni-NTA (1-10%) and form spontaneously when clean glass surfaces are charged with small unilamellar vesicles (SUVs) consisting of the corresponding lipids. (B) Once formed, such SLBs can be functionalized with soluble polyhistidine-tagged extracellular portions derived from pMHCs, costimulatory B7-1 proteins and ICAM-1 adhesion proteins, to serve as APCs for T-cells. For more information on preparing SLBs refer to Axmann et al.4. Please click here to view a larger version of this figure.
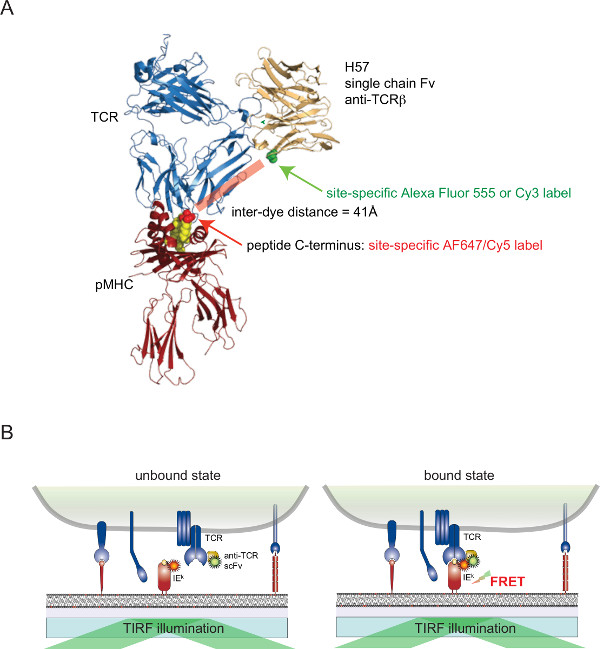
Figure 2. Förster Resonance Energy Transfer-based assay to quantitate TCR-pMHC binding in situ. (A) A composite structure of a TCR complexed with an H57 single chain fragment engaging a pMHC illustrates the FRET-based approach described herein. Note the short distance of about 41Å separating the two corresponding fluorophores undergoing FRET. Acceptor sites for fluorophore-maleimides are indicated in green and red. (B) The principle of detecting TCR-pMHC interactions in situ is illustrated. Only scFV-decorated TCRs and pMHCs (here I-Ek), which form specific complexes, give rise to a measurable FRET signal. Please click here to view a larger version of this figure.
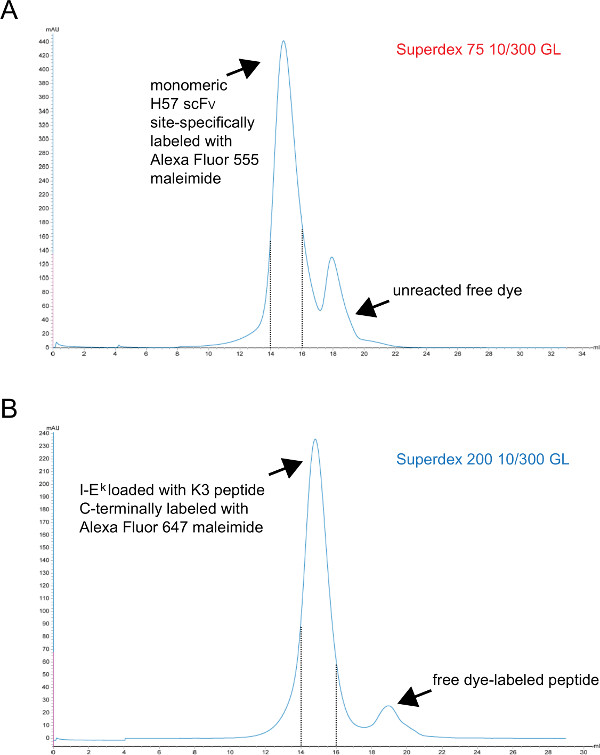
Figure 3. Chromatograms of the final gel filtration step giving rise to monomeric scFVs and peptide-loaded I-Ek -2x6H molecules. X-axes represent retention volume in ml, Y-axes indicate absorbance at 280 nm in arbitrary units (AU). (A) H57 scFV site-specifically labeled with Alexa Fluor 555 maleimide was subjected to S75 chromatography to separate unreacted dye from the protein (step 1.2.5). Fractions corresponding to retention interval 14 to15 ml (dashed lines) represent labeled monomeric H57 scFV. (B) I-Ek -2x6H molecules complexed with the UV-cleavable ANP-space holder peptide had been UV-irradiated, incubated with site-specifically Alex 647 maleimide-labeled peptide and finally subjected to S200 chromatography to separate the protein from free peptide (step 1.1.2.4). The interval between the dashed lines contains properly folded and monomeric pMHCs. (A, B) 0.7 ml sample was applied to the column at the start of the rum (0 ml point). Collected fractions were concentrated. The protein-to-dye ratio was determined by photospectrometry prior to dialysis against PBS/50% glycerol (for storage at -20°). Please click here to view a larger version of this figure.
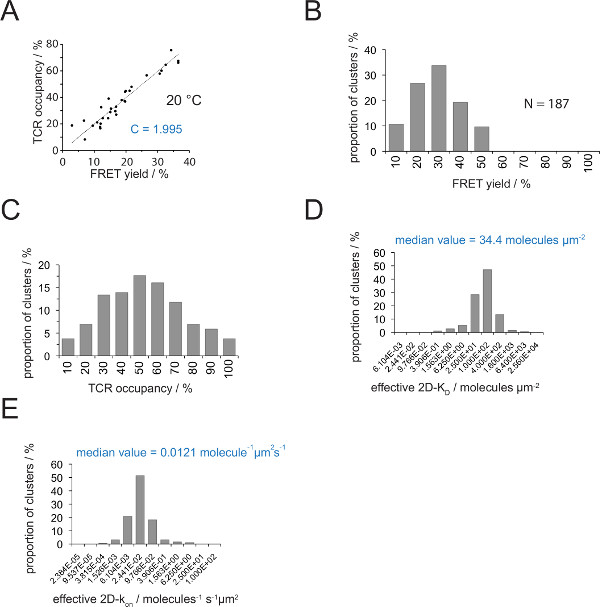
Figure 4. Determining 2D-KDs and 2D-kons. (A) The correlation between the FRET yield as determined by donor recovery after acceptor bleaching and TCR occupancy was measured experimentally. TCR occupancy can be determined for individual TCR microclusters as explained in section 4.2. A linear fit of the data is displayed by the line, the slope of which is equal to the ratio C between TCR occupancy and the FRET yield. C is a constant specific for the FRET system and the fluorophores (here Cy3 and Cy5) employed. In this example it yielded 1.988. (B) FRET yield data were determined for individual TCR microclusters (N = 187, temperature = 24 °C) through donor recovery of acceptor bleaching. Numbers below histogram bars indicate the upper limit within the interval. (C) Conversion of the data shown in (B) by multiplying measured FRET yields with the constant C determined in (A). Numbers below bars indicate the upper limit within the interval. (D) Histogram (semi-logarithmic, base = 4) depicting the distribution of 2D-KDs measured for individual TCR microclusters. The median 2D-KD is indicated in blue. Numbers below bars indicate the upper limit within the interval. (E) The histogram shown in (D) was converted into a 2D-kon -histogram (semi-logarithmic, base = 4) employing the synaptic koff for 24 °C (0.41 s-1). The determined median 2D-kon value is indicated in blue. Data were originally published in Huppa et al.2 and are visualized here in a new format. Please click here to view a larger version of this figure.
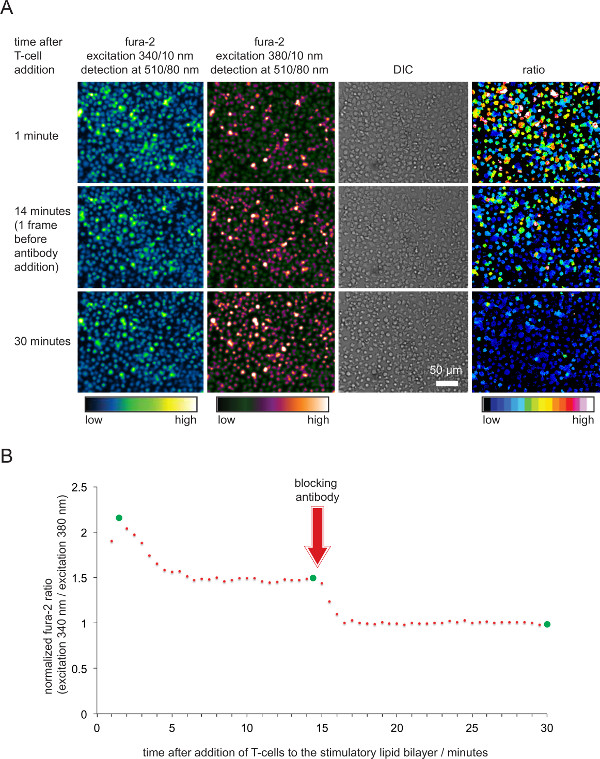
Figure 5. Functional validation of SLBs employed for T-cell stimulation and imaging. (A) TCR-transgenic T-cell blasts loaded with fura-2 were confronted with stimulatory SLB harboring antigenic pMHCs, ICAM-1 and B-7. Cellular fura-2 emission excited at 340 nm and 380 nm as well as DIC images were recorded. As indicated, ratio values of the emission intensities excited at 340 and 380 nm are shown in the right panel. Addition of pMHC blocking antibodies 14 min into the experimental run resulted in a decrease in intracellular calcium levels comparable to that of resting T-cells. (B) A typical temporal profile of average fura-2 ratios in T-cells contacting stimulatory SLBs is characterized by a an initial rise in intracellular calcium which is 2 to 4 times higher compared to that of non-activated T-cells or T-cells deprived of antigen after antibody-mediated blockade. Green circles indicate time points illustrated in (A). Please click here to view a larger version of this figure.
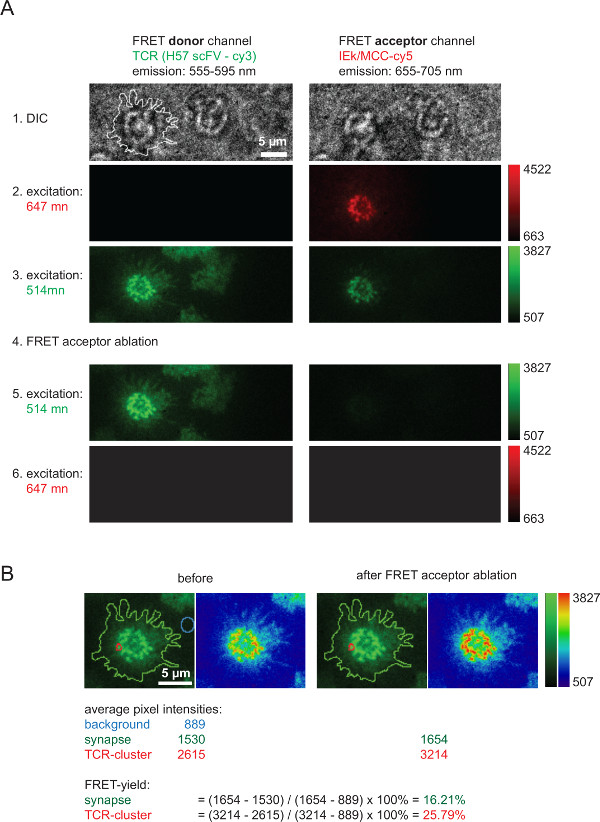
Figure 6. Bulk FRET yields as measured through FRET donor recovery after FRET acceptor bleaching. (A) Shown is an example of a typical synaptic FRET-measurement. As is indicated on the left and on top a series of images was acquired with the use of a emission beam splitter giving rise to a FRET donor and a FRET acceptor channel (for more detailed information on beam splitters refer to Axmann et al4). The line shown in the left DIC image indicates the boundary of the T-cell synapse. Note the loss in intensity within the FRET acceptor channel as well is the increase in intensity in the FRET donor channel after FRET acceptor bleaching (step 4). (B) FRET efficiencies can be quantified as indicated for individual synaptic regions or for entire synapses. For inspection, images before and after FRET acceptor bleaching are shown with the use of two lookup tables (LUTs, green and physics). Please click here to view a larger version of this figure.
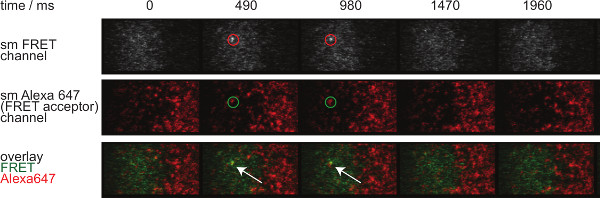
Figure 7. Single molecule FRET events appear and disappear insingle steps and are perfectly aligned with a single FRET acceptor fluorophore.The time lapse of the single molecule FRET event is shown. Images were acquired using a back-illuminated EMCCD camera. Please click here to view a larger version of this figure.
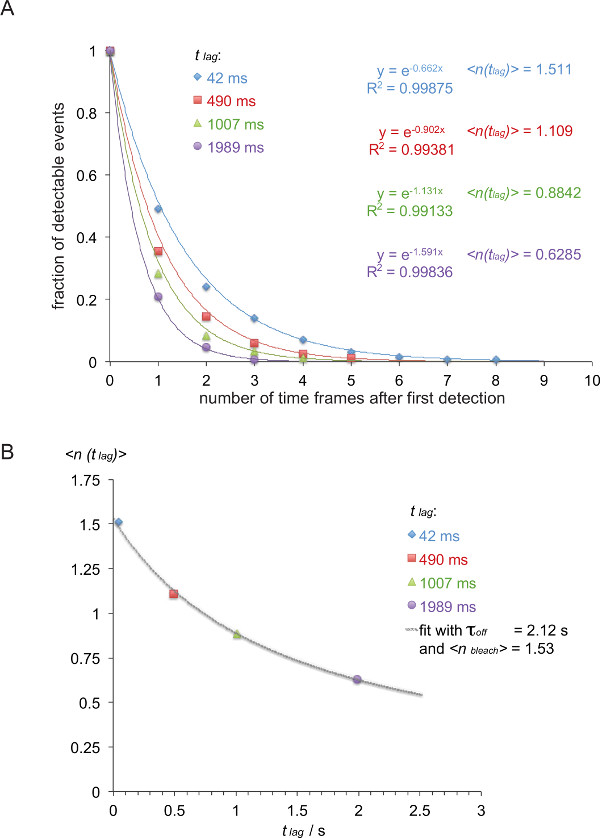
Figure 8. Determining τoff = 1/ koff from measured smFRET trajectories. (A) The normalized cumulative sums of observable FRET signals (derived from H57 scFV-AF555 decorated 5c.c7 TCR transgenic T-cell blasts recognizing I-Ek/K3-AF647 at 24°C) for four different time lags (42 msec, 490 msec, 1,007 msec, 1,989 msec) were plotted as a function of the total number of observations. Mono-exponential fit functions give rise to corresponding the negative inverse of the expectation values lag)>. (B) Expectation values were plotted against delays tlag and fitted using equation <n(tlag)> = τoff /{(τoff /<nbleach>) + tlag} to yieldτoffand bleach>. Please click here to view a larger version of this figure.
Discussion
Loading...
$$\rightleftharpoonup{xx}$$
$$\longleftharp{xx}$$,
$$\longrightharp{xx}$$,
Measuring protein-protein interactions in situ is highly desirable especially when dealing with low affinity interactions such as TCR-pMHC binding 11. This is because the on-rate as well as the stability of such interactions are significantly influenced by the particular circumstances under which binding takes place. Minimally-invasive FRET-based imaging approaches are thus in principle perfectly suited for such tasks, yet involve a number of hurdles that must first be overcome. Noise generated by cellular autofluorescence limits the sensitivity of the measurements and should therefore be kept at a minimum. TIRF microscopy serves this need very well 12 but requires the functionalization of glass-slides, ideally in the form of a planar glass-supported lipid bilayer decorated with proteins of choice 13-15. Another advantage of a partly reconstitutive approach is that recombinant bilayer-resident FRET partners can be much more easily labeled in a quantitative, site-specific and rational manner with smaller and brighter fluorophores than would be possible with cell surface-expressed proteins. TCRs are tagged with recombinant scFVs, which do not influence T-cell recognition, as was tested previously 2. Moreover, the protein composition of the SLB, for example the density of pMHCs and the choice of accessory factors can be adjusted to one’s specific needs. We have previously performed experiments with varying densities of stimulatory pMHCs, but have not detected significant differences in 2D-koff and 2D-KD2.
So far here the recognition of MHC class II molecules has been dealt with only, mainly because of the nature of their peptide binding cleft, which is open at both ends and thus accommodates larger peptides including a linker for fluorophore attachment. In some cases such approach might also work for labeling MHC class I molecules 16 but great caution should be taken to verify their use in experiments. The sensitivity of T-cells towards antigens, which can be measured via T-cell proliferation assays, as well as the pMHC-TCR binding kinetics as measured in vitro by surface plasmon resonance should not be affected by the addition of the linker and fluorophore to the peptide. Alternatively, MHC class I molecules themselves can be labeled in a site-specific manner with the introduction of an unpaired cysteine within the sequence of the heavy chain (unpublished observations).
With the use of appropriate molecular probes any synaptic protein-protein interaction can in principle be studied in a fashion described herein. Such probes, e.g., scFVs or Designed Ankyrin Repeat Proteins (DARPins)17, should be monovalent and should bind their target stably without affecting the interaction of interest. Of course, structural information is highly desirable for rational probe design but not absolutely required. When establishing a new pair of FRET partners, it is recommended to record and analyze FRET in bulk first. Sites of label attachment may be varied considerably to maximize the FRET signal and also to verify that measured FRET yields differ based on the inter-dye distance. Once the system is optimized, single molecule FRET signals may be recorded by limiting the labeling of the high abundance FRET partner to 10-30% and bleaching the low abundance FRET partner until single molecules are resolvable in the field of illumination.
Last but not least it should be noted that SLBs approximate some but not all aspects of a physiological plasma membrane. Qualities such as membrane curvature and flexibility, domain compartmentalization, cytoskeletal rearrangements and cell motility as well as a high variety of surface-expressed membrane proteins are not represented by SLBs but might influence the process under investigation. Much effort will need to be invested to establish imaging modalities that allow monitoring protein-protein interactions with single molecule resolution in physiological synapses, which are inaccessible to TIRF imaging.
Disclosures
Loading...
$$\rightleftharpoonup{xx}$$
$$\longleftharp{xx}$$,
$$\longrightharp{xx}$$,
The authors declare that they have no competing financial interest.
Acknowledgements
Loading...
$$\rightleftharpoonup{xx}$$
$$\longleftharp{xx}$$,
$$\longrightharp{xx}$$,
M.A. was supported by a Schrödinger fellowship of the Austrian Science Fund (FWF, J3086-B11) and thanks the Max-Planck-Society for financial and administrative support. G.S. and J.H. were supported by the Vienna Science and Technology Fund (WWTF, LS13-030).
Materials
| Name | Company | Catalog Number | Comments |
|---|---|---|---|
| LB-media | Fisher Scientific | 10000713 | bacterial expression |
| Sf900 II | Life Technologies | 10227402 | insect cell media for baculo virus production |
| Insect-XPRESS with L-glutamine (Lonza) | Fisher Scientific | 10564038 | insect cell media for baculo virus expression |
| Sf9 cells | Life Technologies | 11496-015 | cells for virus production and expansion |
| High Five Cells | Life Technologies | B855-02 | cells for potein expression |
| LB-media | Fisher Scientific | 10000713 | bacterial expression |
| Centramate System | Pall | protein concentartion from large volumes | |
| Centramate cassette 10kDa cutoff | Pall | OS010T12 | protein concentartion from large volumes |
| Amicon Ultra-15 Centrifugal Filter Units | EMD Millipore | UFC900308 | protein concentartion |
| Amicon Ultra-4 Centrifugal Filter Units | EMD Millipore | UFC800308 | protein concentartion |
| Amicon Stirred Ultrafiltration Cell Model 200 mL | EMD Millipore | 5123 | protein concentartion |
| Äkta pure 25L | GE Healthcare | 29-0182-24 | protein purification |
| Superdex 200 10/300 GL | GE Healthcare | 17-5175-01 | protein purification |
| Superdex 75 10/300 GL | GE Healthcare | 17-5174-01 | protein purification |
| Mono Q 5/50GL | GE Healthcare | 17-5166-01 | protein purification |
| Ni Sepharose 6 Fast Flow | GE Healthcare | 17-5318-01 | protein purification |
| Tricorn 10/20 column | GE Healthcare | 28-4064-13 | protein purification |
| Gilson HPLC system | Gilson | purificationof fluorochrome-coupled peptides | |
| Pursuit XRs C18, 5 µm particle size, 21.2*250mm column size | Agilent | A6000250X212 | purificationof fluorochrome-coupled peptides |
| Pursuit XRs C18, 5 µm particle size, 21.2*50 mm column size | Agilent | A6000050G212 | purificationof fluorochrome-coupled peptides |
| Tricorn 10/20 column | GE Healthcare | 28-4064-13 | protein purification |
| Gilson HPLC system | Gilson | purificationof fluorochrome-coupled peptides | |
| Pursuit XRs C18, 5 µm particle size, 21.2*250mm column size | Agilent | A6000250X212 | purificationof fluorochrome-coupled peptides |
| Pursuit XRs C18, 5 µm particle size, 21.2*50 mm column size | Agilent | A6000050G212 | purificationof fluorochrome-coupled peptides |
| Cy3 maleimide | GE Healthcare | PA23031 | site-specific protein labeling via mutant unpaired cysteines |
| Cy5 maleimide | GE Healthcare | PA25031 | site-specific protein labeling via mutant unpaired cysteines |
| Alexa Fluor 555 C2 Maleimide | Life Technologies | A-20346 | site-specific protein labeling via mutant unpaired cysteines |
| Alexa Fluor 647 C2 Maleimide | Life Technologies | A-20347 | site-specific protein labeling via mutant unpaired cysteines |
| Fura-2, AM, cell permeant | Life Technologies | F-1221 | calcium-sensitive dye for cell labeling |
| dimethyl sulfoxide | Sigma Aldrich | 151874 | for dissolving fura-2 am |
| Hank's Balanced Salt Solution plus calcium/magnesium | Fisher Scientific | 10225362 | imaging buffer |
| PBS | Life Technologies | 14190-136 | |
| Bovine Serum Albumin lyophilized powder | Sigma Aldrich | A2153 | supplement for imaging buffer |
| 14-4-4S antibody | affimetrix eBioscience | 14-5980-81 | blocking antibody for H2-I-Ek (recognized by the 5c.c7, 2B4 and AND TCR) |
| 5 ml polypropylene round-bottom tube | Becton Dickinson | FALCON 352063 | |
| 0.22 μm Ultrafree-MC centrifugal filter unit | EMD Millipore | UFC30GV0S | |
| Syringe filter 0.2µm | Millipore | GVWP04700 | |
| TetraSpeck Microspheres, 0.1 µm, fluorescent blue/green/orange/dark red | Life technologies | T-7279 | |
| Microscope for fura-2-based calcium measurements | LEICA | DMI4000B | |
| Microscope for (single molecule) FRET measurements | LEICA/ZEISS/NIKON/OLYMPUS | for details please refer to parallel JoVE contribution by Axmann et al. | |
| planar supported lipid bilayers | for details please refer to parallel JoVE contribution by Axmann et al. | ||
| RPMI 1640, with L-Glutamine | Life Technologies | 11554416 | T-cell media |
| non-essential amino acid 100X | Hyclone | SH30238.01 | T-cell media supplement |
| penicillin/streptomycin/L-glutamine 100x | Life Technologies | 12000226 | T-cell media supplement |
| 2-mercaptoethanol | Sigma Aldrich | M6250 | T-cell media supplement |
| mouse interleukin-2 recombinant protein | BPS Bioscience | 90185-B | T-cell media supplement |
| Research Grade Fetal Bovine Serum | Hyclone | SV30160.03 | T-cell media supplement |
| Origin (analysis program) | OrigenLab | http://www.originlab.com/ | non-linear fitting of two parameters (tauoff, [ntlag]) |
References
Loading...
$$\rightleftharpoonup{xx}$$
$$\longleftharp{xx}$$,
$$\longrightharp{xx}$$,
- Garcia, K. C., Adams, J. J., Feng, D., Ely, L. K. The molecular basis of TCR germline bias for MHC is surprisingly simple. Nat Immunol.. 10, 143-147 (2009).
- Huppa, J. B., et al. TCR-peptide-MHC interactions in situ show accelerated kinetics and increased affinity. Nature.. 463, 963-967 (2010).
- Huppa, J. B., Davis, M. M. The interdisciplinary science of T-cell recognition. Advances in immunology.. 119, 1-50 (2013).
- Axmann, M., Schuetz, G. J., Huppa, J. B. Single Molecule Microscopy on Planar Supported Bilayers. Journal of Vizualized Experiments J. Vis. Exp.. 101, e53158(2015).
- Xie, J., et al. Photocrosslinkable pMHC monomers stain T cells specifically and cause ligand-bound TCRs to be preferentially transported to the cSMAC. Nat Immunol. 13, 674-680 (2012).
- Jares-Erijman, E. A., Jovin, T. M. FRET imaging. Nat Biotechnol. 21, 1387-1395 (2003).
- Toebes, M., et al. Design and use of conditional MHC class I ligands. Nat Med. 12, 246-251 (2006).
- Tsumoto, K., et al. Highly efficient recovery of functional single-chain Fv fragments from inclusion bodies overexpressed in Escherichia coli by controlled introduction of oxidizing reagent--application to a human single-chain Fv fragment. J Immunol Methods. 219, 119-129 (1998).
- Ruegg, U. T., Rudinger, J. Reductive cleavage of cystine disulfides with tributylphosphine. Methods Enzymol. 47, 111-116 (1977).
- Ruprecht, V., Brameshuber, M., Schütz, G. J. Two-color single molecule tracking combined with photobleaching for the detection of rare molecular interactions in fluid biomembranes. Soft Matter. 6, 568-581 (2010).
- Dustin, M. L., Bromley, S. K., Davis, M. M., Zhu, C. Identification of self through two-dimensional chemistry and synapses. Annu Rev Cell Dev Biol. 17, 133-157 (2001).
- Axelrod, D. Cell-substrate contacts illuminated by total internal reflection fluorescence. The Journal of cell biology. 89, 141-145 (1981).
- Grakoui, A., et al. The immunological synapse: a molecular machine controlling T cell activation. Science. 285, 221-227 (1999).
- Kaizuka, Y., Douglass, A. D., Varma, R., Dustin, M. L., Vale, R. D. Mechanisms for segregating T cell receptor and adhesion molecules during immunological synapse formation in Jurkat T cells. Proc Natl Acad Sci USA. 104, 20296-20301 (2007).
- Varma, R., Campi, G., Yokosuka, T., Saito, T., Dustin, M. L. T cell receptor-proximal signals are sustained in peripheral microclusters and terminated in the central supramolecular activation cluster. Immunity. 25, 117-127 (2006).
- Purbhoo, M. A., Irvine, D. J., Huppa, J. B., Davis, M. M. T cell killing does not require the formation of a stable mature immunological synapse. Nat Immunol. 5, 524-530 (2004).
- Binz, H. K., Stumpp, M. T., Forrer, P., Amstutz, P., Pluckthun, A. Designing repeat proteins: well-expressed, soluble and stable proteins from combinatorial libraries of consensus ankyrin repeat proteins. J Mol Biol. 332, 489-503 (2003).
Reprints and Permissions
Request permission to reuse the text or figures of this JoVE article
Request Permission