This protocol describes the labeling of epidermal growth factor receptor (EGFR) on COS7 fibroblast cells, and subsequent correlative light- and electron microscopy of whole cells in hydrated state. The label contained fluorescent quantum dots. The protocol can be used to study the stoichiometry of EGFR at the single molecule level.
This protocol describes the labeling of epidermal growth factor receptor (EGFR) on COS7 fibroblast cells, and subsequent correlative fluorescence microscopy and environmental scanning electron microscopy (ESEM) of whole cells in hydrated state. Fluorescent quantum dots (QDs) were coupled to EGFR via a two-step labeling protocol, providing an efficient and specific protein labeling, while avoiding label-induced clustering of the receptor. Fluorescence microscopy provided overview images of the cellular locations of the EGFR. The scanning transmission electron microscopy (STEM) detector was used to detect the QD labels with nanoscale resolution. The resulting correlative images provide data of the cellular EGFR distribution, and the stoichiometry at the single molecular level in the natural context of the hydrated intact cell. ESEM-STEM images revealed the receptor to be present as monomer, as homodimer, and in small clusters. Labeling with two different QDs, i.e., one emitting at 655 nm and at 800 revealed similar characteristic results.
A new approach was introduced recently, to image whole cells with labeled proteins in liquid state using STEM1-3, or correlative fluorescence microscopy and STEM4-7. This methodology is capable of studying the spatial distribution of membrane proteins and protein complexes including their stoichiometry at the single molecule level in the intact plasma membranes of whole cells. Here, we describe a protocol involving a two-step specific labeling of receptor proteins with fluorescent quantum dots (QDs)8, and correlative light microscopy and ESEM-STEM. As example, we studied the EGFR, a membrane protein that belongs to the protein kinase superfamily. Upon ligand binding, the receptor activates and then forms a dimer with another activated EGFR; the subsequent signal cascade drives cell proliferation9. Mutations leading to abnormal EGFR expression or activity play a central role in many types of cancer10. Studying the spatial arrangement of this membrane receptor in whole cells provides important context information about its function and possible changes thereof11-14. But it remains challenging to probe the distribution of EGFR monomers, dimers, and clusters directly on a (sub-)cellular level with biochemical- or conventional microscopy methods15. Our method is capable of visualizing EGFRs with a spatial resolution of a few nanometers such that the locations of proteins in a complex can be determined. Most importantly, the obtained information about the stoichiometric distribution relates to the native situation of the protein in the intact cell.
In order to achieve a short distance between the label and the receptor, EGFR was directly labeled via its ligand EGF, using a biotin-streptavidin bond to a QD. This label can be detected both with fluorescence- and electron microscopy. We have used this label for correlative imaging of COS7 cells in liquid enclosed in a microfluidic chamber previously1,16,17. However, on account of a multiple of streptavidin molecules per QD, this label may induce receptor clustering, leading to a low labeling efficiency or rather expensive experiments, and it is not possible to conclude on the stoichiometry of the protein under investigation. Label induced receptor clustering can be avoided altogether by employing the two-step labeling procedure presented here, resulting in a probe comprising biotinylated EGF to which only one streptavidin-quantum dot (STR-QD) is coupled. The cells are first incubated with biotinylated EGF, and then fixed. The fixation step determines the time point at which protein processes are stopped (depending on the speed of fixation). STR-QD is applied thereafter as second step of the labeling protocol. Clustering does not take place since dynamic membrane motion of the proteins is hindered once the proteins are fixed. Moreover, the STR-QD solution, which is the most expensive component of the experiment, can be applied in an optimized low concentration, and this second step of labeling is not time-crucial, i.e., the QD can be coupled in several minutes.
To study the stoichiometry of EGFR as distributed in whole cells, cellular samples were prepared on silicon microchips18. After applying the two-step QD labeling, and the recording of fluorescence microscopy images, the cells were rinsed with pure water, and imaged in hydrated state using ESEM-STEM19. The resulting correlative images provide information about the cellular EGFR distribution, and the stoichiometry in their natural context of hydrated cells. A similar method was used to study HER2 proteins in breast cancer cells in a recent study7.
1. Preparation of Labeling and Fixation Reagents
2. Preparation of Silicon Nitride Membrane Microchips
3. Preparation of Cells on Microchips
4. EGFR Labeling, Fixation, and Fluorescence Microscopy
5. Wet ESEM-STEM of Whole Cells
Figure 1 and 2 show representative images of QD655 labeled, membrane-bound EGFR visualized in intact, fully hydrated COS-7 cells. The DIC image in Figure 1 a gives an impression of the membrane topography of the cells, and the corresponding fluorescence image in Figure 1b depicts the distribution of EGFR after 3 min of EGF-Biotin incubation. Figure 1A and B are each stitched together from two images recorded with a 40X air objective. The EGF activated EGFR is distributed over the entire cellular surface. In most cells a slight enhancement of fluorescence (Figure 1B) can be seen at the cell edges, indicating a locally increased occurrence of EGFR20. Control experiments conducted using a similar protocol verified specific EGFR labeling (data not shown). These controls included: 1) a control labeling without previous incubation of the cells with EGF-biotin, i.e., only incubation with STR-QDs, and 2) an incubation with non-biotinylated EGF and STR-QDs.
The three cells marked with rectangles were further investigated with ESEM-STEM. The ESEM-STEM images depicted in Figure 1C–E show low magnification overviews of these cells. These transmission images reflect whole cells in hydrated state with a thin layer of water residing over the cell placed on a silicon microchip with silicon nitride (SiN) viewing window. The vacuum chamber in the microscope contained water vapor, and the balance between sample temperature and pressure was adjusted to maintain a thin layer of liquid over the cells. The individual cells can be easily recognized on account of their shape and location on the SiN membrane window. The low-magnification ESEM-STEM images reveal fine structures, such as filopodia, extending from the cell edge towards neighboring cells, and some structures inside the thinner cell regions. Thick central cellular regions including the nucleus appear white because transmission through the sample is not possible for electrons of the used energy (30 keV).
High-resolution ESEM-STEM images were recorded in the thinner, peripheral regions. The spatial resolution for ESEM-STEM of nanoparticles in the thin regions of cells in a thin liquid layer was determined in a previous study6 to amount to 3 nm. Four high-resolution images shown in Figure 2A–D were recorded at the locations of the small rectangles in Figure 1C–E. The used magnification was sufficient to discern individual QDs, appearing as bright, bullet-shaped rods, each bound to an individual EGFR. The QD655 has typical dimensions of 6 x 14 nm2.
Figure 2A (corresponding to the rectangular area indicated on the cell in Figure 1C) shows QD labels on a membrane fold diagonally crossing the image. This membrane structure has a higher EGFR density than the surrounding membrane regions. At several locations, two labels were at close proximity. Two examples with distances of 20 and 24 nm are indicated with arrowheads. These pairs of labels are interpreted as belonging to EGFR dimers. Figure 2B gives an example from the edge of a cell (Figure 1D, left rectangle), EGFR monomers and dimers can be seen as well. Figure 2C (Figure 1C, right rectangle) was recorded of a region with a lower fluorescence signal, i.e., lower EGFR density. Nevertheless, EGFR was also found here in dimers as well. In addition, two clusters of 10 or 11 EGFRs were present (see ellipses). Figure 2D shows another example of a membrane fold (Figure 1E) with smaller clusters including 5-6 EGFRs, in addition to several monomers and dimers.
As an example of the kind of information that can be obtained from this data, the pair correlation function21 g(x) was determined for all label positions in Figure 2. Note that this analysis is not part of this protocol and the procedure was described elsewhere6,7. g(x) is a measure of the chance of a particle to be found within a certain radial distance x from a reference particle. g(x) = 1 represents a random distribution, and a larger value is evidence for clustering. The positions of a total of 210 labels were automatically detected in the four images of Figure 2A-D, and g(x) was calculated using a bin size of 5 nm and a smoothing filter with a bandwidth of 10 nm. The g(x) curve (Figure 3) shows a preferred center-to-center QD distance of 25 nm. EGFRs are thus not randomly oriented but a significant fraction of them resides at this preferred distance. From an approximate molecular model6 (Figure 3 inset) we estimate that the center-to-center distance between the QD and the EGF binding pocket amounts to ~14 nm, and center-to-center distance between the two QDs attached to a EGFR dimer to be ~27 nm (this value is likely to vary by a few nanometers due to the flexibility of the linker). The preferred label distance is thus consistent with the expected label distance for the EGFR dimer within the precision of the method. The g(x) curve is larger than unity for distance of up to 300 nm, indicating the presence of clusters, consistent with the data. This analysis shows that the stoichiometry of the EGFR can be studied with our method.
Figure 4 shows a similar result as Figure 2, except that the labeling was performed with EGF-QD800, and a 63X oil immersion objective was used for the fluorescence image. This data confirms that these typical results are also found when the EGFR labeling is done with QDs, which emit in the near red spectrum. Figure 4A is the fluorescence image of a representative cell, Figure 4B shows the same cell in ESEM-STEM overview mode and Figure 4C is a 150,000 x magnification image, recorded at the upper membrane border of the cell (see rectangle in Figure 4B). Similar to Figure 2A and D, the images capture QD-labeled EGFR on a membrane fold and shows monomeric, dimeric, and clustered receptors. Note that the electron dense QD core appears somewhat smaller and rounder than the cores of QDs emitting at 655 nm, consistent with their smaller core size22 of ~5 nm.
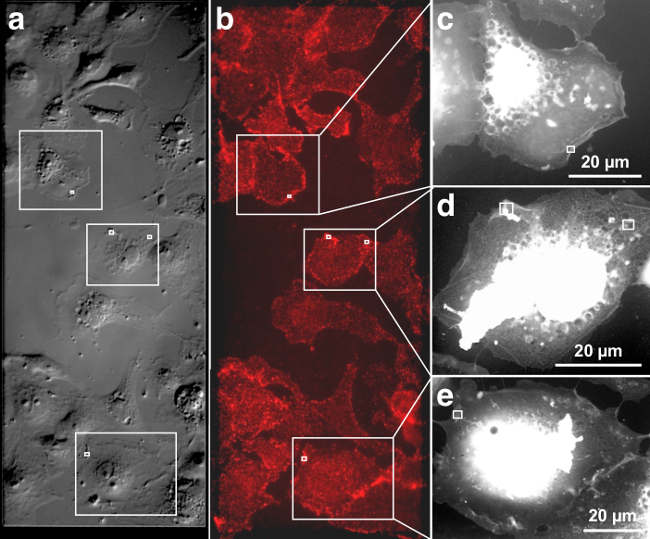
Figure 1. Correlative DIC, fluorescence and ESEM-STEM of EGF-QD655 labeled EGFR on fully hydrated COS-7 cells. (A) DIC image of the cells grown on the SiN membrane window area, giving a topographic impression of the plasma membrane. (B) Fluorescence image showing cells on the centrally located SiN membrane window (marked by the dashed rectangle). (C–E) Three ESEM-STEM low magnification images from the cells marked with rectangles in A and B. These cell overview images serve to determine the precise location of subsequently recorded high-resolution images. The location of four high-resolution images (shown in Figure 2A-D) are marked with white rectangles. Please click here to view a larger version of this figure.
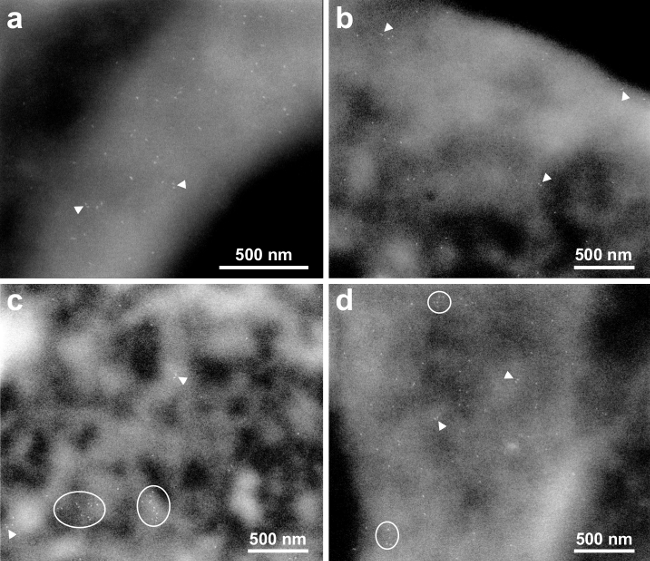
Figure 2. High-resolution ESEM-STEM images depicting membrane bound EGFRs. (A) Micrograph at 75,000X magnification of the area marked in Figure 1B. Many monomers are visible. Several dimers are indicated with the arrowheads. (B) and (C) images acquired at 50,000X magnification of the left, respectively right, membrane areas marked in Figure 1C. Clusters of EGFRs are outlined. (D) image recorded with 50,000X magnification at the location marked in Figure 1D. Please click here to view a larger version of this figure.
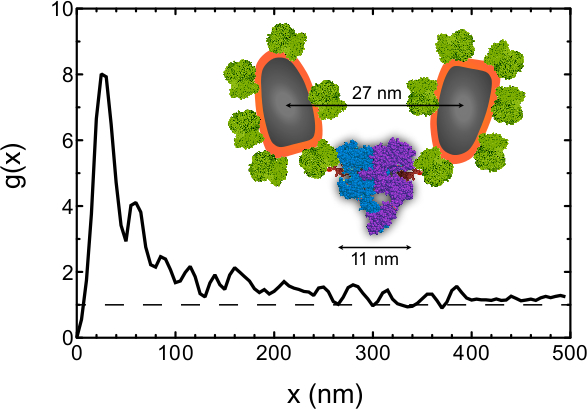
Figure 3. Pair correlation function g(x) as function of the radial distance x determined for the inter-particle distances of all 210 labels detected in Figure 2A-D. The peak at 25 nm indicates that a center-to-center QD distance has a much higher chance of occurring than random, whereby a g(x) = 1 indicates a random chance. The dashed line is a guide to the eye representing g(x) of a random distribution. The inset shows an approximate molecular model of the EGFR dimer with bound EGF and streptavidin coated QDs attached via biotin. The models of streptavidin, EGF and the EGFR were obtained from CPK models of the 1stp (streptavidin), 1EGF (EGF), 1NQL, 2JWA, 1M17, 1IVO and 2GS6 (EGFR) structures in the RCSB Protein Protein Databank, created by Jmol Version 12.2.15. The biotin model is as drawn in RCSB Ligand Explorer Version 1.0. Please click here to view a larger version of this figure.
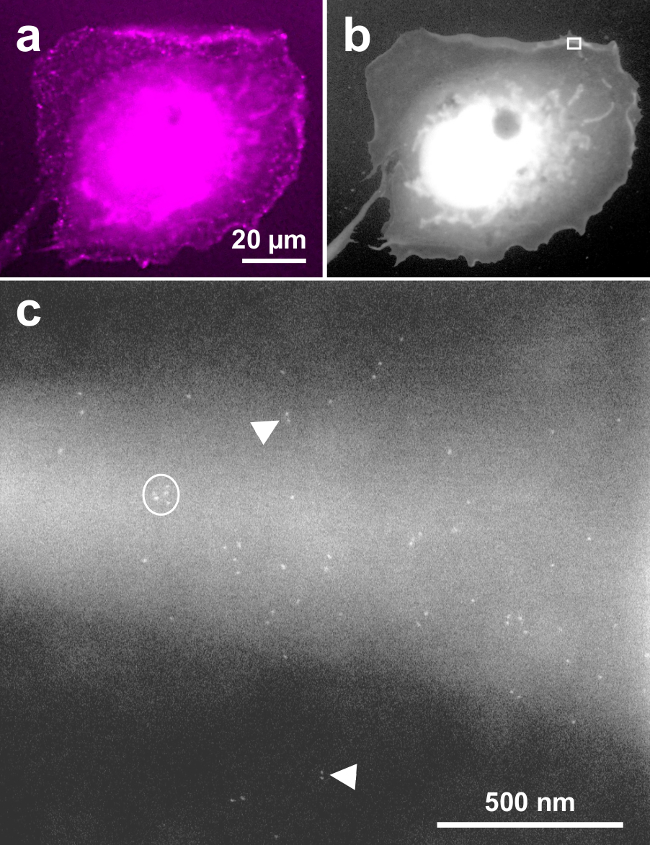
Figure 4. Exemplary COS-7 cell labeled with EGF-QD800 and imaged with correlative fluorescence and ESEM-STEM. (A) Fluorescence image, (B) low magnification overview ESEM-STEM image. (C) High-resolution image recorded at the location of the rectangle in b at 150,000X magnification. Monomeric, dimeric, and clustered EGFRs are detected similar to labeling with EGF-QD655. Please click here to view a larger version of this figure.
Studying the spatial distribution and stoichiometry of the membrane proteins, such as the EGFR, in whole cells provides important context information about its function and possible changes thereof11-14. It is challenging to study the distribution of monomers, dimers, and clusters directly on a subcellular level using commonly used biochemical methods, for which information is lost about the localization of the protein in the cell or differences between cells15. The labeling and microscopy methods described here allow the visualization of protein complexes on a length scale of a few nanometers so that its stoichiometry can be studied within the context of individual, intact cells4-7. This is not possible with (super resolution) light microscopy23 because its resolution is insufficient to distinguish molecules engaged in a protein complex. Förster Resonance Energy Transfer (FRET) is an ensemble averaging technique24, and does not necessarily detect the dimers and higher order clusters as a consequence of the short range of the energy transfer25. Proximity ligation assays26 do not actually measure distances and are thus not capable of distinguishing between a cellular region with a high protein density, inevitably leading to a number of detected proximities by random chance, from a cellular region with a similar protein density but containing protein complexes exhibiting distinct distances between the labels. The required high resolution to visualize the constituents of protein complexes is achieved by transmission electron microscopy (TEM). However, conventional TEM of whole cells is limited by the requirement of thin samples/sections slicing through the plasma membrane27, or plasma membrane ripping or breaking off28,29 resulting in randomly formed small pieces of membrane. The plasma membrane is thus not imaged as a whole, leading to a lack of possibly crucial cellular context information.
Other experimental challenges for the study of protein stoichiometry in cells arise from the applied protein labeling. Commonly used immunolabeling bears the difficulty that one-to-one stoichiometry between receptor and label can only be achieved with a monovalent probe; this is not the case when primary and secondary antibodies are required. To obtain information about the protein stoichiometry, it is required that a probe binds uniquely to one epitope on the receptor and has one binding site for a fluorescent probe or a high atomic number nanoparticle on the other side. Secondly, the precision achievable with antibody-labeling is restricted on account of their large size30 to 30 nm, so that a discrimination between neighboring single proteins, homodimers, or larger clusters is not feasible, at least not for receptors of the EGFR family. Much smaller specific labels are known in literature and can be applied even for intracellular labeling31 but those are not commonly used. The length of the whole label (EGF-biotin-streptavidin-QD) is of a similar dimension as the EGFR, and sufficiently small to be able to detect the dimer. Moreover, the described two-step labeling procedure avoids labeling induced receptor clustering.
Our method is not very difficult, not much more than fluorescence microscopy of labeled proteins. However, an experiment needs to be carried out with great care, since the number of steps adds up and an error in one of the steps may lead to a complete failure in the experiment. Handling the microchips is not more tedious than the handling of TEM grids but some training empty chips is recommended. ESEM-STEM of whole hydrated cells is probably the most difficult aspect, and requires at least a skilled operator and several days of practice in order to reach a resolution around 3 nm as needed to visualize the QDs. Radiation damage of the specimen under investigation presents a risk. The pressure and the temperature should be carefully watched to maintain a water layer. Moreover, the thickness of the water layer may vary between cells. It is advisable to monitor the presence of the water layer using the gaseous electron detector above the specimen, as described elsewhere6. Cellular regions should only be imaged once or twice to avoid damage.
A key limitation of the method is that high-resolution information about the ultrastructure is absent. Other techniques, for example, cryo TEM, are needed to study the protein structure, and the cellular ultrastructure15. Secondly, studying the dynamic interplay of a multiple of proteins in live cell in time-lapse microscope is not feasible on account of radiation damage, and requires state-of-the-art light microscopy23. Currently, our method is not capable of determining the absolute level of dimers since the labeling efficiency is unknown but we expect to add such data in future. It is nevertheless possible to tell if dimers are present or not. From the literature is it known, that even a labeling efficiency around 15% is enough to detect dimers with sufficient statistical significance32.
It is readily possible to study other membrane-bound receptors via their ligand, via biotinylated Fab fragments of specific antibodies, or via other small linkers7 using the described two-step labeling protocol. Since we have already demonstrated that two different colors (sizes) of QDs can be used, and gold nanoparticle labeling was used in prior work6, it seems feasible to label multiple protein species in the same experiment. The key challenge for the study of the stoichiometry of multiple protein species is ensuring a similar labeling efficiency for both species or at least a normalization of the obtained relative stoichiometry on the respective labeling efficiencies. Yet, the two different QDs used in this study do not seem to differ much in labeling efficiency (see Figures 2 and 4). The described method involving two-step labeling with QDs, and correlative fluorescence microscopy and ESEM-STEM presents a viable method to study the complex interplay of membrane proteins in the intact plasma membranes of whole cells.
The authors have nothing to disclose.
We thank E. Arzt for his support through INM, M. Koch for help with the ESEM, and DENS Solutions for providing the microchips. Research in part supported by the Leibniz Competition 2013.
Inverted fluorescence microscope | Leica | AF6000 + DMI6000B | |
ESEM | FEI Company | Quanta 400 FEG | |
Chemicals | |||
DMEM (1x) + GlutaMax + glucose + pyruvate | Gibco | 31966-021 | |
DPBS (1x) – Calcium chloride – Magnesium chlorid | Gibco | 14190-144 | |
Fetal bovine serum, Performance Plus (FBS) | Gibco | 16000-036 | |
Cellstripper | Mediatech, Inc. | 25-056 Cl | |
Water, chromasolv Plus for HPLC | Sigma-Aldrich | 34877-2.5L | |
PBS Roti-Stock 10x PBS | Carl Roth | 1058.1 | |
Ethanol, Rotisolv HPLC grade | Carl Roth | P076.2 | |
Albumin Fraction V, biotin-free (BSA) | Carl Roth | O163.2 | |
Gelatin, from cold water fish skin | Sigma-Aldrich | G7041-500G | |
Glycine | Carl Roth | T873.1 | |
shoul | Molecular Probes | E3477 | |
Sodium teraborate decahydrate | Sigma-Aldrich | S9640-500G | |
Boric acid | Sigma-Aldrich | B6768-500G | |
Qdot 655 streptavidin conjugate | Molecular Probes | Q10121MP | |
Qdot 800 streptavidin conjugate | Molecular Probes | Q10173MP | |
Materials | |||
Silicon microchips with silicon nitride membranes | DENS Solutions | Custom made | |
of 50 nm thickness and dimensions of 50 µm x 0.40 mm |