Here we employ FISH methodology to track LINE-1 retrotransposition at the single nuclei level in chromosome spreads of HepG2 cell lines stably expressing synthetic LINE-1.
Long interspersed nuclear element-1 (Line-1 or L1) accounts for approximately 17% of the DNA present in the human genome. While the majority of L1s are inactive due to 5′ truncations, ~80-100 of these elements remain retrotransposition competent and propagate to different locations throughout the genome via RNA intermediates. While older L1s are believed to target AT rich regions of the genome, the chromosomal targets of newer, more active L1s remain poorly defined. Here we describe fluorescence in situ hybridization (FISH) methodology that can be used to track patterns of L1 insertion and rates of ectopic L1 incorporation at the single nucleus level. In these experiments, fluorescein isothiocyanate/cyanine-3 (FITC/CY3) labeled neomycin probes were employed to track L1 retrotransposition in vitro in HepG2 cells stably expressing ectopic L1. This methodology prevents errors in the estimation of rates of retrotransposition posed by toxicity and account for the occurrence of multiple insertions into a single nucleus.
Human Long Interspersed Nuclear Element-1 (Line-1 or L1) is an autonomous mobile element that propagates within the genome through a "copy and paste" retrotransposition mechanism. A typical human L1 is ~6 kb long and consists of a 5'UTR (Untranslated Region) that serves as a promoter, two open reading frames (ORFs): L1-ORF1 and L1-ORF2, and a 3'UTR with a polyA tail. L1-ORF1 protein has three distinct domains: a coil-coil domain, RNA recognition Motif and C-terminal domain, while L1-ORF2 protein has endonuclease, reverse transcriptase and cysteine rich domains1,2,3,4,5. L1-ORF1 exhibits nucleic acid chaperone activities, while L1-ORF2 provides enzymatic activities, with both proteins required for retrotransposition1,2,6.
A cycle of L1 retrotransposition starts with transcription from the 5'UTR of L1 bicistronic mRNA by RNA polymerase II, translocation into the cytoplasm, and translation. In the cytoplasm, L1-ORF1 exhibits either cis-binding where it packages its own RNA or trans-binding where it packages other RNAs (i.e., SINE/SVAs/pseudogenes) to form a ribonucleoprotein particle (RNP) with L1-ORF2p7,8. RNPs translocate into the nucleus where the endonuclease activity of L1-ORF2p nicks genomic DNA (gDNA) to expose an OH– group9, that is in turn used by reverse transcriptase to prime and reverse synthesize RNA to DNA from the 3' end. During reverse synthesis, the second strand of DNA is nicked 7-20 bp from the original nick site to create staggered breaks which are filled to form the signature L1 insertion sequences (e.g., TTTTAA) called target site duplications (TSD)9,10. This process is known as target prime reverse transcription (TPRT) and leads to insertion of full or truncated copies of L1/other DNAs with TSDs at both ends of the inserted sequence. L1 retrotransposition has also been shown to be mediated through TPRT-like non-homologous end-joining in some cells types11.
The L1 retrotransposition vector employed in our studies is non-episomal and consists of tagged L1-ORF1&2p driven by combined CMV-L1-5'UTR promoters (Figure 1)12. Earlier versions of this construct have been described in studies using yeast and human cell cultures13,14,15. Two distinct CMV promoters located at the 5' and 3' ends of the vector, with the 3' end placed in reverse orientation to drive expression of neomycin after splicing and integration. The retrotransposition indicator cassette at the 3' end consists of a neomycin gene inserted antisense to L1-ORFs and rendered inactive by separation into two halves by a globin intron with spliced donor (SD) and spliced acceptor (SA) sites (Figure 1). Upon integration into a chromosome, L1 is transcribed from the common promoter to produce an mRNA that consists of a bicistronic mRNA and inactive neomycin mRNA. During RNA processing, the globin intron is spliced out of the neomycin gene to restore a fully functional neomycin gene. The hybrid mRNA is packaged into a RNP in cis and translocated into the nucleus where it is integrated into the genome as either full length or truncated insertions using TPRT.
Here we describe a methodology that uses fluorescence in situ hybridization (FISH) with probes specifically directed at the spliced neomycin gene (SNeo) to track L1-retrotransposiition patterns and insertion rates at the single nucleus level. The efficiency and specificity of detection was confirmed using retrotransposition competent and incompetent constructs and probes to detect SNeo or the neomycin and globin intron junction16. This methodology accounts for some of the shortcomings of cell culture based retrotransposition assays, such as multiple insertions, colony resistance and favorable clone expansion.
NOTE: All steps should be carried out at room temperature unless otherwise specified. Please refer to Reagents section for details on how to prepare individual reagents.
1. Labeling L1 Probes
NOTE: Probes can be labeled by chemical or PCR labeling.
2. Preparing Chromosome Spreads
3. Fluorescence In Situ Hybridization (FISH)
A schematic diagram of the L1 retrotransposition vector is presented in Figure 1. The vector consists of a neomycin gene in antisense orientation to L1 ORFs that is interrupted by a globin intron in sense orientation and sandwiched by SD and SA sites. When stably integrated into a chromosome, L1 mRNA is transcribed from the combined CMV and L1-5'UTR promoter (Figure 1). During RNA processing, the globin intron is spliced out of the neomycin gene. The Neo-L1 RNA is packaged, translocated and integrated into the genome as either a full length or truncated insertion. As indicated, L1 retrotransposition can be tracked by FISH using probes specific for spliced neomycin (Figure 1).
Figure 2 shows a schematic representation of the neomycin probe, with the labeled probed that is larger in size and fluorescence deficient due to differences in excitation wavelengths. Note that the CY3 and FITC excite at different wavelengths than ethidium bromide stained DNA.
The density of metaphase chromosome spreads was determined by diluting the original stock solution into 1:2, 1:4, 1:8 and 1:16 dilutions and each spread evaluated for density, distribution and distance of spreads from the nucleus at 10X magnification (Figure 3A). The results show high density, clumpy and burst out spreads (Figure 3A-i-ii), as well as evenly distributed and well-spaced spreads (Figure 3A-iii-iv). Low density spreads with even distribution were chosen for subsequent analysis.
Chromosome spreads were stained with Hoechst dye and spread quality evaluated based on the length of chromosomes, roundness of the spreads and inter-chromosome distance (Figure 3B). These indices were influenced by the length of time the cells were treated with colcemid, hypotonic solution, Carnoy Fixative solution and/or the manner in which the cells were busted to release chromosomes. If cells were incubated for a short period in hypotonic solution, chromosome spreads became tightly knotted and individual chromosomes were difficult to visualize (Figure 3B-i). On the other hand, longer incubation in hypotonic solution resulted in rupture of the nuclei, scattering of chromosomes, and/or loss of chromosomes (Figure 3B-ii). Longer incubations in colcemid increased the number of cells in metaphase, but lead to condensation of chromosomes (Figure 3B-iii). As such, a good quality chromosome spread requires optimal incubation periods in both colcemid and hypotonic KCl solution. In our hands, a 90 min incubation in colcemid, 20 in hypotonic solution at 37 °C and the use of a hot steam to burst the cells were found to be optimal conditions for generation of high quality spreads (Figure 3B-iv).
Chromosome spreads were stained for L1 retrotransposition using probes that target SNeo. The probe was labeled with both FITC and CY3 to show that in both cases L1 retrotransposition is seen only in cells expressing wild type L1 (Figure 4). No staining was seen in cells expressing the vector backbone alone (Figure 4; compare top and bottom panels for each fluorophore). In our hands, probe signal was detected in 80-90% of nuclei, with the overwhelming majority of the signal representing single retrotransposition events. We only scored retrotransposition in nuclei with more than one insertion and spread quality was always examined before FISH.
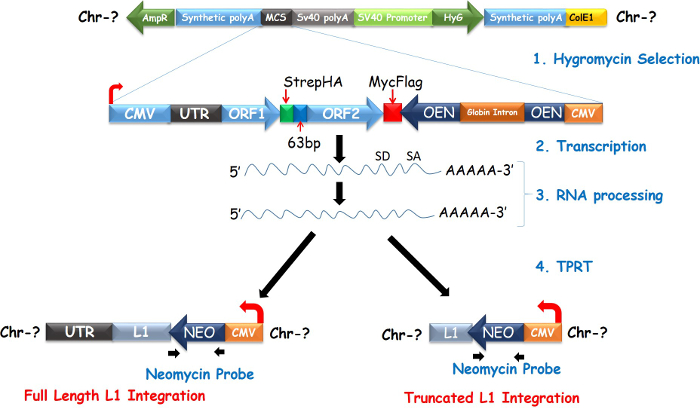
Figure 1. Schematic diagram of L1 retrotransposition vector. Diagram depicts the process of target prime reverse transcription leading to full or truncated L1 insertions. Please click here to view a larger version of this figure.
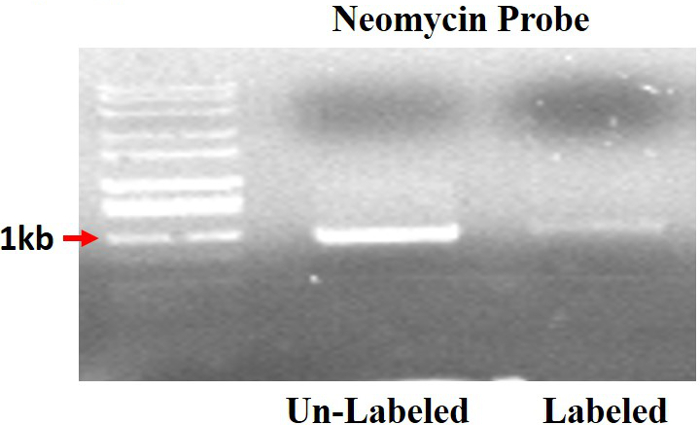
Figure 2. Labeled SNeo and unlabeled neomycin probes. The labeled probe exhibits less fluorescence and is larger in size compared to the unlabeled probe. Please click here to view a larger version of this figure.
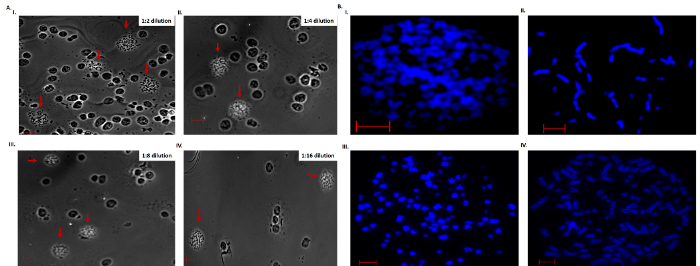
Figure 3. Phase-contrast (Bright Field) and Hoechst stain chromosome spreads. A) Shows dilution of spreads to obtain well-spaced preparations. Scale bar is 50 µm. B) Hoechst stain chromosome showing the influence of colcemid, hypotonic solution, Carnoy Fixative solution and the bursting on spread quality. Scale bar is 10 µm. Please click here to view a larger version of this figure.
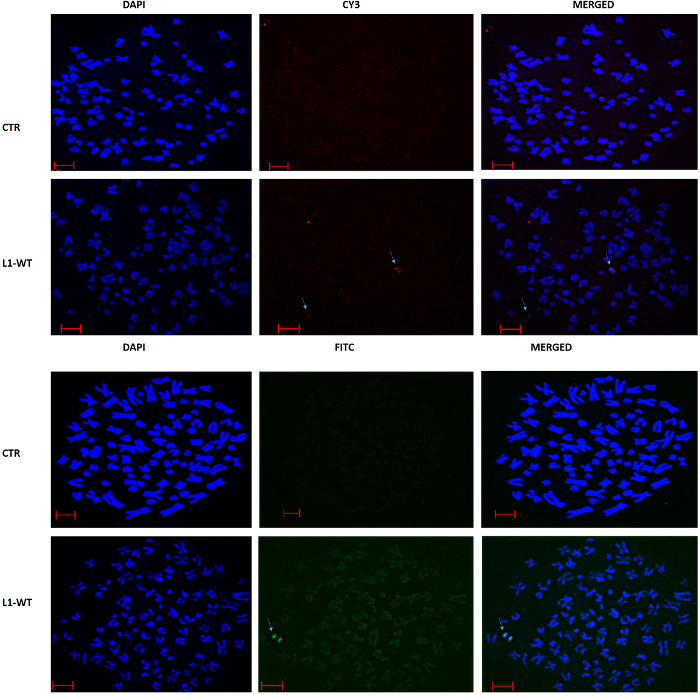
Figure 4. FISH analysis of L1 retrotransposition. Staining of SNeo is absent in control cells, but present in cells expressing L1 wildtype vector. Scale bar is 10 µm. Please click here to view a larger version of this figure.
Methodologies such as whole genome sequencing, inverse PCR and southern blotting have been employed to study L1 retrotransposition. Although these methodologies are extremely valuable in locating where L1 insertions occur within genomes, a confounding challenge for all of them is the need for in-silico programing to reassemble sequences. The FISH methodology described here is designed to complement these methods, especially in the case of studies requiring analyses of ectopic L1 retrotransposition in cultured cells. The approach can be used for both quantitative and qualitative evaluation of retrotransposition events and applied to interphase nuclei. This methodology boasts the accuracy of subsequent in-silico sequence alignment methods employed to determine ectopic L1 insertion sites16. Alignment of repetitive sequences can be ambiguous due to the formation of homopolymers, while repetitive sequences can be lost during primer amplification of template resulting in underrepresentation of repetitive sequences. FISH methodology can overcome these problems because FISH probes can anneal to homopolymers and are unlikely to be biased against intact repeat sequences16. In addition, compared to cell culture-based retrotransposition assays, FISH can determine retrotransposition rates at the single nucleus level. As such, this approach prevents both under and over estimation of retrotransposition rates as multiple insertions can occur into single nuclei16. Recent data obtained from NGS have confirmed that cell culture based methodologies underestimate retrotransposition frequencies25.
It remains unclear where young L1s prefer to insert and whether a targeting mechanism exists to direct these insertions within the genome. Using the above methodology we have shown that L1 inserts preferentially into gene poor regions of the genome16. Others have shown that the abundance of L1 sequences is increase in chromosomes with a lesser gene density17,18. Together, these findings suggest a regulated mode of insertion where threats to the cell are minimized by insertion of L1 into "lesser active" regions of the genome. The pattern of transposable element movement in lower organisms has lent support to this interpretation. For example, fission yeast retrotransposon, Tf1, integrates 95% of the time upstream of gene promoters and the majority of these genes are involved in stress regulation19,20. In yeast cells that lack access to nitrogen, Ty5 integrates into the ORFs instead of heterochromatin regions21. Experiments in maize have shown that integration of DNA transposons lead to variegated corn color phenotypes and integration of Hatvine1-rrm DNA transposon into the promoter region of VvTFL1A gene has been shown to influence the branching pattern and the fruit size of grapevines22,23.
The steps critical to the success of the FISH methodology detailed here are the generation of good chromosome spreads and proper labeling, purification and hybridization of probes. If probes are not cleaned properly, the resulting high background signal will make it difficult to resolve probe binding to chromosomes. Preferably, probes should be gel-purified to eliminate residual fluorescence from dNTPs. Also, the length of time that spreads are incubated in Carnoy Fixative solution is important to prepare good chromosome spreads. If too long, the cell membrane may burst prematurely and cause chromosome loss. If too short, it may be difficult to obtain suitable spreads because of deficient membrane rupture. The amount/concentration of formamide determines the focus of chromatids and therefore it is important to optimize empirically for best results. All washes should be thorough to ensure that all unbound probes and secondary antibodies are washed off.
In conclusion, the FISH methodology described here can be used to detect both full length and truncated ectopic L1 retrotransposition events and can be applied to other retrotransposition vectors using green fluorescence protein (GFP) as a retrotransposition indicator cassette. Although full length L1 insertions can be determined using this methodology, it will not discern new endogenous truncated insertions due to the number of truncated L1s within the genome. The accessibility of probe might also be restricted by increase heterochromatin formation16,24. However, the inclusion of LNA within FISH probes can be employed to enhance probe annealing. Detection of SNeo is contingent upon a full cycle of retrotransposition and insertions smaller than the probe/deletion can be missed.
For detailed descriptions of experiments in which the use of these vectors and the expression of L1 proteins and retrotransposition are characterized, please refer to published works12,16.
The authors have nothing to disclose.
This work was supported in part by grants from the National Institute of Environmental Health Sciences (ES014443 and ES017274) and AstraZeneca to KSR.
Labeling Probes | |||
Go Tag DNA polymerase | Promega | M3178 | |
GO Tag 10X colorless buffer | Promega | M3178 | |
Individual dNTP | Sigma | DNTP10 | Adjust the concentration of dATP, dGTP, dCTP to 2mM and dTTP to 1.5mM in nuclease free water. |
dUTP-16-Biotin (0.5mM) | Roche | 11093070910 | |
dUTP-FITC (0.5mM) | Thermo Scientific | R0101 | |
dUTP-CY3 (0.5mM) | Sigma | GEPA53022 | |
MIRUS FISH Labeling Kit | MIRUS | MIR3625 | |
MIRUS FISH Labeling Kit | MIRUS | MIR3225 | |
NucleoSpin PCR Clean-Up kit | Qiagen | 1410/0030 | Any PCR clean reagent can be used in place of NucleoSpin PCR Clean Up Kit |
PCR Machine | Any Thermocycler machine can be used to amplify the label product. | ||
Agarose | Sigma | A9539 | |
Name | Company | Catalog Number | Comments |
Preparing chromosome Spreads. | |||
Colcemid | Life Technologies | 15212-012 | Add Colcemid directly to growth media to a final concentration of 0.4 µg/mL |
1M KCl | Sigma | P9541 | Dilute 1M KCl solution to 75 mM solution to make Hypotonic Solution |
Carnoy Fixative Solution | Mix 3 volumes of methanol and 1 volume of acetic acid to make Carnoy Fixative Solution. Make Fresh everytime. | ||
Methanol | Sigma | 322415 | |
Acetic acid | Sigma | 320099 | |
Hoechst-33342 | Thermo Scientific | 62249 | Dissolve Hoechst-33342 in PBS to final concentration of 1 mg/mL. |
Diamond Point Marker | Thermo Scientific | 750 | |
Frosted Slides | Thermo Scientific | 2951-001 | |
Trypsin-EDTA (0.25%) | Life Technologies | R001100 | To detech cells, incubate cell in Trypsin for 5 mins and inactive with equal volume of complete media |
Cover slides | VWR | 48366067 | |
Coplin Jars | Thermo Scientific | 107 | |
Heat Block | Any heat block can be used for this purpose, though blocks fitted for heating slides are recommended. | ||
Beaker (600ml) | Sigma | CLS1003600 | Fill the beaker with water, heat to boil, use the hot steam to burst chromosomes. |
Nikon Microscope | Nikon | 125690 | Any microscope can be used to look at spread quality. |
Name | Company | Catalog Number | Comments |
Reagents and Materials for FISH | |||
Trisodium citrate | Sigma | S1804 | |
Sodium Chroride | Sigma | S3014 | |
Formamide | Sigma | F9037 | |
Tween-20 | Sigma | F1379 | |
Detran Sulfate | Sigma | D8906 | |
SDS | Sigma | L3771 | |
Salmon Sperm DNA | Life Technologies | 15632-011 | |
Bovine Serum Albumin (BSA) | Sigma | A8531 | |
HCl (N) | Sigma | 38283 | |
Ethyl Alcohol | Sigma | 459844 | |
Methanol | Sigma | 322415 | |
DPBS | Life Technologies | 14190-250 | |
NaOH | Sigma | S8045 | |
Rnase A | Sigma | R4642 | |
Pepsin | Sigma | P6887 | |
Paraformaldehyde (PFA) | Sigma | P6148 | |
Hoechst-33342 | Thermo Scientific | 62249 | Dissolve Hoechst-33342 in PBS to final concentration of 1 mg/mL. |
Rubber Cement/Cytobond Sealant | 2020-00-1 | ||
Seven Coplin Jars | Thermo Scientific | 107 | |
Dark Humidified chamber | Sigma | CLS2551 | |
Cover slides | VWR | 48366067 | |
Dry Digital Heat Block | VWR | 13259 | |
Fluorescence Microscope | |||
20X Saline-Sodium Citrate (20X SSC) | Combine 175 g of NaCl, and 88.2 g of trisodium citrate with 800 mL of molecular grade H2O. Stir while adjusting to pH 7. Once the all salts dissolve, adjust the volume to 1 L and filter through 0.22 µm Filter paper. Store at 4 °C. | ||
1mg/mL of Rnase A | Dilute 20X SSC buffer to 2X SSC buffer. Dissolve RNase A in 2X SSC buffer to a final concentration of 1 mg/mL. Make fresh solution every time. | ||
1% Pepsin | Dissolve pepsin (W/V) in 10 mM HCl to a final concentration of 1 % solution. Make fresh every time. | ||
4% Paraformaldehyde (4% PFA) | Weigh 4.0 g of PFA in fume hood, add 50 mL of 1xPBS, heat to 60 °C while stirring and adjust the pH with drops of NaOH until all PFA dissolves and the solution becomes clear. Adjust the volume to 100 mL, filter through 0.22 µm Filter paper and store 5 mL aliquots at -20 °C. Thaw aliquot of PFA at 37 °C for 10-15 min for subsequent uses. Adjust filter size depending on amount of paraformaldehyde. | ||
Wash Buffer | Combine 100 mL of Formamide (20%) with 2.5 mL of 20X SSC, adjust to pH 7 with 1.0 M HCl and bring the volume to 500 mL with molecular grade H2O. | ||
Hybridization Buffer | Combine 50% formamide, 10% dextran sulfate, 0.1% SDS, and 300 ng/mL Salmon Sperm DNA in 2X SSC buffer. Amount of Formamide determine how focused chromatids are, titrate the amount | ||
Detection Buffer | Dilute 20X SSC buffer to 4X and add 0.2% Tween-20 to make detection buffer. | ||
Blocking Buffer | Combine 5% bovine serum albumin (BSA) with 0.2% Tween-20 in 4X SSC buffer. | ||
Dehydrating Solution | Make 70%, 80%, and 95% ethanol solutions. |