Here, we describe a complete workflow for the qualitative and quantitative analysis of immune synapses between primary human T cells and antigen-presenting cells. The method is based on imaging flow cytometry, which allows the acquisition and evaluation of several thousand cell images within a relatively short period of time.
Method Article
Qualitative and Quantitative Analysis of the Immune Synapse in the Human System Using Imaging Flow Cytometry
In This Article
Summary
Abstract
The immune synapse is the area of communication between T cells and antigen-presenting cells (APCs). T cells polarize surface receptors and proteins towards the immune synapse to assure a stable binding and signal exchange. Classical confocal, TIRF, or super-resolution microscopy have been used to study the immune synapse. Since these methods require manual image acquisition and time-consuming quantification, the imaging of rare events is challenging. Here, we describe a workflow that enables the morphological analysis of tens of thousands of cells. Immune synapses are induced between primary human T cells in pan-leukocyte preparations and Staphylococcus aureus enterotoxin B (SEB)-loaded Raji cells as APCs. Image acquisition is performed with imaging flow cytometry, also called In-Flow microscopy, which combines features of a flow cytometer and a fluorescence microscope. A complete gating strategy for identifying T cell/APC couples and analyzing the immune synapses is provided. As this workflow allows the analysis of immune synapses in unpurified pan-leukocyte preparations and hence requires only a small volume of blood (i.e., 1 mL), it can be applied to samples from patients. Importantly, several samples can be prepared, measured, and analyzed in parallel.
Introduction
T cells are major regulators of the adaptive immune system and are activated through antigenic peptides that are presented in the context of major histocompatibility complexes (MHC). Full T-cell activation requires two signals, the competence signal via the antigen-specific T-cell receptor (TCR)/CD3 complex and the costimulatory signal via accessory receptors. Both signals are generated through the direct interaction of T cells with antigen-presenting cells (APCs). Mature APCs provide the competence signal for T-cell activation through MHC-peptide complexes, and they express costimulatory ligands (e.g., CD80 or CD86) to assure the progression of T-cell activation1. One important function of costimulation is the rearrangement of the actin cytoskeleton2,3,4. The cortical F-actin is relatively static in resting T cells. T-cell stimulation through antigen-bearing APCs leads to a profound rearrangement of the actin cytoskeleton. Actin dynamics (i.e., fast actin polymerization/depolymerization circles) enable the T cells to create forces that are used to transport proteins or organelles, for example. Moreover, the actin cytoskeleton is important for developing a special contact zone between T cells and APCs, called the immune synapse. Due to the importance of the actin cytoskeleton to the immune synapse, it has become essential to develop methods to quantify changes in the actin cytoskeleton of T cells5,6,7,8,9.
By means of actin cytoskeletal aid, surface receptors and signaling proteins are segregated in supramolecular activation clusters (SMACs) within the immune synapse. The stability of the immune synapse is assured by the binding of receptors to F-actin bundles that increase the elasticity of the actin cytoskeleton. Immune synapse formation has been shown to be critical for the generation of the adaptive immune responses. The detrimental effects of a defective immune synapse formation in vivo were first realized in patients suffering from Wiskott Aldrich Syndrome (WAS), a disease in which actin polymerization and, concomitantly, immune synapse formation are disturbed10. WAS patients can suffer from eczema, severe recurrent infections, autoimmune diseases, and melanomas. Despite this finding, it is currently not known whether immune synapse formation differs in the T cells of healthy individuals and patients suffering from immune defects or autoimmune diseases.
Fluorescence microscopy, including confocal, TIRF, and super-resolution microscopy, were used to uncover the architecture of the immune synapse11,12,13,14. The high resolution of these systems and the possibility of performing live-cell imaging enables the collection of exact, spatio-temporal information about the actin cytoskeleton and surface or intracellular proteins in the immune synapse. Many results, however, are based on the analysis of only a few tens of T cells. Moreover, T cells must be purified for these types of fluorescence microscopy. However, for many research questions, the use of unpurified cells rather than the highest-possible resolution is of the utmost importance. This is relevant if T cells from patients are analyzed, since the amount of donated blood is limited and there might be the need to process many samples in parallel.
We established microscopic methods that allow the analysis of the actin cytoskeleton in the immune synapse in the human system15,16,17. These methods are based on imaging flow cytometry, also called In-Flow microscopy18. As a hybrid between multispectral flow cytometry and fluorescence microscopy, imaging flow cytometry has its strengths in analyzing morphological parameters and protein localization in heterogeneous cell populations, such as pan-leukocytes from the peripheral blood. We introduced a methodology that enables us to quantify F-actin in T-cell/APC conjugates of human T cells from whole-blood samples, without the need of time-consuming and costly purification steps17. The technique presented here comprises the whole workflow, from getting the blood sample to the quantification of F-actin in the immune synapse.
Protocol
1. Preparation of Pan-leukocytes
- Draw 1 mL of peripheral blood from a healthy donor (or patient) in a heparinized syringe. Make sure to have approval by the responsible ethics committee for the blood donation.
- Mix 1 mL of human peripheral blood with 30 mL of ACK lysis buffer (150 mM NH4Cl, 1 mM KHCO3, and 0.1 mM EDTA, pH 7.0) in a 50 mL tube and incubate for 8 min at room temperature.
- Fill the tubes with PBS and centrifuge at 300 x g for 6 min. Aspirate the supernatant and resuspend the pellet in 30 mL of ACK lysis buffer.
- Repeat steps 1.2 and 1.3 until the supernatant is clear. Finally, wash the cells in PBS, centrifuge at 300 x g for 6 min at room temperature, and resuspend the cell pellet in 2 mL of culture medium (RPMI1640 + 10% FCS). Incubate the cells at 37 °C for 60 min.
2. Loading of Raji Cells with SEB
- Prepare two 15 mL Falcon tubes with 1.5 x 10⁶ Raji cells per tube. Spin down the cells (300 x g for 6 min at room temperature) and discard the supernatant.
- Resuspend the cells in residual medium (about 50–100 µL), add 1.9 µL (1.9 µG) SEB, and incubate at room temperature for 15 min. Add 5 mL of culture medium, spin down the cells (300 x g for 6 min at room temperature), and resuspend the pellet in culture medium (RPMI1640 + 10% FCS) at a density of 1 x 10⁶ cells/mL.
3. Induction of Immune Synapses and Staining Protocol
- Pipette 500 µL of the preparation of SEB-loaded Raji cells into a FACS tube and 500 µL of the preparation of unloaded Raji cells into another FACS tube. Add 650 µL of pan-leukocytes to each tube and spin down the cells (300 x g for 10 min at room temperature). Discard the supernatant and resuspend the pellet in 150 µL of culture medium (RPMI1640 + 10% FCS). Incubate at 37 °C (typically for 45 min).
- Gently vortex the cells (10 s at 1,000 rpm) and add 1.5 mL of paraformaldehyde (1.5%) during the vortex to fix the cells. Stop the fixation by adding 1 mL of PBS + 1% BSA. Pellet the cells (300 x g for 10 min at room temperature and resuspension the cell pellet in 1 mL of PBS + 1% BSA after incubating at room temperature for 10 min.
- Pellet (300 x g for 10 min at room temperature) and resuspend the cells in 100 µL of PBS + 1% BSA + 0.1% saponin for 15 min at room temperature to permeabilize the cells (96-well plate, U-shaped).
- Wash the cells in PBS + 1% BSA + 0.1% saponin with centrifugation (300 x g for 10min at room temperature) and resuspend the cell pellet in 50 µL of PBS + 1% BSA + 0.1% saponin containing fluorophore-labelled antibodies or compounds (CD3-PE-TxRed (1:30), Phalloidin-AF647 (1:150), and DAPI (1:3,000)).
- Incubate the cells at room temperature in the dark for 30 min. Wash the cells 3 times by adding 1 mL of PBS + 1% BSA + 0.1% saponin. Centrifuge at 300 x g for 10 min at room temperature. Re-resuspend the cells in 60 µL of PBS for imaging flow cytometry.
4. Image Acquisition Using a Flow Cytometer
NOTE: The following image acquisition procedure and data analysis are based on imaging flow cytometry using software such as imagestream (IS100), INSPIRE, and IDEAS. However, other flow cytometers and analysis software can also be used.
- Open the analysis software on the computer connected to the imaging flow cytometer and click on Initialize Fluidics of the Instrument menu. Apply the beads on the right port when prompted to do so.
- Load the default template from the File menu and click on Run/Setup. Choose Beads from the View dropdown menu.
- Adjust the bright-field illuminator by clicking on Set Intensity if the indicated value is below 200.
- Run the calibration and test routine in the Assist tab by clicking on Start All.
- Click on Flush/Lock/Load and apply the samples in the left port when prompted to do so. After loading the cells in the flow cytometer, open the Cell Classifier and adjust the values as follows: peak intensity upper limit at 1,022 for each channel, peak intensity lower limit at 50 for channel 2 (DAPI) and channel 5 (CD3-Pe-TxR), area lower limit at 50 for channel 1 (side scatter), and upper limit at 1,500.
- Change the excitation laser power to 405 nm (15 mW), 488 nm (200 mW), and 647 nm (90 mW) in the Setup tab.
- Switch the View dropdown menu between Cells and Beads to evaluate the cell classifier and laser power adjustments.
NOTE: Make sure that all cells and cell couples are found the Cell View and that cell clumps, debris, and images with saturated pixels are found in the Debris View by changing the cell classifiers and/or the excitation laser powers. - Define the sample name and the amount of images to acquire (15,000–25,000 for samples and 500 for compensation controls) in the Setup tab. Click on Run/Setup to start the acquisition.
5. Data analysis
- Transfer the raw image files (.rif) to the data analysis computer and open the analysis software.
- Produce a compensation matrix following the instructions of the Compensation dropdown. Save the compensation matrix as comp_Date.ctm.
- Open a sample raw image file (.rif) and apply the comp_Date.ctm in the window that appears to produce the compensated image files (.cif) and the default data analysis file (.daf).
- Open the compensated image file. Convert the images to color mode and adjust the lookup tables to obtain optimal visible colors in the Image Gallery Properties toolbar. Obtain an RGB-merged image using the Composite tab of the Image Gallery Properties toolbar.
- Open the Mask Manager from the Analysis dropdown. Create masks to define the T cells and the immune synapse, as follows:
- Select the T-cell mask: "(Fill(Threshold_Ch05, 60)." Select the valley mask: "Valley(Ch02,3)." Select the T-cell synapse mask: "T-cell mask AND Valley(M02,Ch02, 3)."
- Open the Feature Manager from the Analysis dropdown. Calculate the following features:
- For the total CD3 expression in T cells, select "Intensity_T-cells_Ch5." For the total amount of F-actin in the T cells, select "Intensity_T-cells_Ch6." For CD3 expression in the immune synapse, select "Intensity_T-cell synapse_Ch5." For the amount of F-actin in the immune synapse, select "Intensity_T-cell synapse_Ch6."
- To calculate the T-cell area, select "Area_T-cells." To calculate the T-cell immune synapse area, select "Area_T-cell synapse."
- Determine the F-actin and CD3 enrichment in the immune synapse by using the equation in the Feature Manager:
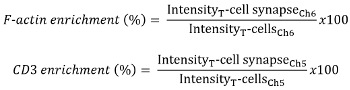
- Apply the following gating strategy by using histograms and dot plots from the Analysis area (for further details, see References 17 and 19):
- Discard out-of-focus cells by plotting the "Gradient RMS_M2_Ch2" in a histogram; set the threshold at 15.
- Plot the SSC versus CD3 intensity in a dot plot. Set a gate on CD3-positive events.
- Plot the "Aspect ratio" of M02 (DAPI stain) versus the area of M02 (Dapi stain). Gate on T-cell singlets and cell couples accordingly. Correct for true cell couples using the area of the synapse mask, as described previously17,19.
- Determine the amount of F-actin in T-cell singlets and T cells of T-cell/APC couples and the percent of F-actin in the immune synapse.
Results
A major goal of the method described here is the quantification of protein enrichment (e.g., F-actin) in the immune synapse between surrogate APCs (Raji cells) and T cells in unpurified pan-leukocytes taken from low-volume (1 mL) human blood samples. The screenshot in Figure 1 gives an overview of the critical gating strategy of this method. It shows the image gallery on the left and the analysis area on the right (Figure 1). The image gallery shows the "In Focus" gate. The depicted images are mainly granulocytes and two T-cell/APC couples. F-actin and CD3 are enriched in cell couple number 30272. The gating strategy to quantify the amount of cell couples with such enrichment is shown in the analysis area and is described in the protocol (see step 5.8) or elsewhere17,19. The last dot plot in the analysis area displays the amount (percent protein) of CD3 (x-axis) and F-actin (y-axis) in the immune synapse. If more than 30% of the protein was located within the immune synapse mask, it was considered as protein enrichment in the immune synapse20. Dot plots containing enrichment data were used to produce a typical final result (Figure 2A). The imagery on the left shows sample images of T-cell/APC conjugates, with low amounts of CD3 and F-actin in the immune synapse, whereas on the right, T-cell/APC conjugates are depicted with a strong enrichment of CD3 and F-actin. The amount of CD3 at the immune synapse (percent protein) is plotted on the x-axis, and the amount of F-actin at the immune synapse is plotted on the y-axis. The percentage in the gate represents the amount of T cells that have an enrichment of CD3 and F-actin at the immune synapse in the presence of a superantigen. In the absence of superantigen, 15% percent of the T cells showed an enrichment at the immune synapse of both CD3 and F-actin. The amount of cells increased to 29% in the presence of superantigen. A single quantification of CD3 enrichment (Figure 2B) or F-actin enrichment (Figure 2C) is shown in the presence and absence of superantigen. These results show that, in the absence of superantigen, 18.3 ± 3.5% and, in the presence of superantigen, 34.3 ± 4.0% of the total F-actin amount in the cells were accumulated at the immune synapse. Interestingly, there was already CD3 accumulation in the absence of superantigen (16.6 ± 2.1% of the total CD3 amount), which was significantly increased by the addition of superantigen (24.6 ± 3.0% of the total CD3 amount). This method allows the quantification of how much protein is accumulated at the immune synapse between T cells and APCs.
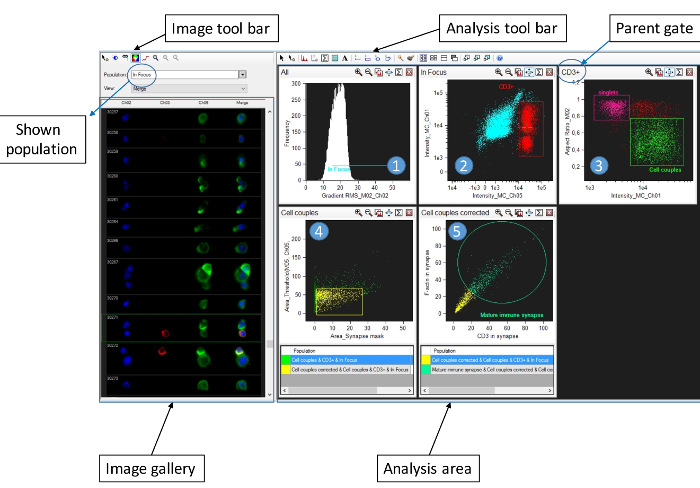
Figure 1: Gating strategy for the identification of immune synapses in pan-leukocyte preparations. The figure shows a screenshot of the software and contains a complete analysis workflow for the evaluation of CD3 and F-actin enrichment in the immune synapse of T cells conjugated to APCs in the presence of SEB. Images are displayed in the image gallery on the left (Ch2 = DAPI; Ch5 = CD3-PETxR; CH6 = Phalloidin AF647; and Merge = Combined image containing Ch2, Ch5, and Ch6). The software provides an image display toolbar to adjust for lookup tables, mask display, and color/grayscale mode. The right portion of the screenshot shows the analysis area and analysis toolbar. The analysis area contains histograms and dot plots as follows: 1) Histogram to find cells in focus according to the gradient RMS feature of the DAPI staining. 2) Gating on T cells according to the expression of CD3 (Intensity_MC_Ch05, x-axis) and the side scatter profile (Intensity_MC_Ch01, y-axis). 3) Gating on potential T-cell/APC couples according to the aspect ratio of the DAPI stain (Aspect ratio_M02, y-axis) and the side scatter profile (Intensity_MC_Ch01, x-axis). 4) Gating on true T-cell/APC couples according to the area synapse mask (x-axis) and the area of the CD3 stain (y-axis). 5) Gating on mature immune synapses defined by enrichment (>30% protein content in the interface) of CD3 (x-axis) and F-actin (y-axis) in the immune synapse. Please click here to view a larger version of this figure.
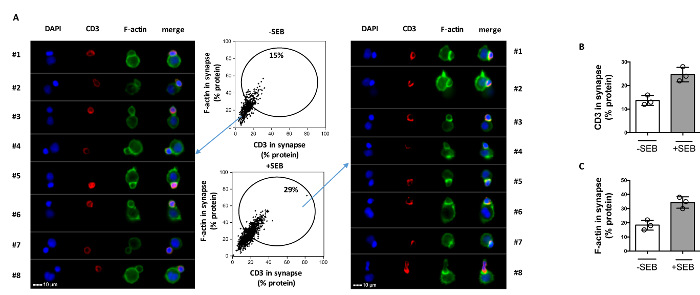
Figure 2: Imaging flow cytometry data on CD3 and F-actin enrichment in the immune synapse. (A) The dot plots in the center show the percentage of CD3 (x-axis) and F-actin (y-axis) in the immune synapse. T-cell/APC conjugates with a mature immune synapse in the absence (upper part) or presence (lower part) of SEB are depicted. The images on the left show T-cell/APC couples with a low degree of CD3 and F-actin enrichment, whereas the images on the right display T-cell/APC couple with a high degree of CD3 and F-actin enrichment (mature immune synapse). Scale bar = 10 µm (lower left). The result is representative of three independent experiments. (B-C) Mean CD3 (B) or F-actin (C) enrichment in the immune synapse in the presence or absence of SEB is shown as percent protein (n = 3; SE). Please click here to view a larger version of this figure.
Discussion
The workflow presented here enables the quantification of immune synapses between human T cells (ex vivo) and APCs. Notably, erythrocyte-lysed pan-leukocytes were used as T-cell sources, making T-cell purification steps dispensable. The B-cell lymphoma cell line Raji served as surrogate APCs. This bears significant advantages, since it allows comparisons between blood donors of the T-cell side of the immune synapse. Furthermore, autologous DCs are hardly available directly from peripheral human blood. The production of monocyte-derived dendritic cells (moDCs) takes several days, making the application to clinical studies challenging. However, imaging flow cytometry and the analysis strategy presented here can be applied to other APCs (e.g., transdifferentiated neutrophils)20. Moreover, it was demonstrated that the immune synapse between CD4 T cells and ex vivo DCs9 or B cells21 can be assessed for mice using imaging flow cytometry. Thus, this method can be broadened to assess APC function in addition to the T-cell side of the immune synapse.
The most critical steps of this methodology are mixing the pan-leukocytes and APCs in a small volume and performing the correct gating strategy to exclude false-positive events while at the same time minimizing the loss of true immune synapses. While we describe the measurement of CD3 and F-actin accumulation, this method is not restricted to these proteins and can be expanded to other surface receptors, such as LFA-117,19. Moreover, the addition of fluorophore-labelled antibodies to identify T-cell subgroups (e.g., CD4, CD8, CD45RA, or chemokine receptors) would allow for the exploration of the nature of T cells displaying a certain immune synapse phenotype. Importantly, the amount of blood that is necessary for such an analysis is low (maximum: 1 mL). While the first generation of imaging flow cytometers, as used here (IS100), have an image acquisition rate of about 100 cells/s, the third generation of imaging flow cytometers (IsXMKII) allows much higher image acquisition rates (up to 2,000 cells/s using a 40x objective). Thus, the actual workflow, from drawing the blood to data analysis, requires a considerably short time period (i.e., one day). Notably, while the presented image analysis is based on imaging flow cytometry, cell preparation and the induction of immune synapses (i.e., the first part of the workflow) can be applied to other imaging techniques22.
In contrast to flow cytometry, imaging flow cytometry-obtained dot plots contain information about protein localization in addition to protein expression data. One strength of imaging flow cytometry is that cells (or cell couples) of any selected gate can be evaluated by eye; the gate boundaries can be adjusted accordingly, simply by clicking on the dots and inspecting the corresponding image. In our experiments, we found that 30% protein enrichment is a reliable value to consider the respective cell couple as having the protein of interest enriched. Once the gates are finally set, the features and gating strategy are saved in a separate file (.ast) and can be applied to each following sample to assure an unbiased evaluation.
The weaknesses of imaging flow cytometry are the limitation in resolution (0.5 µm using a 40x objective) and the fact that only one focus plane can be analyzed. Therefore, this method is not suitable to analyze the fine structure of the immune synapse and the occurrence of microclusters14. To analyze such architecture-related aspects of the immune synapse, alternate techniques, such as confocal, TIRF, or super-resolution microscopy, are needed. The strength of imaging flow cytometry is the amount of images that can be acquired per sample (up to 25,000). Notably, each image is segmented, which means that the background is knocked out, and there is usually only one solitary cell or cell couple per image. These characteristics of imaging flow cytometry form the basis for automated analysis at the single-cell level. Moreover, the high amount of cells that are analyzed per sample allow for the reliable identification of rare events (i.e., subpopulations or cell couples with a frequency below 1%). Importantly, the workflow presented here can be applied to the study of immune synapse formation in ex vivo T-cells in pan-leukocytes from patients suffering from immune-related diseases (e.g., primary immunodeficiency disorders).
Disclosures
The authors have nothing to disclose.
Acknowledgements
The work was funded by the German research council (DFG) with grants No. SFB-938-M and SA 393/3-4.
Materials
| Name | Company | Catalog Number | Comments |
|---|---|---|---|
| >Multifuge 3 SR | Heraeus | ||
| RPMI 1640 | LifeTechnologies | #11875085 | 500 mL |
| FCS | Pan Biotech#3302-P101102 | ||
| Polystyrene Round Bottom Tube | Falcon | #352054 | 5 mL |
| Kulturflasche | Thermo Scientific | #178883 | |
| Dulbecco's Phosphate Buffered Saline | Sigma | D8662 | |
| Bovine Serum Albumin | Roth | #8076.3 | |
| Saponin | Sigma | S7900 | |
| Paraformaldehyde | Sigma Aldrich | #16005 | |
| FACS Wash Saponin | PBS 1% BSA 0.15 Saponin | ||
| ReaktiosgefaB | Sarstedt | 72.699.002 | 0.5 mL |
| Speed Bead | Amnis | #400041 | |
| Minishaker MS1 | IKA Works | MS1 | |
| Mikrotiterplatte | Greiner Bio One | #650101 | 96U |
| Enterotoxin SEB | Sigma Aldrich | S4881 | |
| DAPI | Sigma Aldrich | D9542 | 1:3000 |
| CD3-PeTxR | Invitrogen | MHCD0317 | 1:30 |
| Phalloidin-AF647 | Molecular Probes | A22287 | 1:150 |
| IS100 | Amnis | Imaging flow cytometer | |
| IDEAS | Amnis | Software | |
| INSPIRE | Amnis | Software |
References
- Esensten, J. H., Helou, Y. A., Chopra, G., Weiss, A., Bluestone, J. A. CD28 Costimulation: From Mechanism to Therapy. Immunity. 44 (5), 973-988 (2016).
- Samstag, Y., Eibert, S. M., Klemke, M., Wabnitz, G. H. Actin cytoskeletal dynamics in T lymphocyte activation and migration. Journal of leukocyte biology. 73 (1), 30-48 (2003).
- Samstag, Y., John, I., Wabnitz, G. H. Cofilin: a redox sensitive mediator of actin dynamics during T-cell activation and migration. Immunol Rev. 256 (1), 30-47 (2013).
- Comrie, W. A., Burkhardt, J. K. Action and Traction: Cytoskeletal Control of Receptor Triggering at the Immunological Synapse. Front Immunol. 7, 68(2016).
- Piragyte, I., Jun, C. D. Actin engine in immunological synapse. Immune Netw. 12 (3), 71-83 (2012).
- Rossy, J., Pageon, S. V., Davis, D. M., Gaus, K. Super-resolution microscopy of the immunological synapse. Curr Opin Immunol. 25 (3), 307-312 (2013).
- Mace, E. M., Orange, J. S. Visualization of the immunological synapse by dual color time-gated stimulated emission depletion (STED) nanoscopy. J Vis Exp. (85), (2014).
- Comrie, W. A., Babich, A., Burkhardt, J. K. F-actin flow drives affinity maturation and spatial organization of LFA-1 at the immunological synapse. J Cell Biol. 208 (4), 475-491 (2015).
- Markey, K. A., Gartlan, K. H., Kuns, R. D., MacDonald, K. P., Hill, G. R. Imaging the immunological synapse between dendritic cells and T cells. J Immunol Methods. 423, 40-44 (2015).
- Bouma, G., Burns, S. O., Thrasher, A. J. Wiskott-Aldrich Syndrome: Immunodeficiency resulting from defective cell migration and impaired immunostimulatory activation. Immunobiology. 214 (9-10), 778-790 (2009).
- Grakoui, A., et al. The immunological synapse: a molecular machine controlling T cell activation. Science. 285 (5425), 221-227 (1999).
- Dustin, M. L., Depoil, D. New insights into the T cell synapse from single molecule techniques. Nature reviews. Immunology. 11 (10), 672-684 (2011).
- Mace, E. M., Orange, J. S. New views of the human NK cell immunological synapse: recent advances enabled by super- and high-resolution imaging techniques. Front Immunol. 3, 421(2012).
- Yokosuka, T., et al. Newly generated T cell receptor microclusters initiate and sustain T cell activation by recruitment of Zap70 and SLP-76. Nat Immunol. 6 (12), 1253-1262 (2005).
- Wabnitz, G. H., et al. Sustained LFA-1 cluster formation in the immune synapse requires the combined activities of L-plastin and calmodulin. European journal of immunology. 40 (9), 2437-2449 (2010).
- Wabnitz, G. H., et al. L-plastin phosphorylation: a novel target for the immunosuppressive drug dexamethasone in primary human T cells. Eur J Immunol. 41 (11), 3157-3169 (2011).
- Wabnitz, G. H., Nessmann, A., Kirchgessner, H., Samstag, Y. InFlow microscopy of human leukocytes: A tool for quantitative analysis of actin rearrangements in the immune synapse. J Immunol Methods. , (2015).
- Basiji, D., O'Gorman, M. R. Imaging flow cytometry. J Immunol Methods. 423, 1-2 (2015).
- Wabnitz, G. H., Samstag, Y. Multiparametric Characterization of Human T-Cell Immune Synapses by InFlow Microscopy. Methods Mol Biol. 1389, 155-166 (2016).
- Balta, E., et al. Qualitative and quantitative analysis of PMN/T-cell interactions by InFlow and super-resolution microscopy. Methods. , (2016).
- Hochweller, K., et al. Dendritic cells control T cell tonic signaling required for responsiveness to foreign antigen. Proceedings of the National Academy of Sciences of the United States of America. 107 (13), 5931-5936 (2010).
- Balagopalan, L., Sherman, E., Barr, V. A., Samelson, L. E. Imaging techniques for assaying lymphocyte activation in action. Nat Rev Immunol. 11 (1), 21-33 (2011).
Reprints and Permissions
