A flow-through device for using the biodeposition method to quantify filtration and feeding behavior of bivalve mollusks was modified for shipboard use. A two-dimensional gimbal table built around the device isolates the apparatus from boat motion, thereby allowing the accurate quantification of bivalve filtration variables at offshore shellfish aquaculture sites.
Method Article
Design and Use of an Apparatus for Quantifying Bivalve Suspension Feeding at Sea
In This Article
Summary
Abstract
As shellfish aquaculture moves from coastal embayments and estuaries to offshore locations, the need to quantify ecosystem interactions of farmed bivalves (i.e., mussels, oysters, and clams) presents new challenges. Quantitative data on the feeding behavior of suspension-feeding mollusks is necessary to determine important ecosystem interactions of offshore shellfish farms, including their carrying capacity, the competition with the zooplankton community, the availability of trophic resources at different depths, and the deposition to the benthos. The biodeposition method is used to quantify feeding variables in suspension-feeding bivalves in a natural setting and represents a more realistic proxy than laboratory experiments. This method, however, relies upon a stable platform to satisfy the requirements that water flow rates supplied to the shellfish remain constant and the bivalves are undisturbed. A flow-through device and process for using the biodeposition method to quantify the feeding of bivalve mollusks were modified from a land-based format for shipboard use by building a two-dimensional gimbal table around the device. Planimeter data reveal a minimal pitch and yaw of the chambers containing the test shellfish despite boat motion, the flow rates within the chambers remain constant, and operators are able to collect the biodeposits (feces and pseudofeces) with sufficient consistency to obtain accurate measurements of the bivalve clearance, filtration, selection, ingestion, rejection, and absorption at offshore shellfish aquaculture sites.
Introduction
Wild-capture fisheries are declining worldwide1. Accordingly, the future growth in seafood supply must come from an expansion of aquaculture. The aquaculture production of seafood has been growing and will continue to grow rapidly through 2025, making aquatic farming the most rapidly increasing food production system2. The farming of suspension-feeding bivalve mollusks (mussels, oysters, scallops, and clams) is considered to be among the most environmentally benign forms of aquaculture, because these organisms require no additional feeding but, instead, obtain nutrition from the natural phytoplankton production and transfer organic matter to benthic organisms3,4. Indeed, shellfish aquaculture is being considered as a legitimate tool to improve the water quality and trophic structure in eutrophic estuaries5,6. Despite the generally favorable prospects for the expansion of shellfish aquaculture in coastal embayments and estuaries, conflicts with other coastal ocean interests such as commercial and recreational fisheries, recreational activities, and the aesthetic desires of coastal landowners-societal limitations aggregated under the term "social carrying capacity"-have led some to look to the "open ocean" for the large-scale expansion of shellfish farming7.
Moving shellfish farming offshore, in open waters, offers great potential for shellfish aquaculture expansion but also presents unprecedented challenges to the organisms in the oceanic ecosystem8. First, most farmed, suspension-feeding bivalve species are estuarine organisms that have evolved in environments that differ in many ways from the open ocean ecosystem9. Seasonal and diurnal temporal variations in salinity, temperature, and water chemistry, and the intense biological activity stimulated by the high and variable nutrient availability in coastal waters have selected for behavioral and physiological characteristics in mussels, oysters, scallops, and clams that may confer little benefit in the relatively constant, dilute ocean environment10. Bivalves are known to respond to these environmental changes by regulating their filtration to take advantage of periods of good water quality and to optimize their food acquisition11,12. In a more constant environment, such as open waters, it is unclear if bivalves will regulate their pumping and filtration rates effectively to maintain a positive energy balance for rapid growth. The second challenge facing offshore shellfish farming is also related to the relatively-low seston food availability in the ocean. With phytoplankton densities being much lower offshore than in estuaries, will the bivalve species currently farmed successfully in estuaries find enough to eat to maintain both metabolism and growth? Current practices employing lines, socks, cages, or other enclosures to hold shellfish in estuaries result in three-dimensional filters that may deplete phytoplankton locally even in eutrophic, coastal waters13,14. Assumptions about culture gear design, stocking density, the spacing of lines, and crop cycle time may need to be rethought in the open ocean to manage both the production carrying capacity of the farm and the ecological carrying capacity of the local marine ecosystem15,16. Intensive shellfish farming as practiced nearshore may need to be modified to be compatible with the dilute environment of the ocean.
To advance our understanding of how coastal shellfish farming practices may need to be modified to succeed offshore, quantitative data on how shellfish interact with the seston present in offshore locations proposed as potential farm sites are essential. A number of techniques for the quantifying filtration, clearance, ingestion, rejection, and absorption of particles by suspension-feeding bivalve mollusks have been developed17,18. Some of these methods have been optimized to detect variations on very short timescales, the selection between different particle types, or physiological responses to various environmental variations19,20,21. Recently, refinements of what is termed the biodeposition method have led to the acceptance of this approach as a legitimate tool to quantify most of the important filtration and feeding variables in mussels, oysters, and clams17,22.
The biodeposition method, in general, uses a mass-balance approach, with the inorganic seston component as a tracer, to quantify the partitioning by individual shellfish of organic and inorganic seston components into proportions captured, rejected, ingested, and absorbed over a timescale of hours17. For this approach to be accurate, it is critically important that the water flow rates delivered to individual shellfish are constant and precisely known and that the shellfish are not disturbed physically so that they maintain their constant filtration behavior. It is also necessary to synchronize the collection of water samples at the time of the bivalve ingestion with the collection of feces samples produced after digestion (i.e., egestion). These two processes (ingestion and egestion) are offset by the length of time it takes for a particulate matter to transit through the bivalve gut. The gut transit time represents the time elapsed between the ingestion of food and the release of undigested material in the form of feces. Further, from a practical standpoint, biodeposits need to be collected quantitatively by the researcher before they are disaggregated by water motion. For these reasons, apparatus and procedures for quantifying bivalve filtration using the biodeposition method have been limited to very nearshore locations where a stable platform-dry land or a fixed pier-is near enough to the shellfish population being investigated. For the biodeposition method to be used offshore, it was necessary to find a way to satisfy the method requirements for a stable platform aboard a boat.
Centuries ago, mariners seeking to solve the same basic problem of how to isolate shipboard articles from the ship's motion developed the gimbal. A gimbal introduces one or more pivots between the platform attached to the ship and the article being isolated, allowing the isolated article to respond more to gravity than to the ship's motion. We employed perhaps the simplest gimbal design-pin pivots at 90° angles-in the design of an apparatus modified from the one reported by Galimany and co-workers22. In the present report, the effective function of the apparatus is validated by measuring: 1) the motion of the table with shellfish chambers compared to the boat motion, 2) the consistency of the flow rates through 20 replicate chambers while at sea, and 3) the filtration data from mussels tested at three offshore locations aboard three different vessels.
Protocol
1. Gimbal Table and Feeding Device
- Construct and assemble the gimbal table to consist of two frames, a gimbal table, and a ballast tank, as shown in Figure 1a.
- Build the outermost frame 130 cm long, 92 cm wide, and 90 cm tall using 0.65 cm polyvinyl chloride (PVC) stock. Use stainless-steel nuts and bolts to form the frame.
- Build the innermost frame (125 cm long and 80 cm wide) from 4 cm x 10 cm polyvinyl chloride (PVC) stock. Fit the heavily reinforced sections at the top of the short sides of the frame to receive the inner gimbal frame. Permanently fix stainless-steel pins to allow the inner frame to swing freely within the outer frame.
- Similarly, include reinforced sections on the long sides of the inner frame to accommodate stainless-steel pins mounted into the gimbal table, allowing it to swing freely.
- Stock the PVC cube with a removable ballast. Fill the ballast tank with 85 kg of seawater and insert a 50-kg zinc weight to the bottom of the ballast tank; it acts as a counterweight to dampen, but not restrict, the swing of the table.
NOTE: The ballast tank is attached to the gimbal table by stainless-steel nuts and bolts.
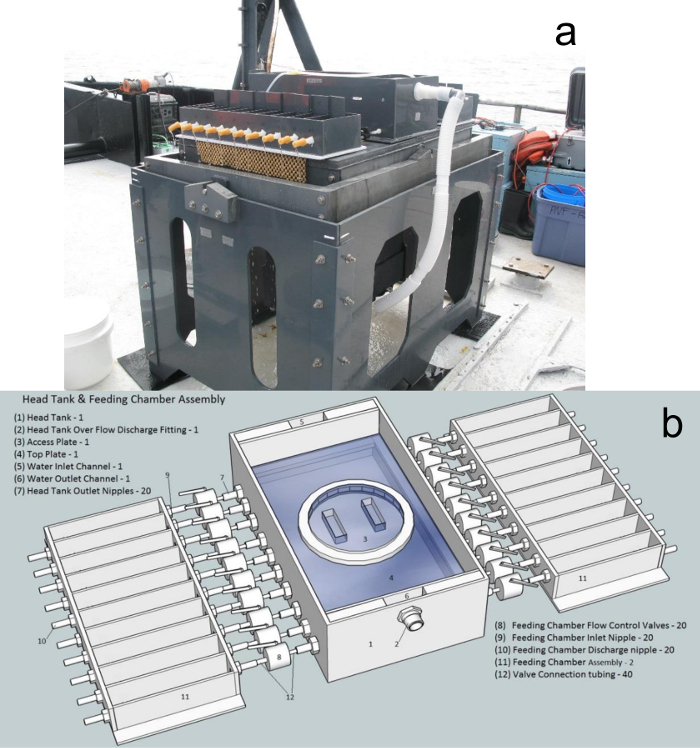
Figure 1: Gimbal table and feeding devices developed for quantifying bivalve suspension feeding using the biodeposition method aboard a boat. (a) This panel shows an image of the assembled gimbal table with the feeding device. (b) This panel shows a schematic of the assembled feeding device. Please click here to view a larger version of this figure.
- Construct and assemble the feeding device, which consists of a head tank and 2 sets of 10 feeding chambers (Figure 1b).
- Build the head tank using 6.5-mm PVC to be 70 cm in length x 30 cm in width x 12 cm in height (Figure 2a). Drill a 25-mm-diameter hole in the center of the left 30-cm side at 3 cm from the top.
- Drill 10 holes of 13 mm in diameter through each of the 70-cm PVC pieces of the rectangle so that the center of each hole is 2.5 cm from the base. Drill the first hole 40 mm from the side of the head tank; then, the centers of the consecutive holes are 69 mm apart from each other.
- Place plastic bulkhead connectors of 7 mm in inner diameter threaded in each hole to allow water to leave the head tank. Fit silicon tubing of 6.5 mm in inner diameter onto the connectors. In the middle of each tube, between the head tank and the feeding chambers, connect adjustable valves to the tubing to control the flow entering the feeding chambers.
NOTE: To ensure that the particles remain suspended in the head tank water and evenly distributed across the feeding chambers, add aeration throughout the tank using air stones or air tubing. - Inner measures of each feeding chamber are 17.5 cm in length x 6 cm in width x 6 cm in height (Figure 2b). Drill one 13-mm-diameter hole in the center of one of the 6-cm sides, so that the center of the hole is 15 mm from the bottom. On the opposite 6-cm side of each chamber, drill a 13-mm-diameter hole 45 mm from the bottom.
- Include a baffle inside each feeding chamber; the baffle is a PVC piece that is 3 cm in height and 6 cm wide and is to be placed 3.5 cm from the 6-cm side of the feeding chamber that has the hole drilled 15 mm from the bottom. Glue the baffle to the bottom of the chamber so that water flows over it.
- Include a second baffle piece that is movable, 50 mm long, and T-shaped piece (58 mm wide at the bottom of the T, at 15 mm from the top; it widens to a width of 72 mm). The shape allows the baffle to rest on top of the feeding chamber walls and for water to flow under the baffle in the chamber (Figure 2c). Place the movable baffle 1 - 2 cm in front of the bivalve, which forces the water flow directly onto the bivalve at the bottom of the chamber.
- Fit the head chamber and feeding device on top of the gimbal table and hold them in place with anti-skid mats. The system is designed in this modular manner to facilitate packing, moving, and storage.
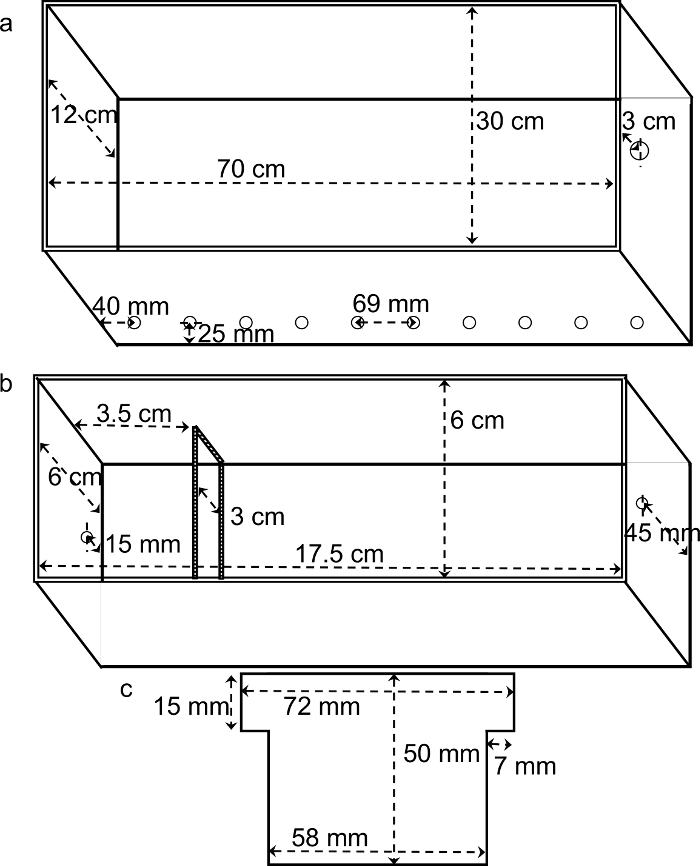
Figure 2: Detailed measurements of the head tank and feeding chambers. (a) This is a drawing of the head tank with detailed measurements. (b) This is a drawing of one feeding chamber with detailed measurements. The striped line indicates the location of the fixed baffle. (c) This is a drawing and the measurements of the movable baffle. Please click here to view a larger version of this figure.
2. Flow Calibration for Feeding Chambers
- To calibrate flow rates, place a 100-mL glass or plastic graduated cylinder at the exit of a feeding chamber. Immediately begin recording the time with a stopwatch.
- After 30 s, remove the graduated cylinder and check the volume of the water collected. Ideally, collect 100 mL of water, which equals a flow from the head tank to the feeding chambers of 12 L h-1.
NOTE: The flow rate of 12 L h-1 was determined by previous laboratory experiments to yield a homogenous distribution of particles between aquaria without water recirculation.- If the volume of water collected is not within 5 mL of the 100-mL target, adjust the flow by closing or opening the valve located between the head tank and the feeding chamber. Check the new flow rate again by collecting water for 30 s and repeat this step until the desired flow rate is obtained.
- Repeat the same calibration procedure for each feeding chamber, including the control chambers, before the beginning of the data collection.
3. Preparation of Filters for the Biodeposition Method
NOTE: The determination of total, organic, and inorganic particulate matter in water, pseudofeces, and feces is done using 25-mm-diameter GF/C glass fiber filters. Before the sample collection, ensure that the filters are washed, dried, burned, and preweighed. Always use flat-tip forceps to handle the filters during all processes. If a filter breaks or has a hole, discard it without using it.
- To wash the filters, first, add approximately 10 filters to a beaker with 200 mL of distilled water and stir them manually. After 15 s, note that the formerly clear water has white fibers in it; these are loose dust-like fiberglass released by the filters. Stop stirring.
- Decant the water in the beaker and add 200 mL of distilled water again. Wash the filters 3x in total. Repeat the washing process until enough filters are available to conduct a full feeding experiment, that is, about 48 filters for water filtration if the experiment lasts 2 h and water is collected every 15 min, and 32 filters for the feces and pseudofeces of 16 bivalves.
- Dry the filters at 60 °C for at least 1 h. Burn the dried filters in a muffle furnace at 450 °C for 4 h to remove any contaminating organic material. Remove the filters from the furnace, transfer them to a desiccator, and allow the filters to come to room temperature.
- Weigh the filters on an analytical balance and record the weights. Two possible methods for keeping track of the filter weights are as follows.
- Number each filter on the very edge, outside the area that will receive the sample during the filtration, using a soft pencil. Weigh the filter after numbering it, record its number and weight in a notebook, and store the filters after weighing them in their original filter box.
- Weigh each filter individually and then wrap it in a piece of muffled aluminum foil and record the corresponding weight on the foil. Store the wrapped filters until used in the field and write down the weight in a notebook after a sample is collected.
4. Gut Transit Time
- Place five bivalves individually in glass or plastic beakers filled with 300 mL of ambient, unfiltered seawater.
- Add 2 mL of Tetraselmis sp. monoculture to each beaker and record the time each individual bivalve opens, which is signaled by a shell gape.
NOTE: Tetraselmis sp. is used for the determination of the gut transit time because it is readily ingested by bivalve species, and the resulting feces are dark green in color, differentiating them from brown feces produced after the digestion of a natural plankton community. - Check each beaker every 3 - 5 min to ensure that the bivalves remain open and producing feces.
- Check that the feces are densely-packed, tight strings resulting from the digestive process of the bivalves (Figure 3) and maintain their structure when pipetted.
- Ensure that the collected deposits are feces and not pseudofeces (Figure 3), which, if produced, are produced immediately as a result of an excess of Tetraselmis sp; pseudofeces are lightly-packed, cloud-like deposits of non-ingested particles that quickly resuspend when collected with a pipette.
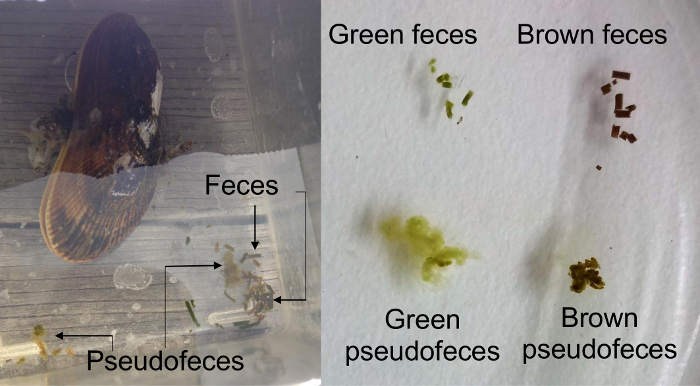
Figure 3: Illustration of the visual differences between bivalve feces and pseudofeces. The left panel shows a ribbed mussel (Geukensia demissa), with arrows indicating the produced feces and pseudofeces. The right panel shows in detail the green feces and pseudofeces produced after a filtration of Tetraselmis sp. monoculture, and the brown feces and pseudofeces produced after a filtration of a natural phytoplankton community. Please click here to view a larger version of this figure.
- When green feces appear, record the time for each individual bivalve. The length of time between the opening of the bivalve and its production of green feces is its gut transit time. Average the gut transit times of all five bivalve replicates to obtain the mean gut transit time to use in timing the offset between the collection of water samples and fecal samples.
NOTE: Use five replicates in case one or more bivalves fail to open or to produce feces. Ideally, the mean gut transit time will be based upon more than three replicates.
5. Sample collection
- Collect samples of water overflowing from the head tank, of water from the control chambers, which contain empty shells of the same bivalve species used in the experiments (two per side), and of feces and pseudofeces produced by each bivalve. Clean the bivalves of epibionts and other encrusting organisms to avoid filtration by other fauna before placing the bivalves in the feeding chambers.
NOTE: Bivalves placed in the feeding chambers may move around, so to facilitate the feces and pseudofeces collection, fix them in place within each chamber using fasteners (e.g, Velcro).- Collect 300 mL of water every 15 min for 2 h. Separately filter the overflow water and the water from the two sets of control chambers through preweighed filters (i.e., 3 filters per time point). Rinse the filters with ~5 mL of isotonic ammonium formate while the filters are still on the filtration manifold.
- Delay the onset of the biodeposit collection from the water collection by the length of the mean gut transit time that was determined as described in section 4 of the protocol. For example, if the mean gut transit time was 1 h, start the water collection as soon as the bivalves in the feeding chambers open. After 1 h, clear the chambers of all feces and pseudofeces that have been produced and, then, begin the collection of all subsequent feces and pseudofeces.
- Shade the bivalves in both the feeding chambers and the gut transit containers to increase the number of bivalves that open to feed.
- Collect the feces and pseudofeces separately with a glass pipette and keep the biodeposits in a separate container (flask or tube) for each bivalve throughout the 2-h collection period. Filter the biodeposits in each container individually onto a preweighed filter and rinse them with 5 mL of isotonic ammonium formate.
NOTE: At the end of the 2-h collection, there will be 16 containers with feces collected and 16 containers with pseudofeces collected, for a total of 32 containers to filter. - Store the filters in Petri dishes or in muffled aluminum foil for the transport to the laboratory. If muffled aluminum foil is used for the transport, first fold the filters in half, with the filter material on the inside of the fold, to prevent any loss of filtered material through contact with the foil. Store all filters in a cooler with ice.
- In the laboratory, dry all filters in the oven at 60 °C for at least 24 h.
- Reweigh each filter using an analytical balance. Subtract the initial weight from the final weight to determine the total particulate matter.
- Burn all filters in the muffle furnace at 450 °C for 4 h. Remove the filters from the furnace, transfer them to a desiccator, and allow the filters to come to room temperature. Weigh the filters again on an analytical balance. Subtract the burned filter weight from the dried filter weight to determine the particulate inorganic matter.
NOTE: The particulate organic matter is the difference between the total particulate matter and the particulate inorganic matter.
Results
The biodeposition method to quantify bivalve feeding is well established and provides a mechanism to obtain comprehensive data on the filtration and feeding performance of bivalves using natural seston in a field environment. Previous applications of the biodeposition method could be conducted only at shore-based locations because the method requires a steady platform. The study of bivalve filtration and feeding in off-shore waters requires ship-based measurements, and ships are not stable enough, under even the calmest conditions. We have designed and tested the addition of a gimbal table to existing filter-feeding apparatus, to create the steady platform required to properly use the biodeposition method.
Along with the stable platform for the bivalves to filter, we report data demonstrating an even particle distribution across individual chambers within the feeding apparatus (p = 0.997 from a generalization of Welch's test for 20% trimmed means23; Figure 4). This even distribution of the suspended matter indicates that the delivery of particles from the head tank to individual chambers is consistent; thus, all bivalves are exposed to the same food quantity and quality and can be considered true replicates.
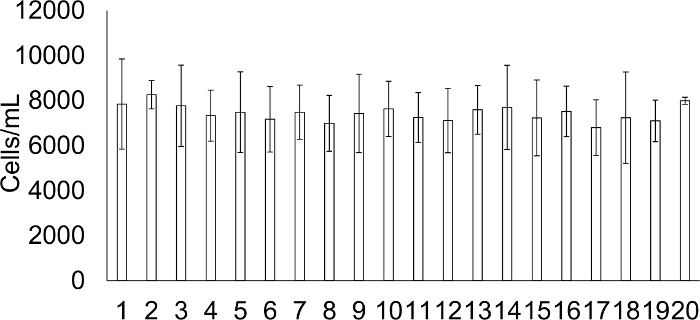
Figure 4: Average cell abundance in each feeding chamber during particle distribution tests of empty chambers. This panel shows the average number of phytoplankton cells/mL (± SD) in seawater collected from the exit tube of each feeding chamber (labeled 1 - 20) during quality assurance trials to ensure an even distribution of particles in the flow-through system. Please click here to view a larger version of this figure.
Four shipboard trials were conducted with three mussel species in three locations with very different seston quantity and composition (Figure 5). The different species studied can potentially be, or are currently being, farmed off-shore; we used multiple species to test the general applicability of the apparatus. Blue mussels (Mytilus edulis) were used in the first Connecticut (CT) experiment and in Massachusetts (MA). Ribbed mussels (Geukensia demissa) were used in the second CT experiment. Mediterranean mussels (Mytilus galloprovincialis) were used in the California (CA) experiment. Two experiments were conducted in coastal CT, in Long Island Sound, 1.5 km off of Milford on June 12, 2013, and June 19, 2013. The third experiment was conducted in coastal MA, in Vineyard Sound, 1 km off of Menemsha on July 23, 2013. The fourth experiment was conducted in offshore CA, 10 km off of Long Beach on August 20, 2013.
The conditions at these three locations span the range of what could be expected in offshore environments under evaluation for shellfish aquaculture. The water total particulate matter was highest in CT, lower in MA, and lowest in CA (all p≤ 0.001 from a generalization of Dunnett's T3 procedure for trimmed means and a bootstrap-t technique23). In contrast, the organic content of the seston was highest in CA, lower in MA, and lowest in CT (all p≤ 0.01 from a generalization of Dunnett's T3 procedure for trimmed means and a bootstrap-t technique23; Figure 5).
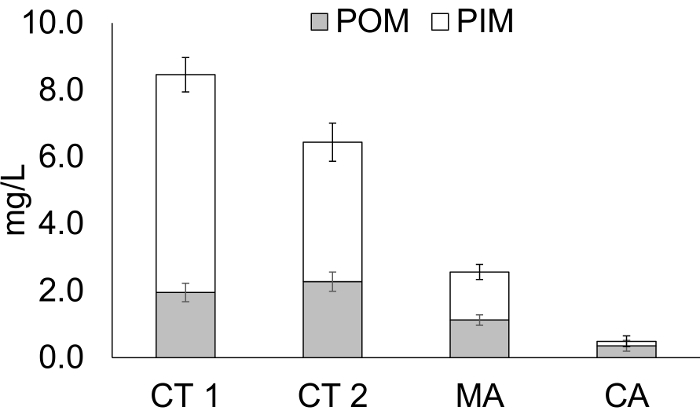
Figure 5: Composition and quantity of the particulate matter in water at the three experimental locations. This panel shows the average particulate organic matter (POM) (± SD; data and error bars in grey) and the average particulate inorganic matter (PIM) (± SD; data in white and error bars in black) from the water collected at 3 different experimental locations. The full bar (gray + white) indicates the total particulate matter (TPM). CT 1 = Connecticut experiment 1; CT 2 = Connecticut experiment 2; MA = Massachusetts experiment; CA = California experiment. Please click here to view a larger version of this figure.
Feeding behavior in bivalves is both species-dependent and dependent upon environmental conditions. Individuals adjust their feeding behavior according to differences in the amount and type (organic and inorganic) of particulate matter in the water. Thus, the results of the four filter-feeding experiments from the three locations reflect both the plastic physiological response to food quantity and quality, as well as species differences across three of the four experiments. Mussel absorption efficiency was significantly higher in the first CT experiment than in the second, and higher in the first CT experiment than in CA, but all other paired comparisons were not significant, likely a consequence of high variability observed in both the MA and the CA measurements (the significance tested at α = 0.05, adjusted to control for multiple tests; from a generalization of Dunnett's T3 procedure for trimmed means and a bootstrap-t technique;23 Figure 6). The proportion of filtered material that was rejected was highest in CT, lower in MA, and was zero in CA (all p≤ 0.005 from a generalization of Dunnett's T3 procedure for trimmed means and a bootstrap-t technique23).
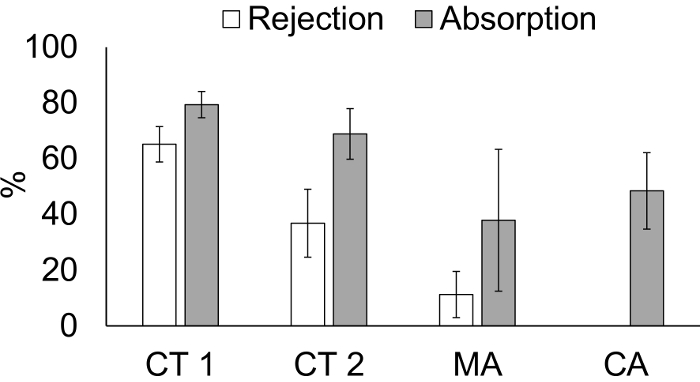
Figure 6: Rejection of total particulate matter and absorption of organic matter by the mussels in the shipboard trials. This panel shows the percentage rejection and absorption (± SD) by mussels in three experimental locations. CT 1 = Connecticut experiment 1; CT 2 = Connecticut experiment 2; MA = Massachusetts experiment; CA = California experiment. Blue mussels (Mytilus edulis) were used in CT 1 and in MA. Ribbed mussels (Geukensia demissa) were used in CT 2. Mediterranean mussels (Mytilus galloprovincialis) were used in CA. Please click here to view a larger version of this figure.
The experiments in MA and CA illustrated common problems that can arise during changing environmental conditions. The high sea state resulted in a high relative variability in the measured organic content of pseudofeces in MA.
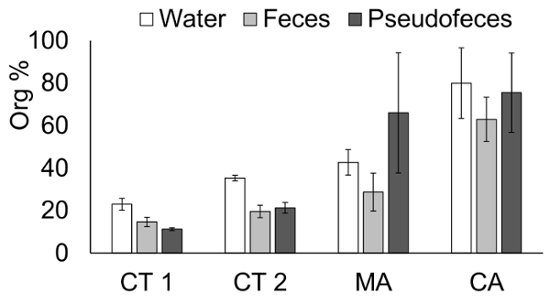
Figure 7: Organic content of water, feces, and pseudofeces in the three experimental locations. This panel shows the average percentage of organic matter (± SD) in the water and feces and pseudofeces of three mussel species in four different experiments performed in 3 locations. CT 1 = Connecticut experiment 1 with blue mussels (Mytilus edulis); CT 2 = Connecticut experiment 2 with ribbed mussels (Geukensia demissa); MA = Massachusetts experiment with blue mussels; CA = California experiment with Mediterranean mussels (Mytilus galloprovincialis). Please click here to view a larger version of this figure.
Analytical problems commonly associated with areas of low particulate matter were illustrated in feeding behavior results from CA, where some small pseudofeces were initially mistaken for feces.
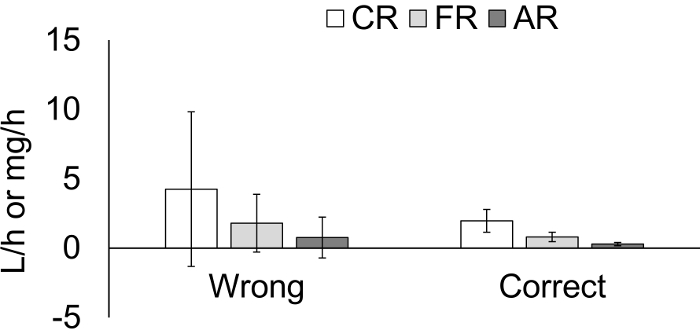
Figure 8: Effects of the misidentification of biodeposits on the feeding behavior data from the mussels in the shipboard trials. This panel shows the sample data from California, showing the effect of misidentifying small feces as pseudofeces in a low total-particulate-matter (TPM) environment. In this instance, the TPM was too low to trigger a pseudofeces production, but the feces were so small that some were mistaken for pseudofeces. The data were corrected by combining the feces and "pseudofeces" weights and only calculating the ingestion pathway. CR = Clearance Rate, the amount of water that circulates through the gills of the mussels (L/h); FR = Filtration Rate, the amount of particles retained in the gills (mg/h); AR = Absorption Rate, the amount of ingested particulate matter that is absorbed in the mussels' digestive system (mg/h). Please click here to view a larger version of this figure.
Case studies shown in Figure 7 and Figure 8 are explained in more detail in the Discussion section.
Discussion
Different approaches have been used to study the filtration and feeding of bivalves in both the laboratory and the field. Measurements made when using natural seston will yield feeding rates most similar to those in the natural environment24. Existing portable feeding devices for measuring bivalve feeding25,26 are dependent upon a stable platform, such as land or a fixed dock; thus, quantifying bivalve filtration and feeding in the field has, until now, been limited to very near-shore waters. The novel apparatus and method presented here represent a reliable tool to quantify the feeding performance of bivalves in offshore waters where interactions between bivalves and the environment have previously been poorly described.
The critical steps within the offshore application of the biodeposition method include the following: (1) the aeration of the head tank and the calibration of flow rates across all feeding chambers to ensure an even particle distribution to the bivalves; (2) an accurate determination of the experimental gut transit time prior to the collection of biodeposits; (3) the identification, separation, and complete collection of all feces and pseudofeces produced by the bivalves, including the collection of enough biodeposits to exceed the detection limit for organic and inorganic particulate matter. High flow rates are essential to avoid water recirculation in the feeding chambers, which may increase the phenomenon of food concentration reduction due to refiltration18,25,27,28.
The accurate identification and separation of feces and pseudofeces can be challenging in offshore environments. The collection of feces and pseudofeces in Massachusetts waters was likely affected by heavy seas during the last hour of the measurement. Measurements using this method will be constrained by the state of the sea, affecting the ability of pickers to cleanly separate and accurately distinguish among feces, pseudofeces, and other particulate material (i.e., silt or particles) deposited in the feeding chambers. This experimental problem can be observed in the resulting data, where the organic content of the pseudofeces has a greater variability in the results from Massachusetts than from the other two locations (Figure 7).
Locations with very low particulate matter, such as California, will present an analytical challenge, because the particulate matter collected in this experiment was very close to the limit of detection, even though 2 L of water was filtered for each water sample. The method of quantifying the organic and inorganic contributions to the total particulate matter is based on mass balance; thus, small analytical errors near the limit of detection can result in physiologically impossible shellfish feeding results, such as negative rejection or clearance rates. Data resulting from this type of error, and the appropriate correction, are illustrated in Figure 8, which plots the average value for the clearance rate, the filtration rate, and the absorption rate from the California experiment. The feces quantities were so small in this location that some were mistaken for pseudofeces by the biodeposit pickers. The very small amounts of "pseudofeces" collected were extremely close to the limit of detection by weight, and the resulting data yielded negative shellfish filtration and feeding data for several replicates, which is physiologically impossible and, thus, obviously incorrect. Particulate matter close to the limit of detection also yielded a high variability overall for this measurement. These results could be caused by an error in weighing the filters but, more likely, was due to the incorrect identification of pseudofeces. The latter possibility was further supported by the observation that the water total particulate matter was too low to trigger pseudofeces production22,23. The data were corrected by discarding the incorrect pseudofeces data and only calculating the ingestion pathway (Figure 8).
The apparatus for quantifying bivalve suspension feeding using the biodeposition method aboard a boat can be modified and adapted to several bivalve species. The size of the feeding chambers can vary slightly to accommodate wider or narrower bivalve shells. It is important to note, however, that modifying the dimensions of the feeding chambers from those described here require that the even particle distribution across the feeding chambers is established prior to conducting any measurements. The volume of water filtered should be adjusted based on the local conditions. Low-seston environments such as California require a greater volume of water filtered to exceed the detection limit for the weight-based analysis. At the same time, if too much water is filtered, then the filters clog, and the drying time (not temperature) in the oven needs to be increased. Similarly, the biodeposit collection may need to be lengthened in low-seston environments to collect enough material to exceed the analytical detection limit. Another indicator of a problematic biodeposit collection is the relative organic content of water vs. the pseudofeces and feces. Feces and pseudofeces may not contain a substantially greater percentage of organic matter than the water; they are a product of the filtered and processed particles from the water. Under some conditions, the organic content of the biodeposits may be slightly greater than that of the water because of the organic investment that bivalves make to process food particles; however, this investment will, at most, yield a minor increase in the feces organic matter. The percentage of organic matter reported here is far above the percentage that could be attributed to metabolic fecal loss. The pseudofeces samples from Massachusetts illustrate this potential problem. The organic content of the pseudofeces was quite variable, as noted above, but some of the replicates yielded organic content that greatly exceeded that of the corresponding water samples. It is possible that during the heavy seas of the last hour of the biodeposit collection, pseudofeces were combined with exogenous organic matter, which artificially elevated the organic content and yielded physiologically impossible results (Figure 7). If high sea states are a likely possibility in the future applications of this method, the addition of more replicates through additional chambers are recommended.
A limitation of the method is that this apparatus is designed to quantify the feeding of adult individuals. The accurate and complete collection of feces and pseudofeces from bivalve seed is difficult due to the small size of the (pseudo)feces and would require much longer experiments to obtain enough material to exceed the analytical detection limit. If small individuals are being used, several could be pooled in one chamber to increase the rate of feces and pseudofeces production per chamber. Alternatively, the devices could be redesigned with much smaller experimental chambers. The weather and sea state may also be important limitations, as these will affect the accuracy of the biodeposit sample collection. Temperature extremes and rain may reduce the number of bivalve replicates that feed. The depth at which water pumps are deployed may be varied between experiments to ensure the seston used in the experiments reflect the seston typical of the depth at which the bivalve cultivation will occur. Despite these potential limitations, the method offers the unique opportunity to study the filtration and feeding of bivalves under natural conditions, with natural seston, as opposed to simulated conditions in the laboratory. The data generated are much more realistic than laboratory experiments and more likely to reflect the performance of bivalves in the location of interest. The new method to conduct shipboard measurements greatly expands the potential geographic scope.
The growing interest in offshore mussel aquaculture presents an ideal user group for future applications of this method. Stakeholders interested in optimizing the siting of new offshore aquaculture operations can use this approach to examine the bivalve performance at proposed locations. An example of an application that is being planned is to test hypotheses about the optimal depths for a blue-mussel suspension culture in the coastal waters off of southern New England (Mizuta and Wikfors, in review).
Disclosures
The authors have nothing to disclose.
Acknowledgements
The authors would like to acknowledge NEFSC and the NOAA Fisheries Service Office of Aquaculture for funding. The authors are grateful to their academic and industry partners, Scott Lindell, Research Specialist at Woods Hole Oceanographic Institute, and Phil Cruver, CEO of Catalina Sea Ranch, who arranged and provided access to offshore mussel-growing areas. The work would not have been possible without the following working platforms; R/V Captain Jack owned by Catalina Sea Ranch, R/V Gemma owned and managed by The Marine Biological Laboratory, and the R/V Victor Loosanoff operated by NOAA Fisheries, Northeast Fisheries Science Center. We also thank boat captains Jim Cvitanovich and Bill Klim for their expertise. Werner Schreiner provided his technical expertise in designing and fabricating the frames, gimbal table and ballast tank, head tank, and experimental chambers.
Materials
| Name | Company | Catalog Number | Comments |
|---|---|---|---|
| GF/C glass microfibre filters | Whatman | 1822-025 | 25 mm diameter circles |
| Submersible Utility Pump | Utilitech | PPSU33 | 1/3 HP |
| Filtration manifold | Sterlitech | 313400 | 3-place manifold, PVC |
| Filter forceps | Millipore | XX6200006P | |
| Filter funnel | Ace Glass | D140942 | 300 ml; glass |
| Frit support | Fisher Scientific | 09-753-14 | 25mm diameter; glass |
| Vacuum Filter Holders | Fisher Scientific | 09-753-4 | For 25mm filter funnels and frit supports |
| Drying Oven | Fisher Scientific | 15-103-0503 | Gravity convection |
| Box Furnace Oven | ThermoFisher Scientific | BF51794C | |
| Ammonium formate | Fisher Scientific | A666-500 | |
| Tetraselmis sp. | National Center for Marine Algae and Microbiota | 119 strains of Tetraselmis sp. are available for sale by NCMA, and specific strain should be selected based on temperature of planned experiments. As such, we have not recommended a specific catalog number here. | |
| Glass petri dish | Fisher Scientific | 08-747A | 60 mm diameter |
References
- Pauly, D., Zeller, D. Catch reconstructions reveal that global marine fisheries catches are higher than reported and declining. Nature Communications. 7, 10244(2015).
- Diana, J. S. Aquaculture production and biodiversity conservation. BioScience. 59 (1), 27-38 (2009).
- Gallardi, D. Effects of bivalve aquaculture on the environment and their possible mitigation: a review. Fisheries and Aquaculture Journal. 5, 105(2014).
- Newell, R. I. E. Ecosystem influences on natural and cultivated populations of suspension-feeding bivalve molluscs: A review. Journal of Shellfish Research. 23 (1), 51-61 (2004).
- Lindahl, O., Kollberg, S. Can the EU agri-environmental aid program be extended into the coastal zone to combat eutrophication. Hydrobiologia. 629 (1), 59-64 (2009).
- Rose, J. M., Bricker, S. B., Tedesco, M. A., Wikfors, G. H. A role for shellfish aquaculture in coastal nitrogen management. Environmental Science & Technology. 48 (5), 2519-2525 (2014).
- McKindsey, C. W., Thetmeyer, H., Landry, T., Silvert, W. Review of recent carrying capacity models for bivalve culture and recommendations for research and management. Aquaculture. 261 (2), 451-462 (2006).
- Cheney, D., Langan, R., Heasman, K., Friedman, B., Davis, J. Shellfish culture in the open ocean: lessons learned for offshore expansion. Marine Technology Society Journal. 44 (3), 55-67 (2010).
- Shumway, S. E. Shellfish aquaculture and the environment. , Wiley-Blackwell. Chichester, UK. (2011).
- Dame, R. F. Ecology of marine bivalves: An ecosystem approach. , CRC Press. Boca Raton, FL. (2011).
- Bayne, B. L., et al. Feeding behaviour of the mussel, Mytilus edulis: responses to variations in quantity and organic content of the seston quantity and organic content of the seston. Journal of the Marine Biological Association of the United Kingdom. 73 (4), 813-829 (1993).
- Ward, J. E., Shumway, S. E. Separating the grain from the chaff: particle selection in suspension- and deposit-feeding bivalves. Journal of Experimental Marine Biology and Ecology. 300 (1-2), 83-130 (2004).
- Heck, K. L. Jr, Valentine, J. F. The primacy of top-down effects in shallow benthic ecosystems. Estuaries and Coasts. 30 (3), 371-381 (2007).
- Prins, T. C., Smaal, A. C., Dame, R. F. A review of the feedbacks between bivalve grazing and ecosystem processes. Aquatic Ecology. 31 (4), 349-359 (1998).
- Ferreira, J. G., Saurel, C., Lencarte e Silva, J. D., Nunes, J. P., Vazquez, F. Modelling of interactions between inshore and offshore aquaculture. Aquaculture. 426, 154-164 (2014).
- Stevens, C., Plew, D., Hartstein, N., Fredriksson, D. The physics of open-water shellfish aquaculture. Aquacultural Engineering. 38 (3), 145-160 (2008).
- Iglesias, J. I. P., Urrutia, M. B., Navarro, E., Ibarrola, I. Measuring feeding and absorption in suspension-feeding bivalves: an appraisal of the biodeposition method. Journal of Experimental Marine Biology and Ecology. 219 (1-2), 71-86 (1998).
- Riisgård, H. U. On measurement of filtration rates in bivalves - the stony road to reliable data: review and interpretation. Marine Ecology Progress Series. 211, 275-291 (2001).
- Møhlenberg, F., Riisgård, H. U. Efficiency of particle retention in 13 species of suspension feeding bivalves. Ophelia. 17, 239-246 (1978).
- Shumway, S. E., Cucci, T. L., Newell, R. C., Yentsch, C. M. Particle selection, ingestion, and absorption in filter-feeding bivalves. Journal of Experimental Marine Biology and Ecology. 91 (1-2), 77-92 (1985).
- Velasco, L. A., Navarro, J. M. Feeding physiology of two bivalves under laboratory and field conditions in response to variable food concentrations. Marine Ecology Progress Series. 291, 115-124 (2005).
- Galimany, E., Ramón, M., Ibarrola, I. Feeding behavior of the mussel Mytilus galloprovincialis (L.) in a Mediterranean estuary: A field study. Aquaculture. 314 (1-4), 236-243 (2011).
- Wilcox, R. R. Understanding and applying basic statistical methods using R. , John Wiley & Sons. Hoboken, NJ. (2017).
- Velasco, L. A., Navarro, J. M. Feeding physiology of two bivalves under laboratory and field conditions in response to variable food concentrations. Marine Ecology Progress Series. 291, 115-124 (2005).
- Filgueira, R., Labarta, U., Fernández-Reiriz, M. J. Flow-through chamber method for clearance rate measurements in bivalves: design and validation of individual chambers and mesocosm. Limnology and Oceanography Methods. 4, 284-292 (2006).
- Grizzle, R. E., Greene, J. K., Luckenbach, M. W., Coen, L. D. A new in situ method for measuring seston uptake by suspension-feeding bivalve molluscs. Journal of Shellfish Research. 25 (2), 643-649 (2006).
- Riisgård, H. U. On measurement of filtration rates in bivalves - the stony road to reliable data: review and interpretation. Marine Ecology Progress Series. 211, 275-291 (2001).
- Newell, C. R., Wildish, D. J., MacDonald, B. A. The effects of velocity and seston concentration on the exhalant siphon area, valve gape and filtration rate of the mussel Mytilus edulis. Journal of Experimental Marine Biology and Ecology. 262 (1), 91-111 (2001).
Reprints and Permissions
