Normothermic ex situ heart perfusion (ESHP), preserves the heart in a beating, semi-physiologic state. When performed in a working mode, ESHP provides the opportunity to perform sophisticated assessments of donor heart function and organ viability. Here, we describe our method for myocardial performance evaluation during ESHP.
Method Article
Normothermic Ex Situ Heart Perfusion in Working Mode: Assessment of Cardiac Function and Metabolism
In This Article
Summary
Abstract
The current standard method for organ preservation (cold storage, CS), exposes the heart to a period of cold ischemia that limits the safe preservation time and increases the risk of adverse post-transplantation outcomes. Moreover, the static nature of CS does not allow for organ evaluation or intervention during the preservation interval. Normothermic ex situ heart perfusion (ESHP) is a novel method for preservation of the donated heart that minimizes cold ischemia by providing oxygenated, nutrient-rich perfusate to the heart. ESHP has been shown to be non-inferior to CS in the preservation of standard-criteria donor hearts and has also facilitated the clinical transplantation of the hearts donated after the circulatory determination of death. Currently, the only available clinical ESHP device perfuses the heart in an unloaded, non-working state, limiting assessments of myocardial performance. Conversely, ESHP in working mode provides the opportunity for comprehensive evaluation of cardiac performance by assessment of functional and metabolic parameters under physiologic conditions. Moreover, earlier experimental studies have suggested that ESHP in working mode may result in improved functional preservation. Here, we describe the protocol for ex situ perfusion of the heart in a large mammal (porcine) model, which is reproducible for different animal models and heart sizes. The software program in this ESHP apparatus allows for real-time and automated control of the pump speed to maintain desired aortic and left atrial pressure and evaluates a variety of functional and electrophysiological parameters with minimal need for supervision/manipulation.
Introduction
Clinical relevance
While most aspects of cardiac transplantation have evolved significantly since the first heart transplant in 1967, cold storage (CS) remains the standard for donor heart preservation1. CS exposes the organ to a period of cold ischemia that limits the safe preservation interval (4–6 hours) and increases the risk of primary graft dysfunction2,3,4. Due to the static nature of CS, assessments of function or therapeutic interventions are not possible in the time between the organ procurement and transplantation. This is a particular limitation in extended criteria donors including hearts donated after circulatory death (DCD), creating an obstacle for overcoming the considerable gap between demand and the current donor pool5,6. To address this limitation, ex situ heart perfusion has been proposed as a novel, semi-physiologic method of preserving donated hearts, minimizing exposure to cold ischemia by providing oxygenated, nutrient-rich perfusate to the heart during preservation time1,7,8.
Ex situ heart perfusion
One of the most frequently used methods for ex situ examination of the isolated heart is Langendorff perfusion. In this method, introduced by Oskar Langendorff in 1895, the blood flows into the coronary arteries and out the coronary sinus of the isolated heart, with the heart in an empty and beating state9,10. Clinical ESHP in a Langendorff mode with the Transmedics Organ Care System apparatus (OCS) has been shown to be non-inferior to CS in the preservation of standard-criteria donor hearts1, and has facilitated the clinical transplantation of DCD hearts11. However, there are concerns about the ability of the device to evaluate organ viability, as a number of donor hearts initially thought to be transplantable were discarded after perfusion on the OCS3. The OCS supports the heart in the Langendorff (non-working) mode, and thus possesses a limited capacity for evaluation of the pumping function of the heart3,12. A growing body of evidence suggests that functional parameters offer a better way to assess organ viability, suggesting that assessments of cardiac function may become a reliable tool for the evaluation and selection of hearts for transplantation during ESHP3,12,13,14, Furthermore, our studies on ex situ perfused porcine hearts suggest that ESHP in working mode provides enhanced functional preservation of the heart during the perfusion interval15,16.
An ESHP apparatus capable of preserving the heart in a working mode must possess a level of automation to safely and precisely maintain preload, afterload and flow rates. Also, such a system should possess the flexibility to facilitate comprehensive assessments of cardiac function to be undertaken. The ESHP apparatus used here is equipped with custom software that 1) provides and maintains desired aortic (Ao) and left atrial (LA) pressure/flow and 2) provides real-time analysis of functional parameters and visual evaluation of pressure waveforms with minimal need for supervision. Pressure data is acquired with standard fluid-filled pressure transducers, and flow data is acquired with transit-time doppler flow probes. These signals are digitized with a bridge and analog input, respectively. The heart is positioned horizontally with a slight elevation to the great vessels on a soft silicone membrane. The cannulation attachments pass through the membrane, incorporating a compliance chamber for dampening ventricular ejection. The goal of this work is to provide researchers in the field of cardiac transplantation with a protocol for ex situ perfusion and evaluation of the heart, under normothermic, semi-physiologic conditions in working mode, in a large mammal (Yorkshire pig) model.
Protocol
All the procedures in this manuscript were performed in compliance with the guidelines of the Canadian Council on Animal Care and the guide for the care and use of laboratory animals. The protocols were approved by the institutional animal care committee of the University of Alberta. This protocol has been applied in female juvenile Yorkshire pigs between 35–50 kg. All individuals involved in ESHP procedures had received proper biosafety training.
1. Pre-surgical Preparations
- Place the organ chamber properly on the apparatus cart and install the silicon support membrane inside the organ chamber. The Ao, pulmonary artery (PA) and LA connection points can be seen in Figure 1.
- Install the ESHP tubing network (represented in Figure 2A,B) oxygenator and filter. Attach the heat exchanger water lines and the sweep gas tubing to the oxygenator.
- Place the flow probes for measuring coronary sinus/PA and LA flow on the corresponding tubing.
- Connect the Ao and LA pressure transducers to the representative lines on the circuit.
- Ensure that all the tubing connections are firmly attached and all the stopcocks and luer locks are properly closed on the unattached sites.
- Prime the circuit with 750 mL of modified Krebs-Henseleit buffer (NaCl, 85; KCl, 4.6; NaHCO3, 25; KH2PO, 1.2; MgSO4, 1.2; glucose, 11; and CaCl2, 1.25 mmol/L) containing 8% albumin. De-air the Ao and LA pumps by positioning the pump outlet above the inlet so that the air leaves the pump chamber (Figure 3). The solution typically does not need to be oxygenized before the start of the perfusion.
- Initiate the software after the Ao and LA pumps are de-aired and the circuit is primed.
2. ESHP Software Initialization and Adjustments
NOTE: The ESHP apparatus used here is equipped with a custom software program to allow control of pump speed in order to achieve and maintain desired LA and Ao pressures. The software also analyzes functional parameters and provides a visual evaluation of pressure waveforms (Figure 4).
- To start the ESHP program, click on the program shortcut on the monitor.
- In the “setting” page, click “initialize”. The initializing message will appear on the board (Figure 5).
- On the same page, zero the flow sensors clicking the “zero LA flow” and “zero PA flow”. The message will appear on the board.
- Adjust the height of the pressure transducers to the height of the silicon support. To zero the pressure transducers, open the Ao and LA pressure transducers (and any other transducers set to check the pressure) to the atmosphere, then click “zero all pressures” button. The message will appear on the board.
- In the “main” page, increase the Ao pump speed gradually up to the point where flow from the Ao cannula appears in the organ chamber. In the present system, this is achieved with 900–1000 revolutions per minute (RPM).
- Add 750 mL of blood to the perfusate solution to bring the total perfusate volume to 1.5 L (as described in the “Surgery, harvesting blood, and heart procurement” section) and then increase the LA pump PRM (800-900 RPM) so that no air remains in the LA cannula or the LA tubing beneath the silicone support membrane.
- After initializing the controlling software and de-airing of the ESHP apparatus, donor heart procurement may proceed.
3. Preparations and Anesthesia
- Administer 20 mg/kg of ketamine and 0.05 mg/kg of atropine intramuscularly for premedication.
- Transfer the pig to the surgical suite and place the pig on the operating table with tabletop heating to maintain normothermia.
- Titrate oxygen flow rate for mask induction according to animal weight and the anesthetic system. For the closed-circle anesthetic circuits the oxygen flow should be 20 - 40 mL/kg.
- Turn on isoflurane to 4–5%; after one or two minutes this may be reduced to 3%.
- Evaluate the depth of anesthesia. The pig is in the surgical plane if there is no withdrawal reflex in response to noxious stimulus.
- After confirmation of the appropriate depth of anesthesia, proceed to intubation.
- Place the pulse oximeter probe on the tongue (preferred) or ear. The oxygen saturation measured by pulse oximetry should remain above 90%.
- Shave patches of hair off on the left and right elbow regions, and left stifle. Wash off skin oils with soap and water, rinse with rubbing alcohol and dry completely. Place the ECG contacts. Avoid lead wire interference with the surgical site. Connect the leads to the correct locations.
- To maintain the anesthesia, adjust oxygen flow (20–40 mL/kg) and inhalant gas rate (1–3%). The heart rate should be 80–130 beats/min. Respiration rate should be 12–30 breaths/min.
- Shave, wash and aseptically prepare the incision site.
4. Blood Collection and Heart Procurement
- Evaluate the anesthesia level every minimum every 5 min to confirm the surgical plane (no pedal reflex and no blink reflex, no response to painful stimuli).
- Perform a median sternotomy.
- Identify jugulum and xiphoid as landmarks.
- Using electrocautery, develop the midline between the landmarks by dividing the subcutaneous tissue and the fascia between the fibers of the pectoralis major muscle.
- Mark the midline along the sternal bone with the cautery. Perform sternal osteotomy with an electric or air-powered saw. To prevent creating injuries to the underlying structures (e.g. pericardium and brachiocephalic vein, and innominate artery), proceed gradually with the saw.
- Retract the sternum gradually, using a sternal retractor. To avoid excessive tension and vascular injury, do not place the retractor too far cranially.
- Free the sternopericardial ligaments from the posterior surface of the sternum using cautery.
- Open the pericardium with a Metzenbaum Scissor and fix the pericardial edges to the sternum using 1-0 silk suture.
- Extend the midline incision cranially by 2–3 cm and expose the right common carotid artery and internal jugular vein.
- Obtain proximal and distal control of the vessels by encircling the vessels with silk ties (2-0).
- Tie the cranial encircling ties on each vessel.
- Open the anterior 1/3 of each vessel with an 11-blade and then insert a 5–6 F sheath into each vessel. Tie the caudal encircling tie around each vessel to secure the respective sheathes.
- Monitor the arterial and central venous pressures by connecting each sheath to a pressure transducer.
- Deliver 1,000 U/kg heparin intravenously.
- Place a 3-0 polypropylene purse-string suture around the right atrial appendage and secure it with a snare.
- Inside the purse-string suture, create a 1 cm incision on the appendage using an 11 blade. Insert a two-stage venous cannula (28/36 FR) inside the incision and position the distal tip in the IVC. Secure the cannula by tieing snare to the venous cannula. Control the outlet of the cannula with a tubing clamp.
- From the two-stage venous cannula placed in the right atrium, collect 750 mL of whole blood from the pig gradually over a period of 15 min into an autoclaved glass container, and simultaneously replace the volume with 1 L of an isotonic crystalloid solution such as Plasmalyte A.
- Add the blood to the perfusion circuit (which has been previously primed with 750 mL Krebs-Henseleit buffer containing 8% albumin) to reach a final volume of 1.5 L of perfusate. The perfusate is a 1:1 combination of Krebs-Henseleit containing 8% albumin solution and whole blood from the donor animal 17.
- Place a cardioplegia needle (14–16 F) in the ascending Ao and secure it with a snare.
- Connect the cardioplegia cannula to the cardioplegia bag and add 100 mL of blood to 400 mL of cardioplegia (St. Thomas Hospital Solution) to reach a final volume of 500 mL blood cardioplegia.
- Euthanize the pig by exsanguination. If intending to add more blood to the perfusate after starting of the perfusion (according to the aims of the study), collect the blood and add 10–30 U/mL of heparin to it and store it in a glass container or a plastic bag at 4 °C for short durations (hours
- Cross-clamp the ascending Ao with an Ao clamp and deliver the cardioplegic solution into the Ao root.
- After delivery of the cardioplegic solution is completed, remove the cross-clamp and perform the cardiectomy.
- For ease of attaching the Ao and PA to their representative cannula, partially dissect the ascending Ao from the PA using a Metzenbaum scissors.
- Transect the superior and inferior vena cava, leaving roughly 1 cm of length on each.
- Separate the heart from the posterior mediastinum by transecting the pulmonary veins.
- Excise the heart ensuring all of the Ao arch vessels are procured along with a segment of descending Ao. Preserve up to the PA bifurcation.
- Weigh the empty heart. The amount of weight gain over the ex situ preservation interval can be used as a metric for organ edema.
5. Placement of the Heart onto the ESHP Apparatus and Initiation of Perfusion
- Trim excess tissue around the LA with a Metzenbaum scissor and cut between the pulmonary veins to create a common orifice.
- Place a purse-string suture around the LA orifice using a 3-0 polypropylene suture.
- Suture and close the inferior vena cava with a 3-0 polypropylene suture. Leave the superior vena cava open at the beginning of the perfusion to ensure the right ventricle (RV) remains decompressed until the perfusate warmed and an organized rhythm is achieved.
- Place the LA cannula into the LA orifice and secure it with a snare (Figure 6).
- Gently squeeze the ventricles to de-air the heart” from 5.5. and add it to 5.7. as Increase the Ao pump speed to 1600 RPM as gently squeezing the heart. The remaining air in Ao root will be ejected through the innominate and subclavian branches.
- Attach the Ao to the Ao cannula embedded in the silicone membrane. Secure the Ao around the cannula with a silk tie. Trim the Ao to achieve a proper lie without tension or kinking.
- Increase the Ao pump speed to 1600 RPM. The remaining air in Ao root will be ejected through the innominate and subclavian branches.
- Connect the Ao purge line to the innominate artery. Secure the connection with a silk tie.
- Snare the left subclavian artery orifice with a silk tie. Secure the closure with a snare and snap. Through the orifice of the subclavian artery, place an introducer sheath (5f). Ensure that the length of the catheter and its orientation is properly adjusted so that it does not interfere with Ao valve function.
- Connect the Ao pressure transducer to the introducer sheath side port.
- Read the Ao pressure on the monitor. Adjust the Ao pump speed to reach a mean pressure of 30 mm Hg. At this point (Time 0), the perfusion will have started in the non-working mode (Langendorff mode) and appearance of a dark deoxygenated perfusate in the PA line is a reflector of reestablishment of coronary flow. Set a timer to follow duration of the perfusion if needed.
- Turn on the heat exchanger and set the temperature to 38 °C. The perfusate will warm up to 37–38 °C in approximately 10 min. For normothermic perfusion of a porcine heart, keep the temperature at 38 °C throughout the perfusion.
- Maintain the perfusion in non-working mode for the first hour of the perfusion. Adjust the LA pump speed to maintain the LA pressure at 0 mmHg.
- Once the perfusate temperature is >34 °C, evaluate the heart rhythm and pace and defibrillate as required (5–20 joules). Ensure the heart is completely decompressed before attempting cardioversion.
- Check the dissolved gas status using a blood gas analyzer. Adjust the gas mixture to maintain a pH: 7.35–7.45, arterial partial pressure of carbon dioxide (PaCO2): 35–45 mmHg, arterial partial pressure of oxygen (PaO2): of 100–150 mmHg, and oxygen saturation (sO2) ≥95%.
- Once the heart is normothermic and in a stable rhythm, ligate the superior vena cava.
- Attach temporary pacemaker leads to the right atrial wall and pace the heart in an AAI mode at 100 beats/min.
- Attach the epicardial electrocardiography electrodes to the surface of the heart.
- Switch to working mode after 1 h of perfusion in Langendorff mode. For this purpose, enter the desire LA pressure (typically 6–8 mmHg) on the left side of the main page, in the “desired LAP” section of the software, and click on the button to initiate the feedback loop. The activated working mode will appear as a green button, and the LA pump speed will automatically increase and decrease to reach and maintain the desired LA pressure.
- As the heart begins to work, coronary vascular resistance will drop resulting in a low diastolic pressure. Adjust the Ao pump speed to maintain the Ao diastolic pressure of 40 mmHg as afterload during perfusion in the working mode.
6. Metabolic Support During ESHP
NOTE: Organ perfusion solutions, including Krebs-Henseleit buffer solution, typically contain glucose as the primary energy substrate.
- Check the glucose level (e.g. with blood gas analysis) at regular intervals during the perfusion. In accordance with the consumption rates, using a standard infusion pump replace glucose by continuous arterial infusion and/or bolus doses, to maintain an arterial concentration of 6–8 mmol/L of glucose throughout the perfusion.
- Using a separate infusion pump, deliver 2 U/h of insulin to the perfusate throughout the perfusion, changing the rate of insulin infusion according to the aims of the study.
- For β-adrenoceptor stimulation of the heart, deliver 0.08 µg/min of epinephrine to the perfusate using a standard infusion pump, and continue throughout the perfusion. Alternatively, an infusion of 4 µg/min of dobutamine may be used.
7. Anti-microbial and Anti-inflammatory Agents
- Add a broad-spectrum antibiotic (e.g. 3.375 grams of piperacillin-tazobactam) to the perfusate at the start of perfusion.
- Add anti-inflammatory agents (e.g. 500 mg of methylprednisolone) to the perfusate in accordance with the aims of the study, if necessary.
8. Assessment of Function
NOTE: The ESHP controlling software automatically calculates and records steady-state hemodynamic and functional indices every ten seconds.
- Assessment of steady state systolic and diastolic function
- For assessment and recording of the steady state data, through the introducer sheath placed earlier in the subclavian artery, place a fluid-filled pigtail catheter into the left ventricle (LV) while in working mode.
- Flush the pigtail catheter with saline and place the guide wire inside it.
- Gently insert the catheter into the Sheath cannula previously placed in the subclavian artery. As soon as it passes through the Ao valve, remove the guidewire slowly and connect the pigtail catheter to the LV pressure line.
- Follow the LV pressure wave on the monitor. The diastolic portion of the pressure wave will reach zero when the catheter has properly placed inside of the LV. Of note, this step is only possible in working mode since the Ao valve must be opening normally for the pigtail catheter to be able to enter the chamber. Once the pigtail catheter is placed in the LV and connected to the LV pressure transducer, the LV maximum and minimum rate of pressure change (dP/dT min and dP/dT max) will be recorded automatically.
- Determine the myocardial performance by indexing the measured flow on the LA line, for heart mass (mL·min–1·g–1), at a given constant LA pressure (6–8 mmHg), and an Ao diastolic pressure of 40 mm Hg, and a heart rate of 100 beats·min–1. The LA pressure equals the cardiac output, assuming there is no Ao insufficiency. Examine the Ao pressure waveform to ensure there is no Ao insufficiency.
- For assessment and recording of the steady state data, through the introducer sheath placed earlier in the subclavian artery, place a fluid-filled pigtail catheter into the left ventricle (LV) while in working mode.
- Assessment of preload recruitable stroke work (PRSW)
NOTE: PRSW is the linear relationship between end-diastolic volume and LV stroke work (LVSW) and represents an index for the evaluation of ventricular function, independent of preload, afterload, and size of the ventricle18,19. PRSW can be measured with this system in a non-invasive fashion as described below13.- Remove the pigtail catheter from the LV, since the catheter may induce arrhythmias during PRSW analysis that will negatively affect the accuracy of the results.
- On the main page, in the “Capture PVL” section, adjust the desired rate of drop in LA pump speed during the analysis (typically 100–200 RPM) and desired time during which the analysis will take place (typically 10–12 s) (Figure 4).
- After performing the adjustments mentioned above, click on “Record PVL”. The software will automatically exit working mode and gradually reduce LA pump RPM while simultaneously recording LVSW and LA pressure. At the conclusion of data collection, the software will perform linear regression on the newly acquired dataset to yield PRSW. After the ESHP software has completed the analysis, a message will appear on the main page, showing the correlation coefficient of the analysis. Press “OK” if the coefficient (R-value) is desirable (typically >0.95). The PRSW analysis results will be recorded.
- After performing the analysis, to return to perfusion in the working mode, click on “Press To Start Working Mode;” otherwise the software will continue in Langendorff (non-working) mode. The gray button will turn to green indicating a return to working mode. If repeated PRSW analysis is needed, before each new attempt ensure that the LA pressure/flow values return to the previous steady state values.
9. Metabolic Assessment of the Ex Situ Perfused Heart
- Assess the metabolic state of the heart and the perfusate during ESHP, using the information obtained from the blood gas analysis of the perfusate samples collected from both Ao (arterial), and PA (venous) lines every 1–2 h.
- Perform blood gas analysis (every 1–2 h) to monitor the gas and ionic state of the perfusate. Adjust the gas composition (O2 and CO2) and sweep speed to maintain a pH of 7.35–7.45, paO2 of 100–150 mmHg, and paCO2 of 35–45 mmHg. Adjust and maintain the perfusate ionic concentration of potassium and calcium in the physiologic range during the perfusion (e.g. by addition of calcium chloride if needed).
- Use the information obtained from the blood gas analysis and coronary blood flow to calculate metabolic parameters. For example, calculate myocardial oxygen consumption (MVO2), and LV mechanical efficiency (ME) as follows:
- Determine MVO2 (mL O2 · min-1 · 100 g-1) multiplying the coronary blood flow (CBF) by the arterial-venous difference in oxygen content (CaO2 – CvO2).
MVO2 = [CaO2 - CvO2 (mL O2 · 100 mL-1)] × CBF (mL . min-1 . 100 g heart mass), where;
Arterial oxygen content (CaO2) = [1.34 (mL O2 . g Hb-1) × Hb concentration (g · 100 mL-1) × oxygen saturation (%)] + [0.00289 (mL O2 · mm Hg-1 · 100 mL-1) × PaO2 (mm Hg)]
Venous oxygen content (CvO2) = [1.34 (mL O2 · g Hb-1) × Hb concentration (g · 100mL-1) × oxygen saturation (%)] + [0.00289 (mL O2 · mm Hg-1 · 100 mL-1) × PvO2 (mm Hg)] - Calculate LV mechanical efficiency (ME) as follows:
ME = LVSW (J . beat-1) / MVO2 (J . beat-1) where
Stroke work = {mean arterial pressure (mmHg) - LA pressure (mmHg)} × {LA flow (mL . min-1)/ heart rate (beats . min-1)} × 0.0001334 (J . mL-1 . mmHg-1), and
MVO2 (J . beat-1) = {MVO2 (mL . min-1)/heart rate (beats . min-1)} × 20 (joules . mL-1)
- Determine MVO2 (mL O2 · min-1 · 100 g-1) multiplying the coronary blood flow (CBF) by the arterial-venous difference in oxygen content (CaO2 – CvO2).
10. Removing the Heart from ESHP Apparatus at the End of Perfusion
- Exit the working mode. Bring the LA pump RPM to zero.
- Decrease the Ao pump RPM to zero.
- Remove the pigtail and sheaths.
- Quickly remove all the attachments to the heart.
- Weigh the empty heart to determine the degree of myocardial edema formation.
- Quickly take tissue samples of proper size from the left and right ventricles and place them in optimum cutting temperature (OCT) gel, formalin and/or snap freeze them in liquid nitrogen. Store the samples for future investigations (OCT and snap frozen samples in a -80 °C freezer, formalin-stored samples in a properly sealed container at room temperature).
- Close the program; all the recorded data will be saved.
- Discard the remaining tissue, blood, bioactive materials and used ESHP apparatus components according to institutional protocols.
- Clean the ESHP cart using a sanitizing hard surface cleaner (e.g. 70% ethanol) thoroughly.
Results
At the start of the perfusion (in non-working mode), the heart will normally resume a sinus rhythm when the temperature of the system and perfusate approaches normothermia. When entering working mode, as the LA pressures are approaching the desired values, ejection on the Ao pressure tracing should be observed and the LA flow (a reflection of cardiac output) should increase gradually. In a Yorkshire pig model (35–50 kg) and a starting heart weight of 180–220 grams, the initial LA flow will be ~2,000 mL/min, and this will typically approach ~2,750 mL/min during the first hour of perfusion in working mode. Figure 7 displays trends in Ao pressure (A) as well as LA and pulmonary arterial flow (B) over 12 h of perfusion.
During ESHP in the physiologic working mode, various metabolic assessments of the heart are also possible. Blood gas analysis/metabolic assessments performed on the perfusate samples obtained during ESHP provide extensive information on the metabolic status of the heart over time (Tables 1 and 2) and (Figure 8A, B)20. In addition to blood gas analysis, perfusate samples can be collected and assessed for different biomarkers such as brain natriuretic peptide and troponin-I; however, it should be noted that ESHP occurs in a closed system, with no exchange of perfusate solution. In the absence of the organs that naturally metabolize/clear these factors (e.g. kidneys), the accumulation of biomarkers over time in the perfusate solution is typically observed (Figure 9).
Functional assessment of the heart using this platform may include both load-dependent parameters [including myocardial performance (cardiac index, CI), LVSW, maximum and minimum rates of pressure change (dp/dt max and min)], and load-independent parameters (PRSW) (Table 3). Figure 10 demonstrates the evaluation of LV PRSW during a computer-controlled linear reduction in the LA pressure13. In our experience with ESHP of >200 porcine hearts and >10 human hearts, the use of an automated ESHP software program has been in association with the development of standard operating procedures resulting in minimal inter- and intra-operator variability in the functional parameters. The ESHP apparatus and software system used here have been designed to maintain the desired pressures and collect the functional parameters with minimal need for manual adjustments, and we have observed an interclass correlation coefficient (ICC) ≥0.9 for all of the assessed parameters (e.g. LVSW, and dP/dt max and min) that accounts for excellent inter-rater, intra-rater and test-retest reliability. In this system, the electrocardiographic monitoring of the heart during perfusion can also take place using two electrodes as described in the protocol, providing information on the heart rate and rhythm during perfusion (Figure 4).
The assessment of the heart during ESHP may be extended to different imaging modalities. Echocardiography during ESHP can provide additional information on myocardial function (e.g. ventricular ejection fraction) and anatomical parameters (Figure 11 and Figure 12). Moreover, an assessment of the coronary vasculature is possible with angiographic imaging21.
Performing a linear regression analysis identifies which parameters best correlated with myocardial performance (cardiac index: mL·min-1·g-1) during ESHP. We previously showed that despite the significant variation in the ability of the measured functional parameters to predict myocardial performance, overall, functional parameters exhibit a high correlation with cardiac output. The best functional predictors included systolic stroke work [coefficient of determination (R2) = 0.759], for systolic function, and minimum dP/dt, (R2 = 0.738) for diastolic function. Interestingly, metabolic parameters alone show a very limited ability to predict myocardial performance (oxygen consumption: R2 = 0.28; coronary vascular resistance: R2 = 0.20; lactate concentration: R2 = 0.02).13 Perfusion of the heart in a normothermic working mode offers the opportunity to obtain comprehensive metabolic and functional assessments of the heart during organ preservation. A clinical ESHP device with the ability to support the donor heart in working mode will provide the healthcare team with the opportunity to made decisions about organ viability based on objective data before transplantation.
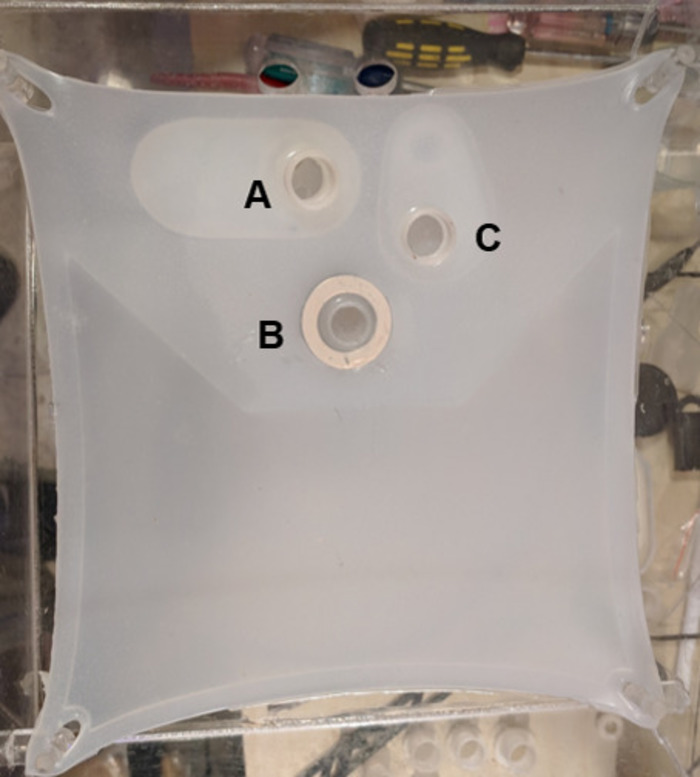
Figure 1: The silicone support membrane for the heart. Support membrane pictured with integrated aortic cannula (A), left atrial cannula (B), and pulmonary artery cannula (C). Please click here to view a larger version of this figure.
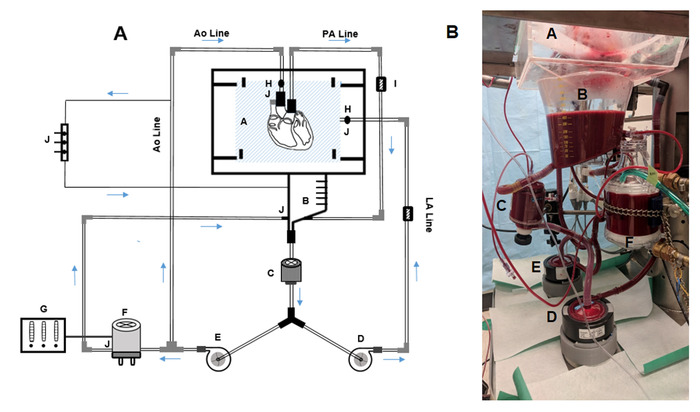
Figure 2: The ESHP circuit. (A) Schematic figure of the ESHP circuit. (B) ESHP apparatus used in our setting. A = organ chamber and silicone support membrane, B = reservoir, C = arterial line filter, D = left atrial pump, E = aortic pump, F = membrane oxygenator and heat exchanger, G = gas mixer, H = tube flow sensor, I = pressure sensor, J = stopcock/luer lock. Please click here to view a larger version of this figure.
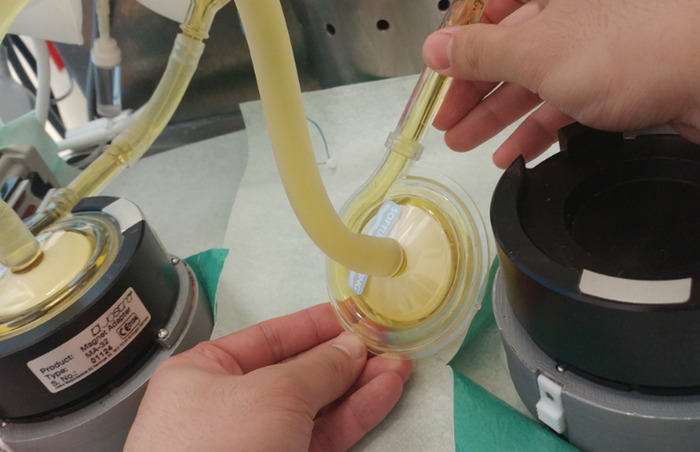
Figure 3: De-airing the pumps by positioning the pump outlet to a higher level. Please click here to view a larger version of this figure.
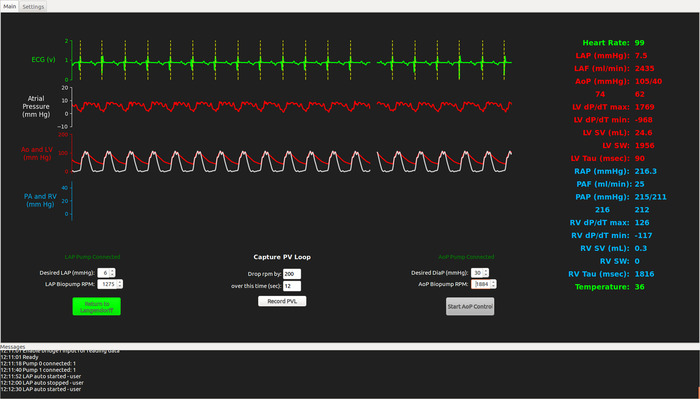
Figure 4: Screen shot from the running ESHP software program showing cardiac functional parameters. Please click here to view a larger version of this figure.
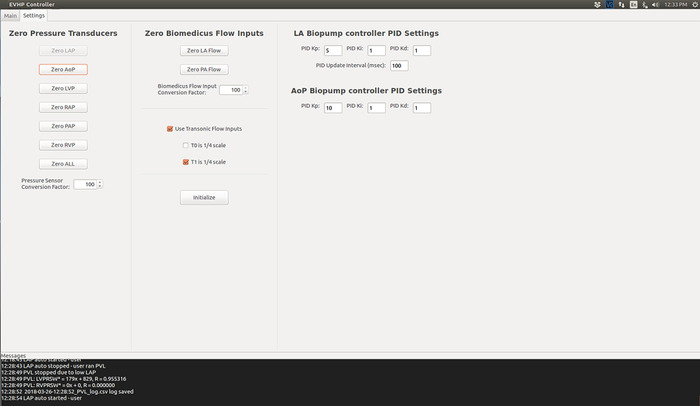
Figure 5: Screen shot from the initialized ESHP software program. Please click here to view a larger version of this figure.
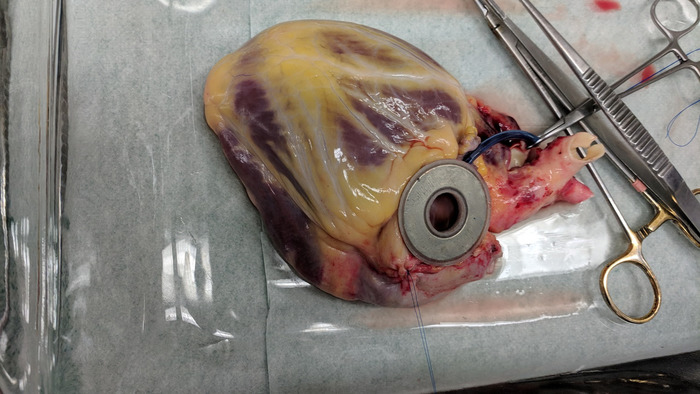
Figure 6: The magnetic left atrial cannula secured to the posterior aspect of the left atrium. Please click here to view a larger version of this figure.
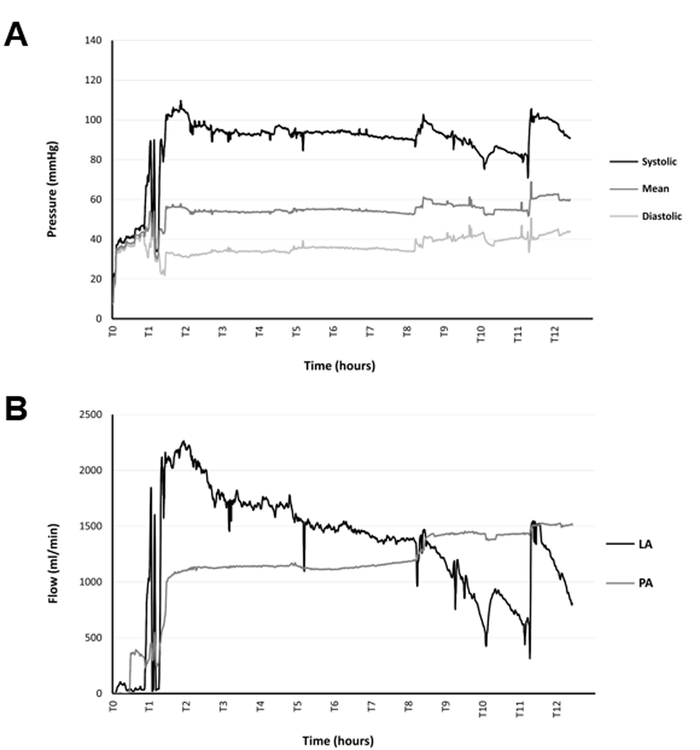
Figure 7: Monitoring pressures and flows during the perfusion. (A) Trends in the aortic pressure during 12 h of ESHP. (B) Trends in the left atrial and pulmonary artery flows during 12 h of ESHP Please click here to view a larger version of this figure.
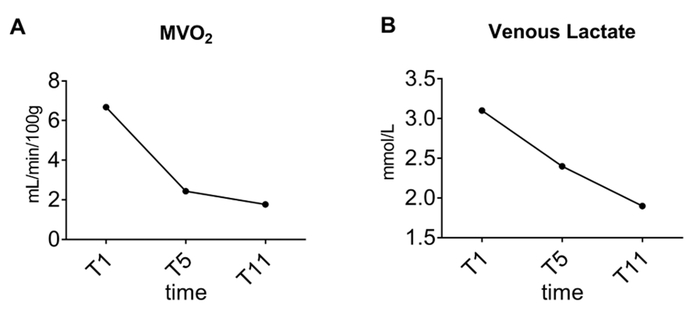
Figure 8: Trends over time. (A) Myocardial oxygen consumption and (B) venous lactate concentration during 12 h of ESHP Please click here to view a larger version of this figure.
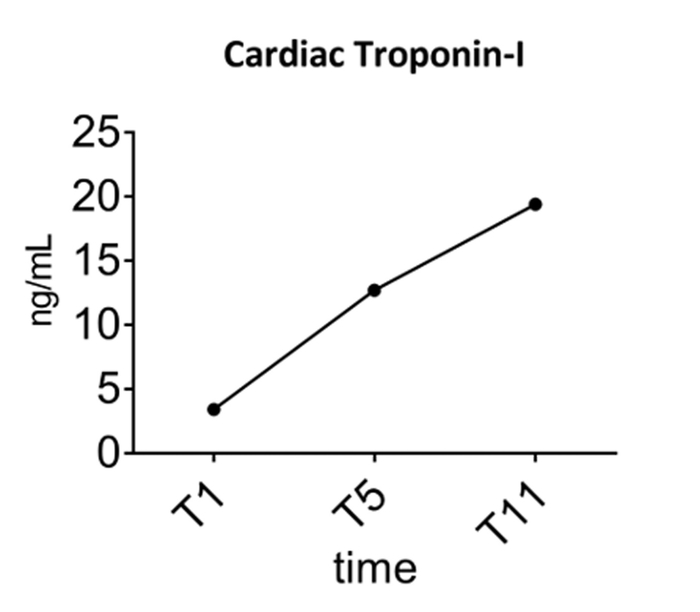
Figure 9: Trends over time in perfusate concentration of cardiac troponin-I during 12 h of ESHP. Please click here to view a larger version of this figure.
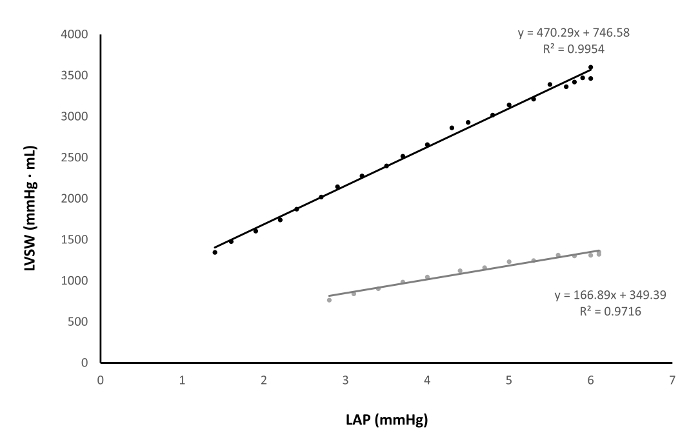
Figure 10: Assessment of preload recruitable stroke work a poorly-functioning heart (grey) versus a well-functioning heart (black). Please click here to view a larger version of this figure.
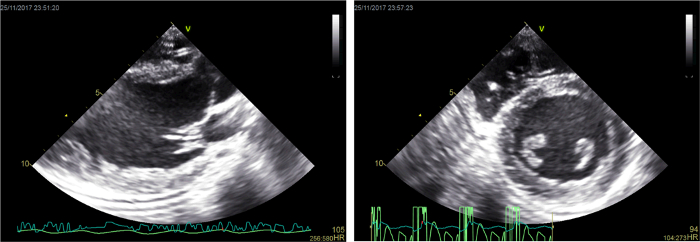
Figure 11: Representative two-dimensional echocardiographic images. Please click here to view a larger version of this figure.
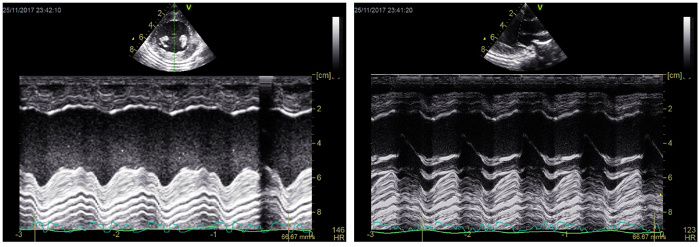
Figure 12: Representative M-mode echocardiographic images. Please click here to view a larger version of this figure.
| Aortic (arterial) parameters | PA (venous) parameters | ||||||
| T1 | T5 | T11 | T1 | T5 | T11 | ||
| Blood Gas values | |||||||
| pH | 7.28 | 7.44 | 7.33 | 7.25 | 4.42 | 7.30 | |
| pO2 (mmHg) | 123.00 | 149.00 | 141.00 | 44.00 | 55.40 | 57.80 | |
| pCO2 (mmHg) | 38.00 | 33.90 | 42.50 | 43.00 | 37.10 | 46.10 | |
| Oximetry Values | |||||||
| Hb (g/dL) | 4.20 | 4.10 | 3.90 | 4.20 | 4.10 | 3.90 | |
| sO2 (%) | 100.00 | 100.00 | 100.00 | 64.00 | 95.50 | 92.00 | |
| Electrolyte Values | |||||||
| K+ (mmol/L) | 4.20 | 4.60 | 5.20 | 4.20 | 4.60 | 5.20 | |
| Na+ (mmol/L) | 142.00 | 144.00 | 149.00 | 142.00 | 144.00 | 149.00 | |
| Ca2+ (mmol/L) | 1.02 | 1.20 | 1.40 | 1.02 | 1.20 | 1.40 | |
| Cl- (mmol/L) | 107.00 | 109.00 | 114.00 | 107.00 | 109.00 | 114.00 | |
| Osm (mmol/kg) | 291.30 | 292.50 | 302.40 | 291.90 | 292.90 | 302.40 | |
| Metabolite values | |||||||
| Glucose (mmol/L) | 7.00 | 5.30 | 5.10 | 7.00 | 5.20 | 5.00 | |
| Lactate (mmol/L) | 3.00 | 2.30 | 2.00 | 3.10 | 2.40 | 1.90 | |
| Acid Base status | |||||||
| Hco3- (mmol/L) | 17.60 | 23.10 | 21.90 | 18.50 | 23.70 | 22.40 | |
Table 1: A case of the blood gas analysis performed during the ex situ heart perfusion. Ca2+, calcium ion; Cl-, chloride ion; Hb, hemoglobin; HCO3-, bicarbonate ion; K+, potassium ion; Na+, sodium ion; Osm, osmolarity; paCO2, arterial partial pressure of carbon dioxide; paO2, arterial partial pressure of oxygen; sO2, oxygen saturation; T1, 1 h of ex situ perfusion (early perfusion); T5, 5 h of ex situ perfusion (mid-perfusion); T11, 11 h of ex situ perfusion (late perfusion)
| Time | |||
| Metabolic Parameters | T1 | T5 | T11 |
| MVO2 mL/min/100 g | 6.68 | 2.44 | 1.77 |
| Venous Lactate mmol/L | 3.1 | 2.4 | 1.9 |
| Venous - Arterial lactate difference mmol/L | 0.1 | 0.1 | -0.1 |
| Glucose Utilization g/h | 1.23 | 0.6 | 1.14 |
Table 2: Metabolic parameters calculated using the blood gas analysis data. MVO2, myocardial oxygen consumption; T1, 1 h of ex situ perfusion (early perfusion); T5, 5 h of ex situ perfusion (mid-perfusion); T11, 11 h of ex situ perfusion (late perfusion)
| Time | |||
| Functional Parameters | T1 | T5 | T11 |
| CI (mL/min/g) | 10.26 | 9.66 | 7.50 |
| SW (mmHg*mL) | 2253 | 1965 | 1323 |
| dP/dT max (mmHg/s) | 1781 | 1783 | 1482 |
| Sys p (mmHg) | 128 | 121 | 91 |
| ME (%) | 6.69 | 16.85 | 21.68 |
| PRSW | 399 | 348.38 | 248.63 |
| dP/dT min (mmHg/s) | -1444 | -2350 | -844 |
Table 3: A case of Left ventricular functional parameters assessed during ex situ heart perfusion. CI, cardiac index; dP/dT max, maximum rate of pressure change; dP/dT min, minimum rate of pressure change; ME, mechanical efficiency; PRSW, preload recruitable stroke work; SW, stroke work; Sys p, systolic pressure; T1, 1 h of ex situ perfusion (early perfusion); T5, 5 h of ex situ perfusion (mid-perfusion); T11, 11 h of ex situ perfusion (late perfusion).
Discussion
Successful perfusion is defined according to the aims of the study; however, this should include uninterrupted ESHP for the desired amount of time and complete collection of the data on cardiac function during the perfusion. For this purpose, a few critical steps in the protocol must be followed.
The heart is an organ with high oxygen and energy demands, and minimizing the ischemic time before cannulation and perfusion is an important principle that must be followed. The process of procurement, mounting the heart on the ESHP apparatus, and initiating perfusion should not exceed 20–30 min.
For efficient perfusion and reliable functional assessment, the process of mounting the heart on the apparatus bears critical importance. Proper anatomical alignment of the great vessels plays an important role in this regard. The heart should be procured with an adequate length of PA and Ao arch branches so that these vessels are not stretched when attached to the representative cannulae. From the start of the perfusion, efficient coronary perfusion plays a pivotal role in the protection of the heart during ex situ perfusion. After starting of the perfusion in non-working mode, the Ao pressure should be monitored and adjusted on at least 30 mmHg to support the coronary perfusion efficiently. The appearance of a dark deoxygenated perfusate in the PA line is a reflector of the reestablishment of coronary flow. After switching to the working mode, the Ao pressure should be adjusted to 40 mmHg to provide adequate coronary perfusion pressure for the working heart.
Deairing the heart chambers and Ao is essential for successful ESHP. At the time of attaching the LA cannula, squeezing the chambers will help in deairing the heart. Any air remaining inthe LV that is ejected should recirculate through the purge line in the innominate artery, which minimizes the risk of coronary air embolism. However, if substantial air remains in the left heart at the time of switching to the working mode, coronary air embolism is possible leading to a significant decline in myocardial function.
The goal of the presented approach is to provide a reproducible and reliable platform for experimental ESHP studies in large mammal models. Such a system provides the opportunity for perfusion in a physiologic working mode, and for extensive evaluation of the perfused heart. This provides an opportunity to evaluate cardioprotective protocols aimed at resuscitating dysfunctional donor organs. This system facilitates simple and reproducible assessments of cardiac functional parameters alongside metabolic parameters during ESHP, providing objective data that can be used to identify viable organs for transplantation. Such a comprehensive assessment is of particular importance when evaluating extended criteria donated hearts and hearts donated after circulatory death. Moreover, according to our observations in the setting of experimental ESHP, hearts perfused in a working mode display superior preservation of systolic and diastolic function over time compared to hearts preserved in a Langendorff mode and may help extend the safe preservation time.
ESHP in a working mode is an efficient method to preserve the donated heart and assess its viability, yet it is an artificial setting, lacking many of physiologic aspect of the body (e.g. real-time hormonal and nutritional balance/support, and free radical scavenging systems). The heart is an organ with sophisticated energy/metabolic demands. Thus, providing consistent, efficient metabolic support to the heart perfused is critically important. We have observed a decline in the function of the ex situ perfused heart, particularly during extended perfusion times22. Such a decline may be reflective of metabolic inefficiencies affecting the function of working mode-perfused heart. More studies are warranted to characterize the optimal metabolic support for the heart during ESHP. An additional challenge is the complexity of working mode heart perfusion. Despite the enhanced simplicity of ESHP in this system, working mode perfusion should be performed by well-trained personnel.
The ESHP apparatus with the capacity to perform a comprehensive functional and metabolic assessment of the hearts in a large mammal model, offers great potential to develop translational therapeutic protocols to improve dysfunctional/suboptimal donated hearts. ESHP may serve as a platform to administer therapeutic interventions targeting a wide range of conditions (e.g. ischemia reperfusion injury), and evaluate their effects on the metabolic and functional parameters of the perfused heart12. Moreover, working mode ESHP may facilitate extension of the safe preservation interval, which may help to overcome geographic limitations of organ donation and facilitate better allocation of donated hearts.
Disclosures
DHF holds patents on ex situ organ perfusion technology and methods. DHF and JN are founders and major shareholders of Tevosol, Inc.
Acknowledgements
This work was supported by grants from the Canadian National Transplant Research Program. SH is the recipient of a Faculty of Medicine and Dentistry Motyl Graduate Studentship in Cardiac Sciences. DHF is a recipient of a Collaborative Research Projects (CHRP) grant in aid from the National Sciences and Engineering Research Council and Canadian Institutes of Health Research.
Materials
| Name | Company | Catalog Number | Comments |
|---|---|---|---|
| Debakey-Metzenbaum dissecting scissors | Pilling | 342202 | |
| MAYO dissecting scissors | Pilling | 460420 | |
| THUMB forceps | Pilling | 465165 | |
| Debakey straight vascular tissue forceps | Pilling | 351808 | |
| CUSHING Gutschdressing forceps | Pilling | 466200 | |
| JOHNSON needle holder | Pilling | 510312 | |
| DERF needle holder | Pilling | 443120 | |
| Sternal saw | Stryker | 6207 | |
| Sternal retractor | Pilling | 341162 | |
| Vorse tubing clamp | Pilling | 351377 | |
| MORRIS ascending aorta clamp | Pilling | 353617 | |
| Surgical snare (tourniquet) set | Medtronic | CVR79013 | |
| 2-0 SILK black 12" x 18" strands | ETHICON | A185H | |
| 3-0 PROLENE blue 18" PS-2 cutting | ETHICON | 8687H | |
| Biomedicus pump drive (modified) | Medtronic | 540 | Modified to allow remote electronic control of pump speed |
| Biomedicus pump | Maquet | BPX-80 | |
| Membrane oxigenator D 905 | SORIN GROUP | 50513 | |
| Tubing flow module | Transonic | Ts410 | |
| PXL clamp-on flow sensor | Transonic | ME9PXL-BL37SF | |
| TruWave pressure transducer | Edwards | VSYPX272 | |
| Intercept tubing 3/8" x 3/32" xX 6' | Medtronic | 3506 | |
| Intercept tubing 1/4" x 1/16" x 8' | Medtronic | 3108 | |
| Heated/Refrigerated Bath Circulator | Grant | TX-150 | |
| ABL 800 FLEX Blood Gas Analyzer | Radiometer | 989-963 | |
| DLP cardioplegia cannula (aortic root cannula) | Medtronics | 20613994495406 | |
| 5F Ventriculr straight pigtail cathter | CORDIS | 534550S | |
| 5F AVANTI+ Sheath Introducer | CORDIS | 504605A | |
| Emerald Amplatz Guidewire | CORDIS | 502571A | |
| Dual chamber pace maker | Medtronic | 5388 | |
| Defibrilltor | CodeMaster | M1722B | |
| Infusion pump | Baxter | AS50 | |
| Surgical electrocautery device | Kls Martin | ME411 | |
| Gas mixer | SECHRIST | 3500 CP-G | |
| Medical oxygen tank | praxair | 2014408 | |
| Cabon dioxide tank | praxair | 5823115 | |
| Bovine serum albumin | MP biomedicals | 218057791 |
References
- Ardehali, A., et al. Ex-vivo perfusion of donor hearts for human heart transplantation (PROCEED II): a prospective, open-label, multicentre, randomised non-inferiority trial. Lancet. 385 (9987), 2577-2584 (2015).
- Collins, M. J., Moainie, S. L., Griffith, B. P., Poston, R. S. Preserving and evaluating hearts with ex vivo machine perfusion: An avenue to improve early graft performance and expand the donor pool. European Journal of Cardiothoracic Surgery. 34 (2), 318-325 (2008).
- Freed, D. H., White, C. W. Donor heart preservation: Straight up, or on the rocks? Lancet. 385 (9987), 2552-2554 (2015).
- Guibert, E. E., et al. Organ preservation: Current concepts and new strategies for the next decade. Transfusion Medicine and Hemotherapy. 38 (2), 125-142 (2011).
- Collins, M. J., et al. Use of diffusion tensor imaging to predict myocardial viability after warm global ischemia: Possible avenue for use of non-beating donor hearts. Journal of Heart and Lung Transplantation. 26 (4), 376-383 (2007).
- White, C. W., et al. A cardioprotective preservation strategy employing ex vivo heart perfusion facilitates successful transplant of donor hearts after cardiocirculatory death. Journal of Heart and Lung Transplantation. 32 (7), 734-743 (2013).
- Iyer, A., et al. Normothermic ex vivo perfusion provides superior organ preservation and enables viability assessment of hearts from DCD donors. American Journal of Transplantation. 15 (2), 371-380 (2015).
- Peltz, M., et al. Perfusion preservation maintains myocardial ATP levels and reduces apoptosis in an ex vivo rat heart transplantation model. Surgery. 138 (4), 795-805 (2005).
- Liao, R., Podesser, B. K., Lim, C. C. The continuing evolution of the Langendorff and ejecting murine heart: New advances in cardiac phenotyping. American Journal of Physiology-Heart and Circulatory Physiology. 303 (2), H156-H167 (2012).
- Rivard, L., Gallegos, R., Ogden, I., Bianco, R. Perfusion Preservation of the Donor Heart: Basic Science to Pre-Clinical. Journal of Extra Corporeal Technology. 41 (3), 140-148 (2009).
- Dhital, K. K., et al. Adult heart transplantation with distant procurement and ex vivo preservation of donor hearts after circulatory death: A case series. Lancet. 385 (9987), 2585-2591 (2015).
- Messer, S., Ardehali, A., Tsui, S. Normothermic donor heart perfusion: Current clinical experience and the future. Transplant International. 28 (6), 634-642 (2015).
- White, C. W., et al. Assessment of donor heart viability during ex vivo heart perfusion. Canadian Journal of Physiology and Pharmacology. 93 (10), 893-901 (2015).
- Messer, S. J., et al. Functional assessment and transplantation of the donor heart after circulatory death. Journal of Heart and Lung Transplantation. 35 (12), 1443-1452 (2016).
- Hatami, S., et al. Endoplasmic reticulum stress in ex vivo heart prfusion: A comparison between working vs non-working modes. Canadian Journal of cardiology. 33 (10), (2017).
- White, C. W., et al. Ex vivo perfusion in a loaded state improves the preservation of donor heart function. Canadian Journal of cardiology. 31 (10), s202(2015).
- White, C. W., et al. A wholeblood-based perfusate provides superior preservation of myocardial function during ex vivo heart perfusion. Journal of Heart and Lung Transplantation. (14), (2014).
- Lips, D. J., et al. Left ventricular pressure-volume measurements in mice: comparison of closed-chest versus open-chest approach. Basic Research in Cardiology. 99 (5), 351-359 (2004).
- Morita, S. Is there a crystal ball for predicting the outcome of cardiomyopathy surgery? Preload recruitable stroke work, may be a possible candidate. Journal of Cardiology. 71 (4), 325-326 (2018).
- Hatami, S., et al. Canadian Society for Transplantation. , Halifax. (2017).
- Anthony, C., et al. Ex vivo coronary angiographic evaluation of a beating donor heart. Circulation. 130 (25), e341-e343 (2014).
- Sandha, J. K., et al. Steroids Limit Myocardial Edema During Ex vivo Perfusion Of Hearts Donated After Circulatory Death. Annals of Thoracic Surgery. , (2018).
Reprints and Permissions
