1. Calibration and validation
NOTE: For the pigment calibration, prepare dilution rows from stock solutions of chla and B-PE. The chla stock solution is diluted with acetone and B-PE is diluted with distilled sterile water. Later, 15 mL of each dilution step will be needed. Protect the pigments from light by wrapping them with aluminum foil. Store the chla in a freezer and the B-PE in a refrigerator until further use. A detailed protocol for the dilution row follows in sections 1.1 for chla and 1.2 for B-PE. Both the chla and the B-PE laboratory calibration for pigment detection and quantification with the L.I.F.E. instrument is described below. A previous calibration24 was made with the same pigments as in this study.
- Chlorophylla dilution row
- Dissolve 1 mg of chla (purified from A. nidulans algae) with acetone in a 50 mL sample tube and dilute this chla stock solution with acetone to the following final concentrations: 1,000; 800; 640; 320; 160; 80; 40; 20; 10; 5; 1; and 0.5 ng/mL.
- Transfer 15 mL of each dilution into 50 mL sample tubes and cover them in aluminum foil due to light sensitivity. Store the tubes in a -20 °C freezer until the calibration measurements are taken.
NOTE: The protocol can be interrupted here. - Measure the chla absorption features from each dilution in a double-beam spectrophotometer as triplicates and calculate the chla content as described by Lorenzen25, which will be described in detail in section 2.2.2.
- PE dilution row
- Dilute a 4 mg/mL B-PE stock solution with sterile filtered water (pH = 7) to the following final concentrations: 1,000; 800; 640; 320; 160; 80; 40; 20; 10; and 5 ng/mL B-PE. Transfer 15 mL of each dilution in a 50 mL sample tube and cover it with aluminum foil. Store at 4 °C until further use.
NOTE: The protocol can be interrupted here.
- Dilute a 4 mg/mL B-PE stock solution with sterile filtered water (pH = 7) to the following final concentrations: 1,000; 800; 640; 320; 160; 80; 40; 20; 10; and 5 ng/mL B-PE. Transfer 15 mL of each dilution in a 50 mL sample tube and cover it with aluminum foil. Store at 4 °C until further use.
- Setup for calibration
- Build a rack as shown in Figure 5 to establish three measurement platforms, each 1.5 cm higher than the next.
NOTE: The rack and column height play an important role for the measurements because the surface of the liquids should remain in the focal point of the L.I.F.E. instrument as indicated in Figure 5. - Add 5 mL of the highest concentrated dilution in a polyscintillation plastic vial and put it on the highest point of the rack. Measure the fluorescence intensity.
- Place the vial in the middle position of the rack and add another 5 mL (10 mL total volume). Measure the fluorescence intensity. Repeat the procedure at the lowest position on the rack with another 5 mL (15 mL total volume; total of 45 mm in column height).
NOTE: Adapt the exposure time for each dilution step to prevent detector saturation (gray values over 255 in 12-bit images) and for a sufficient signal-to-noise ratio of the weak fluorescence signals. - Repeat steps 1.3.2 and 1.3.3 with all dilutions (steps 1.1.1 and 1.2.1) of chla and B-PE.
- Load the generated data files into the data reduction wizard to automatically count and sum up the gray values from each pixel line along the Y-axis (spatial distribution).
NOTE: Varying exposure times are compensated automatically by normalizing the fluorescence intensity to an integration time of 1 s. - Calculate the pigment area density with a Poisson regression analysis using the known concentrations from the dilution series and the normalized fluorescence intensities that were calculated. Then normalize the fluorescence counts from the three different column heights to 1.5 cm (5 mL) by multiplying the counts from each column height with a factor (factors 1, 0.5, and 0.33, for the 5 mL, 10 mL, and 15 mL concentration solutions, respectively).
- Build a rack as shown in Figure 5 to establish three measurement platforms, each 1.5 cm higher than the next.
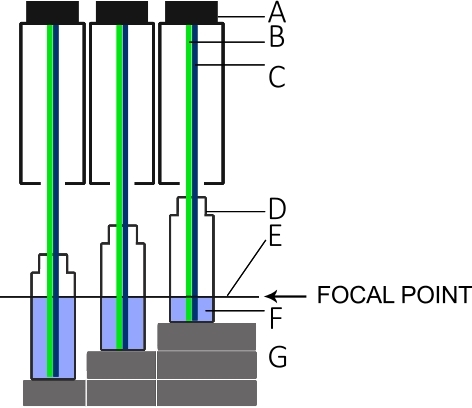
Figure 5: Setup for the L.I.F.E. calibration with chla and B-PE under laboratory conditions.
(A) Lens tube of the instrument. (B) Green laser for B-PE excitation. (C) Blue laser for chla excitation. (D) Scintillation vial. (E) Focal point of the L.I.F.E. instrument. (F) B-PE/water or chla/acetone solution with 5 mL, 10 mL, and 15 mL. (G) Spacers that keep the surface of each solution at the focal plane for three different volumes. Please click here to view a larger version of this figure.
2. Sampling and sample processing
- Collection of snow and ice
- Collect snow and supraglacial ice from a glacier into sterile polyethylene bags and store them frozen until further processing.
NOTE: For this study, the samples were collected at Midtre Lovenbreen (MLB), a polythermal glacier near the research village Ny-Ålesund in the high Arctic Archipelago of Svalbard (78°53’ N, 12°03’ E). - Sample bacterial mats from the glacier forefield into sterile polyethylene bags and transport all samples to a laboratory for further processing.
- Melt frozen material slowly in the dark at 4 °C. Filter liquid samples on GF/F filters (47 mm diameter) and note the filtered volume. Keep the filters frozen until further processing.
- Collect snow and supraglacial ice from a glacier into sterile polyethylene bags and store them frozen until further processing.
- Chlorophylla measurements
- Using the L.I.F.E. instrument, measure the filter in four random areas, each in triplicates using the green and blue laser. Calculate the overall pigment concentration by multiplying the area density with the filtered area and filtered volume. Normalize the pigment concentration (µg/L) to a volume of 1 L.
- Assess the chla contents of the GF/F filters with a laboratory standard according to the protocol by Lorenzen25. To do so, put each of the filters in a vial with 13 mL of acetone and store them in the dark at 4 °C overnight. Next, take a vial and place it on ice before sonication for 2 min at 50% power in continuous mode. Squeeze and remove the filter from the vial.
- Attach tygon tubing to a syringe and remove the chla extraction-acetone mix from the vial. Replace the tygon tubing with a GF-5 filter holder. Transfer the solution into a quartz cuvette.
- After calibrating the absorbance spectrometer for acetone, place the sample in the cuvette into the spectrometer and measure the absorbance features between 400–750 nm. Next, remove the cuvette from the spectrometer and add 200 µL of 2 M HCl to the sample. Then, repeat the absorbance measurement to measure the phaeophytin content in the sample.
- Measurement of microbial activity via radiolabelled markers and impact of laser intensity and exposure time on productivity rates
CAUTION: Beware of the marker radioactivity (β-radiation). Use a laboratory coat, gloves, and goggles, and work under a fume hood in a licensed isotope lab.- For bacterial production transfer five aliquots of bacterial mats into sterile polyethylene bags. Inactivate the controls with formaldehyde to a 4% final concentration.
NOTE: Three aliquots are used for the 3H-labeled leucine uptake and two aliquots are used as controls. - Expose the mats with a blue laser (405 nm, 5 mW) and with a green laser (532 nm, 5 mW) for 10 s and 30 s each. Repeat the procedure with 50 mW lasers. Then, inactivate the samples that were not treated with formaldehyde.
NOTE: One mat is used for only one laser exposure. Use non-exposed microbial mats as controls. - After the laser treatment, estimate the bacterial and primary production by incorporating 3H-leucine and NaH14CO3, respectively. For bacterial production measurements, use five aliquots per sample (20 mL) and add formaline (4% final concentration) to two of the parallels, which serve as controls for the abiotic incorporation of the marker. Add 3H-leucine (40 nM) to all samples of the various treatments and incubate them for 4 h under in situ conditions (0.1 °C). Terminate the reaction by adding formaline to the remaining live samples.
- For bacterial production of bacterial mats, transfer labelled samples into cryovials. Extract cells with 5% trichloroacetic acid and centrifuge at 10,000 x g for 5 min according to the protocols by Kirchman26 and Bell27. Add scintillation liquid and put the cryovial into a polyscintillation vial. Analyze the samples with a liquid scintillation counter and calculate the uptake rates.
NOTE: Three aliquots are used for the 3H-labeled leucine uptake, two aliquots are used as controls. - For primary production, prepare five replicates of various treatments (100 mL), wrap two of them into aluminum foil to mimic the dark samples, and add NaH14CO3 (1 µCi) to all. Incubate for 4 h in the ambient light and in situ temperature (0.1 °C). Terminate the reaction by darkening the remaining three replicates and filter the sample onto GF/F filters (25 mm diameter).
- Add 100 µL of 2 N HCl to the filters to remove all excess carbon and let it air out under the fume hood. Dry the samples on a heating plate at 80 °C and place samples into polyscintillation vials.
- To measure radioactive disintegrations per minute (dpm) of all treatments of primary and bacterial production, place the cryovials into polyscintillation vials and add 5 mL of scintillation cocktail. Measure dpm with a liquid scintillation counter and calculate the uptake rates.
- For bacterial production transfer five aliquots of bacterial mats into sterile polyethylene bags. Inactivate the controls with formaldehyde to a 4% final concentration.
Laboratory calibration for B-PE
The response signals of the B-PE dilution row were measured with the L.I.F.E. instrument in a dark room at 20 °C (Figure 6). The count rate depended on both the concentration and the column height of the measured sample. Low concentration and low column height B-PE specimen fluoresced stronger compared to samples of the same concentration and higher column height.
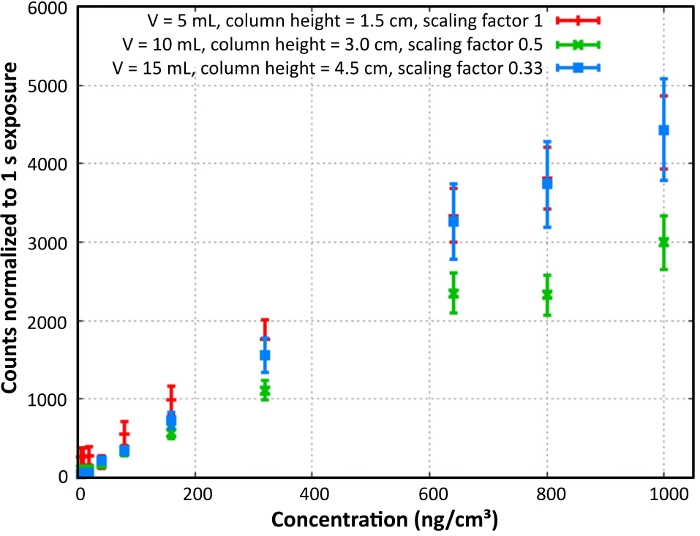
Figure 6: B-PE laboratory calibration. B-PE content and column density calibration is shown. Normalized count rates were calculated for a column height of 1.5 cm. Reprint with permission28. Please click here to view a larger version of this figure.
A Poisson regression was used for the final calibration line fit. There was a linear correlation between the area densities and pixel gray value counts. The function of the curve was y = 81.04x (Figure 7), which means that a gray value count rate of 8,104 in a 1 s exposed sample equaled an area density of 100 ng/cm2 B-PE. The chla calibration is set up in an analogue manner. The function was y = 8.94x.
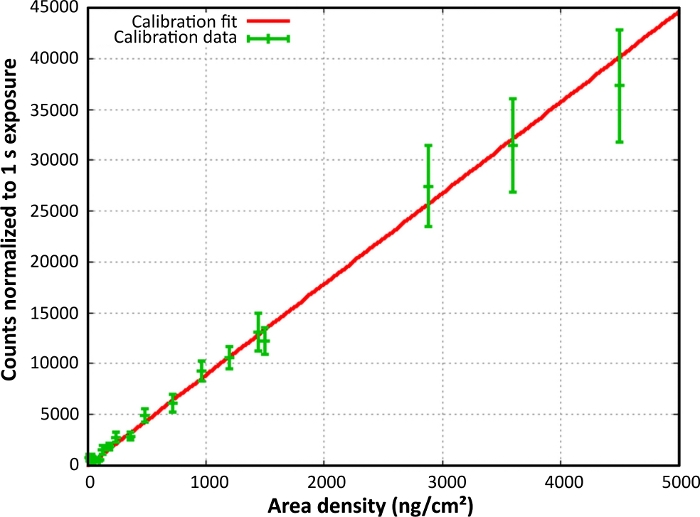
Figure 7: Final calibration curve for B-PE. The gray value counts were normalized to an exposure time of 1 s and plotted against the area density. Reprint with permission28. Please click here to view a larger version of this figure.
Application on cryoconite samples from Svalbard and laboratory validation of data
The mean values of the L.I.F.E. measurements and the single measurements of the same samples derived from conventional extraction using acetone and subsequent analysis with a spectrophotometer are illustrated in Figure 8.
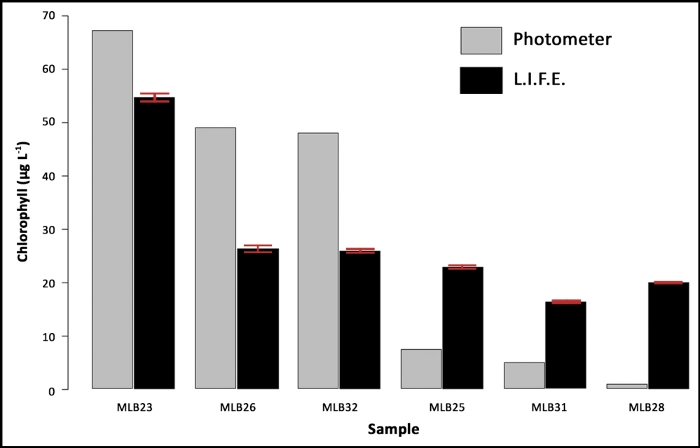
Figure 8: Data validation with natural samples. The samples (MLB) are ranked by chla content, based on the results of a laboratory spectrophotometer (single values) and compared with the chla fluorescence data measured on four random areas per filter. The error bars represent the standard deviation of the L.I.F.E. measurements. Please click here to view a larger version of this figure.
Chla contents ranging from 48 µg/L–67 µg/L were underestimated, and lower chla contents ranging from 0.7 µg/L–7 µg/L were overestimated by the L.I.F.E. prototype. The standard deviations from the L.I.F.E. measurements were low.
Comparison of spectral data from in situ measurements with laboratory standards
Chla spectra were comparable between cryoconite samples and those from purified from A. nidulans algae. The fluorescence peaks in all samples were located at 700 nm–710 nm. However, spectra derived from cryoconite samples showed higher noise signals between 400 nm–650 nm and from 800 nm–1,000 nm compared to spectra of the chla pigment standard (Figure 9).
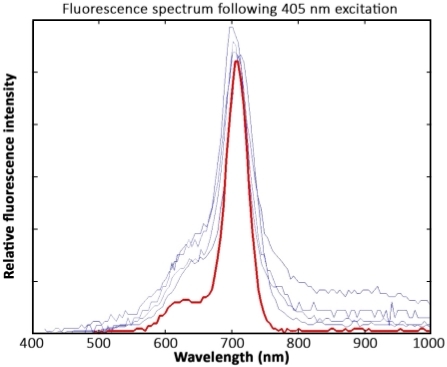
Figure 9: Spectral data interpretation. Measurements of four cryoconite granules (blue) and a chla standard pigment solution (red) after excitation with 405 nm lasers. The spectra were recorded 1 year after sample collection. The samples were kept frozen and were not exposed to light prior to the measurement. In response to wavelength calibration issues, the fluorescence peak is located at 700 nm–710 nm instead of 680 nm. Please click here to view a larger version of this figure.
Automated cryoconite grain analysis
In an example of an automated analysis of a cryoconite hole (Figure 10), the highest pigment area densities were observed at pixel line 50. The sample spectrum after excitation with a 532 nm laser showed a peak with a cut off at a gray value of 255 in response to oversaturation of the sensor. This peak derived from the green laser and not from the fluorescent signal.
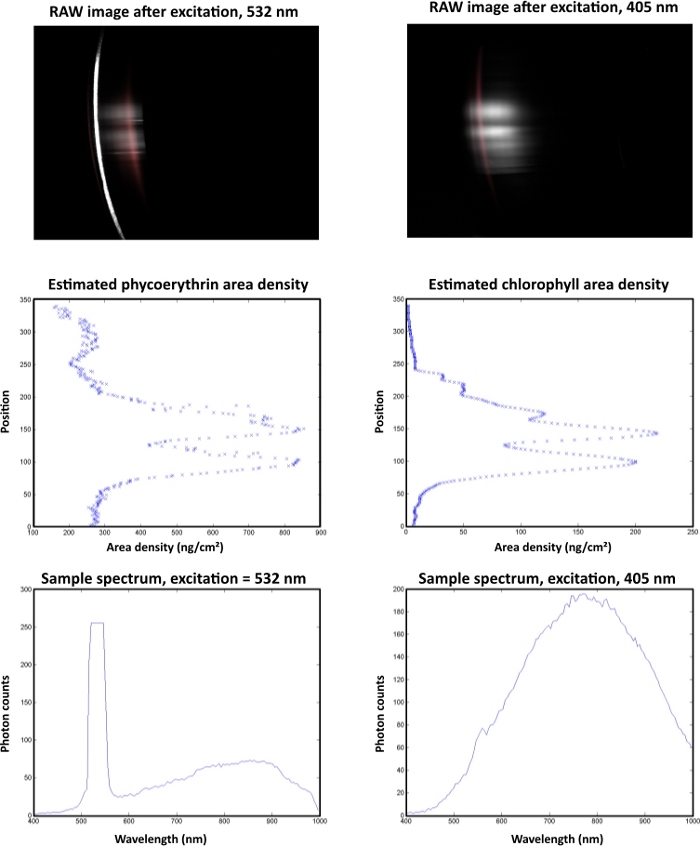
Figure 10: Automated data analysis of a single cryoconite granule with a diameter of 1 mm. The sample was collected at Vestre Brøggerbreen (VBB) and measured within 4 h after sampling in a dark laboratory room at the Arctic Station (GB) facility in Ny-Ålesund. The left column shows B-PE measurements and the right column represents chla data. The raw images are displayed on top. Laser-induced fluorescence responses are displayed in gray. Red areas indicate the response from standard pigments. The middle section illustrates the spatial distribution of the target pigments. The spectral properties of the fluorescence signal are displayed in the lower images. Please click here to view a larger version of this figure.
Impact of laser excitation on productivity in bacterial mats
Neither primary nor bacterial productivity were affected when increasing the power of the laser and/or the exposure time (Figure 11). No significant differences were detected under laser treatments with increased power.
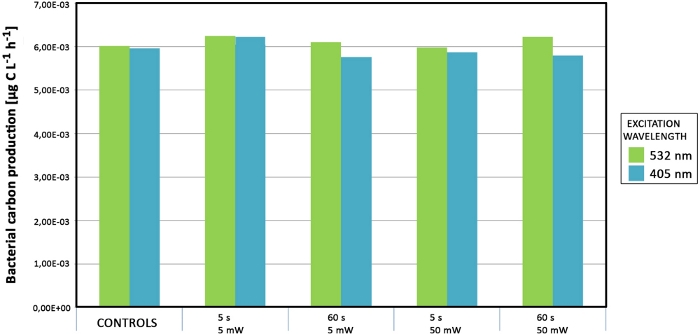
Figure 11: Productivity measurements of samples from Svalbard. Bacterial mats were exposed with green and blue lasers of varying laser intensities and exposure times. The data are colored according to the laser wavelength source (green and blue). Please click here to view a larger version of this figure.