This animal model enables researchers to induce statistically significant secondary lymphedema in the hindlimb of mice, lasting at least 8 weeks. The model can be used to study the pathophysiology of lymphedema and to investigate novel treatment options.
Animal models are of paramount importance in the research of lymphedema in order to understand the pathophysiology of the disease but also to explore potential treatment options. This mouse model allows researchers to induce significant lymphedema lasting at least 8 weeks. Lymphedema is induced using a combination of fractioned radiotherapy and surgical ablation of lymphatics. This model requires that the mice get a dose of 10 Gray (Gy) radiation before and after surgery. The surgical part of the model involves ligation of three lymph vessels and extraction of two lymph nodes from the mouse hindlimb. Having access to microsurgical tools and a microscope is essential, due to the small anatomical structures of mice. The advantage of this model is that it results in statistically significant lymphedema, which provides a good basis for evaluating different treatment options. It is also a great and easily available option for microsurgical training. The limitation of this model is that the procedure can be time consuming, especially if not practiced in advance. The model results in objectively quantifiable lymphedema in mice, without causing severe morbidity and has been tested in three separate projects.
Lymphedema is characterized by an accumulation of lymph fluid that leads to localized tissue swelling, which mainly occurs due to impaired or disrupted flow of lymph fluid in the lymphatic vessels1. The lymph flow can be impaired or disrupted by infection, obstruction, injury or congenital defects in the lymphatic system2. These etiologies result in accumulation of lymphatic fluid, which leads to a chronic state of inflammation, resulting in subsequent fibrosis, as well as deposition of adipose tissue3. Lymphedema can be categorized as primary or secondary lymphedema. Primary lymphedema is caused by developmental abnormalities or genetic mutation2,4. Secondary lymphedema occurs due to underlying systemic disease, surgery or trauma2,4. Secondary lymphedema is the most common form of lymphedema in the world2. In developed countries, the most common cause of secondary lymphedema is oncological therapy such as adjuvant radiotherapy and lymph node dissection5. Lymphedema is most frequent among breast cancer patients, but can also develop in patients with gynecologic, melanoma, genitourinary or neck cancer6. It has been suggested that out of all women diagnosed with breast cancer, 21% will develop lymphedema7.
Lymphedema can be stressful to the patient both physically and psychologically. Patients with lymphedema have an increased risk of infection5,8,9, poor quality of life and can develop social anxiety and symptoms of depression10. The complications of chronic lymphedema lead to high cost of care and an increased disease burden9,11. Findings have also suggested that lymphedema might be associated with increased risk of death after breast cancer treatment12. Conservative management such as compression of the affected area, manual lymph drainage and general skincare remain the first line approach. There is currently no curative treatment6. Although progress has been made in the field of surgical and medical therapy, there is still room for improvement. More research, providing insight in the pathophysiology and progression of the disease, is needed to enable clinicians to provide better treatment options for the patients5.
Animal models are being used in preclinical research to understand the pathophysiology of diseases and develop potential treatment options. Several different lymphedema animal models have been established in canines13,14, rabbits15, sheep16, pigs17,18 and rodents19,20,21,22,23,24. The rodent model seems to be the most cost-effective model, when investigating the reconstruction of lymphatic function, due to rodents being easily accessible and relatively low-priced25. The majority of the mice models have focused on inducing lymphedema in the tail of the mice21,22,23. The tail model is very reliable but the exact surgical technique for inducing lymphedema varies significantly in previous published material. This results in fluctuations in duration and robustness of the developed lymphedema presented in known litterature25. Different techniques are also being used for inducing lymphedema in the hindlimb model and they also yield varying results, but the hindlimb model might be easier to understand from a translational perspective. Previous lymphedema models have been hampered by spontaneous lymphedema resolution and therefore a reproducible and permanent lymphedema model is needed25. Researchers have previously tried to increase the dose of radiation, to prevent the spontaneous lymphedema resolution, but this has often led to subsequent severe morbidity25.
This model results in statistically significant lymphedema, without causing severe morbidity, by combining microsurgery with radiation. The model has been revised from a previous surgical model by adding a dose of irradiation that induces lymphedema, without causing severe morbidity26. It also offers a great opportunity for microsurgical training. Having access to microsurgical equipment and a microscope is necessary, due to the small anatomical structures of the mice. The surgical procedure can be performed when the user has been taught basic microsurgical techniques, such as suturing with microsurgical instruments. The operators that performed this procedure all watched tutorial videos by Acland on the preconditions of microsurgical skills (1981) and basic microsuture technique (1985). We recommend practicing the surgical procedure 8−10 times before using it in research. Practicing the procedure ensures that fewer mistakes are made and that the procedure can be performed more efficiently. When mastered, the surgical procedure can be performed in 45 minutes.
Animals were housed in the University of Southern Denmark Animal Care Facility as per institutional guidelines. All procedures involving animal subjects have been approved by The Animal Experiments Inspectorate, Ministry of Environment and Food of Denmark.
1. Pre-surgery irradiation
NOTE: Pre-surgery irradiation takes place 7 days before surgery.
2. Equipment setup
NOTE: Surgery should be performed in a room dedicated to surgical procedures. The operative surface must be sterile.
3. Preparation
4. Surgery
NOTE: In this example, the left hind limb (when the mouse is viewed in supine position), has been chosen for the procedure.
5. Postoperative care
6. Post-surgery irradiation
This procedure has previously been used in three separate experiments. All the experiments were made by different lead investigators who all are co-authors of this article. In all three experiments, great care was taken to adhere to the same procedure as described in this protocol. In all three experiments, secondary lymphedema was induced in one hindlimb while the other hindlimb served as a control. Volumes of the hindlimbs were the primary outcome in all three experiments. Figure 1 illustrates the study design.
All mice underwent micro-computed tomography (µCT) scans in the weeks following surgery to measure the volume of the hindlimbs. The µCT scans were performed on a multimodality pre-clinical scanner (Table of Materials) and the volume of the hindlimbs was measured via the region-of-interest (ROI) function in the associated software as previously described26. The distal tibiofibular joint was located in three-dimensional (3D) axonal images using a method previously described27. The ROI started at the distal tibiofibular joint and included all tissue distal to that point. The Hounsfield range for the analysis was set to -500 to 4000.
All data were analyzed using statistical software (Table of Materials). Sidak's multiple comparison test was used to compare the volume of the induced lymphedema hindlimb, with the control hindlimb. A significant difference between the control hindlimb and lymphedema hindlimb is defined as a P-value <0.05.
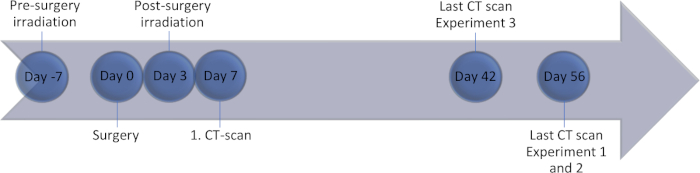
Figure 1: Study design and time points for outcome measurements. Please click here to view a larger version of this figure.
Experiment 126 included 32 mice distributed into groups of four. One of the objectives was to study several different doses of radiation and find the most preferable dose, for inducing lasting lymphedema without causing severe morbidity. The group that was given two doses of 10 Gy irradiation included four mice. Figure 2 shows that a consistent state of lymphedema was achieved in all 8 weeks. Table 1 shows that there was a significant difference in volume between the lymphedema hindlimb and control hindlimb in weeks 1, 7, and 8. While a consistent state of induced lymphedema was achieved, there was not a statistically significant difference between the hindlimbs during all 8 weeks. This outcome differs from the two other experiments and could be explained due to the relatively smaller sample size of four mice. Increasing the number of measurements would increase the power of the study and hereby the probability of detecting a difference if a difference exists28.
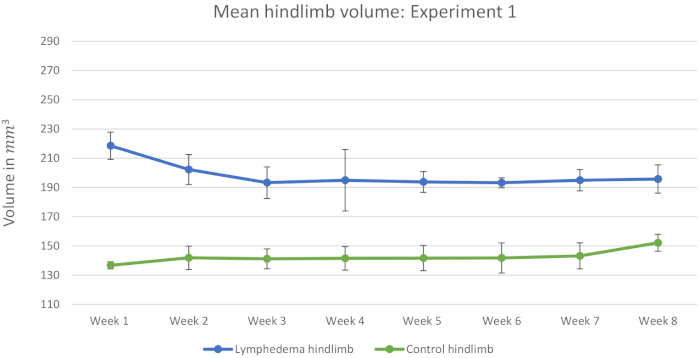
Figure 2: Mean hindlimb volume: Experiment 1. Measurements of 4 mice from the group that was given two doses of 10 Gy irradiation are included in this figure. This graph shows the mean hindlimb volumes in mm3 in the 8 weeks after surgery. All mice received a dose of 10 Gy irradiation pre- and post-surgery. The error bars represent the standard deviation (SD). Please click here to view a larger version of this figure.
Week | Lymphedema volume in mm3 (n = 4) | Control volume in mm3 (n = 4) | P-value | 95% Confidence interval |
1 | 218.53 ± 9.3 | 136.78 ± 2.48 | 0.002 | 53.77−109.73 |
2 | 202.25 ± 10.24 | 141.88 ± 8.02 | 0.066 | (-6.53)−127.28 |
3 | 193.28 ± 10.80 | 141.20 ± 6.80 | 0.060 | (-3.7)−107.85 |
4 | 194.95 ± 21.05 | 141.50 ± 8.03 | 0.224 | (-41.85)−148.75 |
5 | 193.75 ± 7.07 | 141.70 ± 8.60 | 0.051 | (-0.27)−104.37 |
6 | 193.23 ± 3.42 | 141.78 ± 10.29 | 0.054 | (-1.56)−104.46 |
7 | 194.95 ± 7.26 | 143.23 ± 8.90 | 0.050 | 0.17−103.28 |
8 | 195.8 ± 9.65 | 152.18 ± 5.81 | 0.009 | 19.88−67.38 |
Table 1: Sidak's multiple comparisons test: Experiment 1. This table shows the statistical comparison between the mean volumes of induced lymphedema hindlimbs and control hindlimbs during the 8 weeks after surgery. All mice received a dose of 10 Gy irradiation pre- and post-surgery. Values are presented as: mean ± SD in mm3. P-value < 0.05 is considered as a significant difference between the control hindlimb and lymphedema hindlimb. n (number of observations) = 4.
Experiment 2 included 45 mice. 15 mice served as controls and were given saline injections. The controls are used as representative results as we assume that the saline injections had no effect on the volume of induced lymphedema. Figure 3 shows that the lymphedema was less stable than in experiment 1. Additionally, the volume of the control hindlimbs increased during the 8 weeks. This decreases the relative difference presented in Table 2. It has been speculated that the mice use their non-operated hindlimb more, in the weeks following surgery, and that this leads to hypertrophy and increase in limb volume of the non-operated hindlimb. Most importantly, Table 3 shows that there is statistically significant difference between the lymphedema hindlimb and the control hindlimb during all 8 weeks after surgery. The higher number of mice proves that this procedure can induce statistically significant lymphedema for at least 8 weeks.
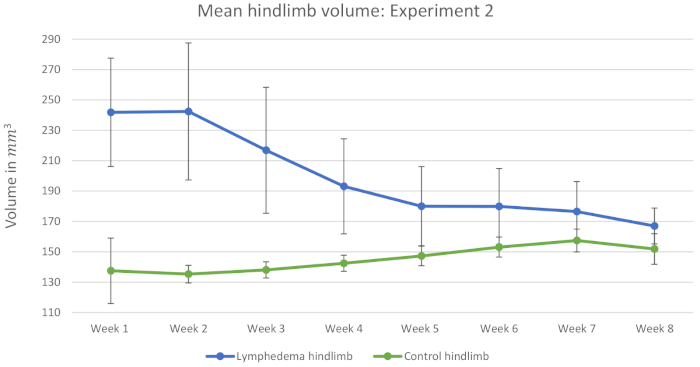
Figure 3: Mean hindlimb volume: Experiment 2. Measurements of 15 mice from the control group are included in this figure. This graph shows the mean hindlimb volumes in mm3 in the 8 weeks after surgery. All mice received a dose of 10 Gy irradiation pre- and post-surgery. The error bars represent SD. Please click here to view a larger version of this figure.
Experiment 1 | Experiment 2 | Experiment 3 | Experiment 1, 2 and 3 combined | |||||
Week | Absolute difference (mm3) | Relative difference (%) | Absolute difference (mm3) | Relative difference (%) | Absolute difference (mm3) | Relative difference (%) | Absolute difference (mm3) | Relative difference (%) |
1 | 81.75 ± 7.20 | 0.60 ± 0.04 | 104.34 ± 25.96 | 0.76 ± 0.23 | 85.20 ± 35.05 | 0.64 ± 0.27 | 94.02 ± 29.57 | 0.69 ± 0.24 |
2 | 60.38 ± 17.21 | 0.43 ± 0.14 | 107.12 ± 44.33 | 0.79 ± 0.33 | 85.63 ± 37.94 | 0.63 ± 0.29 | 92.77 ± 41.68 | 0.68 ± 0.31 |
3 | 52.08 ± 14.35 | 0.37 ± 0.11 | 78.77 ± 39.45 | 0.57 ± 0.28 | 74.67 ± 49.57 | 0.54 ± 0.38 | 73.74 ± 41.51 | 0.53 ± 0.31 |
4 | 53.45 ± 24.51 | 0.38 ± 0.19 | 50.67 ± 29.94 | 0.36 ± 0.21 | 50.62 ± 16.35 | 0.37 ± 0.11 | 51.01 ± 24.03 | 0.37 ± 0.17 |
5 | 52.05 ± 13.46 | 0.37 ± 0.11 | 32.74 ± 24.66 | 0.22 ± 0.17 | 42.67 ± 11.81 | 0.31 ± 0.07 | 39.08 ± 20.02 | 0.27 ± 0.14 |
6 | 51.45 ± 13.63 | 0.36 ± 0.11 | 26.80 ± 22.35 | 0.18 ± 0.14 | 32.86 ± 10.90 | 0.22 ± 0.08 | 32.32 ± 18.96 | 0.21 ± 0.13 |
7 | 51.73 ± 13.26 | 0.36 ± 0.11 | 19.04 ± 17.22 | 0.12 ± 0.11 | – | – | 25.92 ± 21.15 | 0.17 ± 0.15 |
8 | 43.63 ± 6.11 | 0.29 ± 0.04 | 15.15 ± 11.70 | 0.10 ± 0.08 | – | – | 21.15 ± 15.96 | 0.14 ± 0.10 |
Table 2: Absolute and relative difference. This table shows the absolute difference in volume between lymphedema- and control hindlimbs ± SD in mm3 and the relative difference ± SD in percent.
Week | Lymphedema volume in mm3 (n = 15) | Control volume in mm3 (n = 15) |
P-value | 95% Confidence interval |
1 | 241.82 ± 35.69 | 137.48 ± 21.54 | <0.001 | 82.21−126.47 |
2 | 242.41 ± 45.13 | 135.29 ± 5.81 | <0.001 | 69.33−144.89 |
3 | 216.85 ± 41.47 | 138.08 ± 5.31 | <0.001 | 45.15−112.39 |
4 | 193.10 ± 31.27 | 142.43 ± 5.29 | <0.001 | 25.15−76.18 |
5 | 180.03 ± 26.03 | 147.29 ± 6.45 | 0.002 | 11.72−53.76 |
6 | 179.89 ± 25.00 | 153.09 ± 6.56 | 0.004 | 7.74−45.85 |
7 | 176.45 ± 19.77 | 157.41 ± 7.49 | 0.008 | 4.35−33.71 |
8 | 166.97 ± 11.8 | 151.82 ± 10.07 | 0.002 | 5.18−25.12 |
Table 3: Sidak's multiple comparisons test: Experiment 2. This table shows the statistical comparison between the mean volumes of induced lymphedema hindlimbs and control hindlimbs in the 8 weeks after surgery. All mice received a dose of 10 Gy irradiation pre- and post-surgery. Values are presented as: mean ± SD in mm3. P-value < 0.05 is considered as a significant difference between the control hindlimb and lymphedema hindlimb. n (number of observations) = 15.
Experiment 3 included 36 mice. 12 mice served as controls and were given saline injections. The controls are used as representative outcome as we assume that the saline injections had no effect on the volume of induced lymphedema. In this experiment the hindlimb volume of the mice were measured for 6 weeks instead of 8. The experiment only lasted 6 weeks due to logistical difficulties when the experiment was performed. Figure 4 shows a more consistent lymphedema than experiment 2. Table 4 shows that there is statistically significant lymphedema in the 6 weeks after surgery.
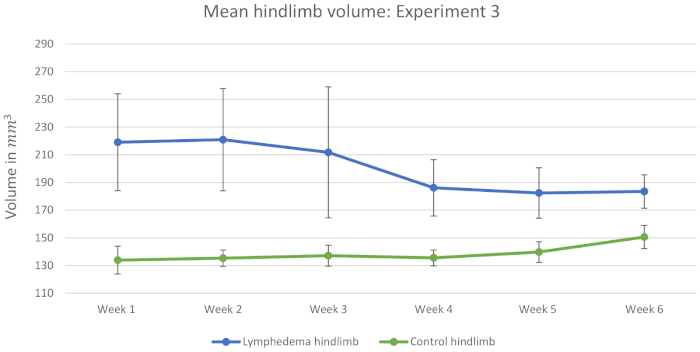
Figure 4: Mean hindlimb volume: Experiment 3. Measurements of 12 mice from the control group are included in this figure. This graph shows the mean hindlimb volumes in mm3 in the 6 weeks after surgery. All mice received a dose of 10 Gy irradiation pre- and post-surgery. The error bars represent SD. Please click here to view a larger version of this figure.
Week | Lymphedema volume in mm3 (n = 12) | Control volume in mm3 (n = 12) | P-value | 95% Confidence interval |
1 | 219.06 ± 35.00 | 133.86 ± 10.02 | <0.001 | 51.66−118.74 |
2 | 220.90 ± 36.98 | 135.27 ± 5.89 | <0.001 | 49.33−121.94 |
3 | 211.74 ± 47.30 | 137.07 ± 7.56 | 0.002 | 27.24−122.11 |
4 | 186.09 ± 20.36 | 135.47 ± 5.70 | <0.001 | 34.98−66.27 |
5 | 182.35 ± 18.25 | 139.68 ± 7.45 | <0.001 | 31.37−53.98 |
6 | 183.44 ± 12.11 | 150.58 ± 8.37 | <0.001 | 22.42−43.29 |
Table 4: Sidak's multiple comparisons test: Experiment 3. This table shows the statistical comparison between the mean volumes of induced lymphedema hindlimbs and control hindlimbs in the 6 weeks after surgery. All mice received a dose of 10 Gy irradiation pre- and post-surgery. Values are presented as: mean ± SD in mm3. P-value < 0.05 is considered as a significant difference between the control hindlimb and lymphedema hindlimb. n (number of observations) = 12.
Figure 5 and Table 5 shows the mean hindlimb volume of all three experiments combined. Table 5 shows that the use of this procedure results in statistically significant lymphedema lasting at least 8 weeks. Data from the first 6 weeks, are the combined measurements of 31 mice from experiments 1, 2 and 3. In week 7−8 we only had data from experiments 1 and 2 resulting in combined measurements from 19 mice.
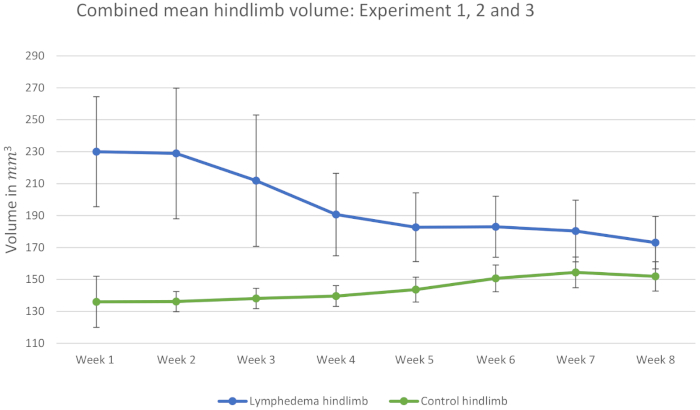
Figure 5: Combined mean hindlimb volume: Experiment 1, 2 and 3. Thirty-one mice included in the first 6 weeks after surgery and 19 mice included in the following 2 weeks. This graph shows the mean hindlimb volumes in mm3 in the 8 weeks after surgery. All mice received a dose of 10 Gy irradiation pre- and post-surgery. The error bars represent SD. Please click here to view a larger version of this figure.
Week | Lymphedema volume in mm3 (Week 1−6 n = 31) (Week 7−8 n = 19) |
Control volume in mm3 (Week 1−6 n = 31) (Week 7−8 n = 19) |
P-value | 95% Confidence interval |
1 | 230.00 ± 34.46 | 135.99 ± 16.03 | <0.001 | 78.19−109.84 |
2 | 228.90 ± 40.91 | 136.13 ± 6.32 | <0.001 | 70.47−115.07 |
3 | 211.83 ± 41.15 | 138.09 ± 6.36 | <0.001 | 51.53−95.95 |
4 | 190.63 ± 25.81 | 139.62 ± 6.54 | <0.001 | 38.15−63.87 |
5 | 182.70 ± 21.52 | 143.62 ± 7.79 | <0.001 | 28.36−49.79 |
6 | 182.98 ± 19.11 | 150.66 ± 8.36 | <0.001 | 22.18−42.47 |
7 | 180.34 ± 19.31 | 154.43 ± 9.60 | <0.001 | 11.61−40.22 |
8 | 173.04 ± 16.42 | 151.89 ± 9.19 | <0.001 | 10.35−31.94 |
Table 5: Sidak's multiple comparisons test: Experiment 1, 2 and 3 combined. This table shows the statistical comparison between the mean volumes of induced lymphedema hindlimbs and control hindlimbs of 31 mice in the first 6 weeks after surgery and 19 mice in the following 2 weeks. All mice received a dose of 10 Gy irradiation pre- and post-surgery. Values are presented as: mean ± SD in mm3. P-value < 0.05 is considered as a significant difference between the control hindlimb and lymphedema hindlimb. n (number of observations) = 31.
There are a few critical steps in this protocol. Firstly, it is important that the researchers take safety precautions when working with radioactivity. Secondly, during the surgical part of this protocol, it is important to start the procedure once the mouse has been anesthetized and finish it without unnecessary breaks. This is important to avoid an excessively long surgical period for the animal and to prevent that the anesthesia loses effect during surgery. It is recommended to only administer one bolus injection of anesthetic and complete the surgical procedure in one sitting. It is also a critical step, not to administer too much Patent Blue V, as excess Patent Blue V will discolor the tissue surrounding the lymph vessels. If the surrounding tissue gets discolored it can be nearly impossible to visualize the lymph vessels and this compromises the procedure. Even if one does manage to visualize the lymph vessels, the discolored tissue will make it hard to assess whether the Patent Blue V passes proximal to the ligature or not. This is problematic because the operator must be sure that the placed ligatures are constricting the lymph flow, to ensure that the procedure will be successful. It is also important to leave a gap of 2−3 mm when closing the wound. As a temporary skin gap is often needed to mimic the human wound healing process29.
The limitations of this method are that it is a time-consuming procedure that requires access to a microscope and previous microsurgical training. When performing the surgical part of this protocol, it is important to plan the time in-between the surgical procedures. A lot of time goes into waiting for the animal to be anesthetized, shaving the hindlimb and generally prepare for each surgical procedure. Therefore, it is recommended to prepare housing and anesthetic in advance. It is important to note that to be certain that chronic lymphedema has been induced, histopathology must be analyzed. We have not included histopathology in this article, which is a limitation. Without histopathology supporting the fact that histologic changes have happened to the lymph vessels the changes in volume in the hindlimbs can only be described as edema. The article that includes all data on the four mice from experiment 126 includes histopathology and shows that there were significant changes to the histopathology using this technique. The article also includes lymphatic imaging. The same procedure was used on the mice in experiment 2 and 3, but the histopathology showed no significant difference between lymphedema hindlimb and control hindlimb in these experiments. Further studies including histopathology are needed for this model to clarify whether lymphedema is induced on a histological level. Experiments 2 and 3 have not yet been published and we therefore cannot refer to them.
While using µCT scans to measure hindlimb volume can be argued to be more objective than using the water displacement method or circumferential measurements, it still has its limitations. The measuring technique is expensive, time-consuming and requires access to a µCT-scanner and analyzing software.
One of the biggest challenges with rodent lymphedema models in general, have been spontaneous lymphedema resolution, unless excessive radiation was performed25. When developing this model, we tested several different doses of radiation to find a dose that would induce lasting lymphedema without causing severe morbidity26. Previously, lymphedema models have not been standardized in the methods of lymphedema induction or outcome assessments. Oashi et al.20 used a single dose of 30 Gy irradiation, and ligated each lymphatic vessel at three separate points. In that study, the surgical procedure took 90 min to perform. Although the method presented in this article can be considered time-consuming, the surgical part of the procedure can still be performed approximately twice as fast as the method presented by Oashi et al.20. They also had a follow-up period of 6 months, which is considerably longer than any of the studies presented in this article. However, they only included one mouse and they manually measured limb circumference to assess the swelling, whereas the volumes presented in this article was measured on 31 mice using µCT scans and 3D analysis software. Komatsu et al.30 removed the inguinal lymph nodes and the associated peripheral lymph vessels and fat tissue using an electric knife. Using an electric knife might be a simpler approach which does not require microsurgical training, but the induced edema resolved after day 4 while the method presented in this article offers consistent lymphedema lasting at least 8 weeks.
This protocol will hopefully enable researchers to consider the limitations and advantages of the revised lymphedema model. The protocol should also assist researchers to successfully replicate the model. The method can be used in future observational and interventional studies to understand the pathophysiology of lymphedema and research novel treatment options. In future studies, it would also be interesting to have a follow-up longer than 8 weeks to observe just how long the induced lymphedema lasts. It would also be interesting to observe the effect of performing more targeted irradiation of the mice pre- and post-surgery. This could be done by performing a CT scan and planning a target volume. In future studies, this model could also be supported by fluorescence-guided lymphatic imaging, perometry or bioimpedance studies. This method offers statistically significant lymphedema lasting at least 8 weeks, which has been measured directly via CT volumetric in three separate experiments by different lead investigators.
The authors have nothing to disclose.
The authors thank Peter Bollen, head of the Biomedical Laboratory for lending the equipment needed to record the footage seen through the microscopes.
10-0 Nylon suture | S&T | 12051-10 | |
6-0 Nylon suture – Dafilon | B Braun | C0933112 | |
Coagulator – ICC 50 | ERBE | ||
Cotton tipped applicators | Yibon medical co | ||
Dissecting forceps | Lawton | 09-0190 | |
Elastic retractors | Odense University Hospital | ||
Electrical clipper | Aesculap | GT420 | |
Fentanyl 0,315 mg/ml | Matrix | ||
Heating pad – PhysioSuite | Kent Scientific Corp. | ||
Isoflurane 1000mg Attane | Scan Vet | ||
Isoflurane vaporizer – PPV | Penlon | ||
Micro jewler forceps | Lawton | 1405-05 | |
Micro Needle holder | Lawton | 25679-14 | |
Micro scissors | Lawton | 10128-15 | |
Micro tying forceps | Lawton | 43953-10 | |
Microfine U-40 syringe 0,5ml | BD | 328821 | |
Microlance syringe 25g | BD | ||
Microlance syringe 27g | BD | ||
Midazolam 5 mg/ml (hameln) | Matrix | ||
Needle holder – Circle wood | Lawton | 08-0065 | |
Non woven swabs | Selefa | ||
Opmi pico microscope F170 | Zeiss | ||
Patent blue V – 25 mg/ml | Guerbet | ||
Scissors – Joseph | BD | RH1630 | |
Siemens INVEON multimodality pre-clinical scanner | Siemens pre-clinical solutions | ||
Source of radiation – D3100 | Gulmay | ||
Stata Statistical Software: Release 15 | StataCorp LLC | ||
Temgesic – 0,2 mg | Indivior | ||
Vet eye ointment – viscotears | Bausch & Lomb |