Protein Arginine (R)-methylation is a wide-spread post-translational modification regulating multiple biological pathways. Mass spectrometry is the best technology to globally profile the R-methyl-proteome, when coupled to biochemical approaches for modified peptide enrichment. The workflow designed for the high confidence identification of global R-methylation in human cells is described here.
Method Article
A Mass Spectrometry-Based Proteomics Approach for Global and High-Confidence Protein R-Methylation Analysis
* These authors contributed equally
In This Article
Summary
Abstract
Protein Arginine (R)-methylation is a widespread protein post-translational modification (PTM) involved in the regulation of several cellular pathways, including RNA processing, signal transduction, DNA damage response, miRNA biogenesis, and translation.
In recent years, thanks to biochemical and analytical developments, mass spectrometry (MS)-based proteomics has emerged as the most effective strategy to characterize the cellular methyl-proteome with single-site resolution. However, identifying and profiling in vivo protein R-methylation by MS remains challenging and error-prone, mainly due to the substoichiometric nature of this modification and the presence of various amino acid substitutions and chemical methyl-esterification of acidic residues that are isobaric to methylation. Thus, enrichment methods to enhance the identification of R-methyl-peptides and orthogonal validation strategies to reduce False Discovery Rates (FDR) in methyl-proteomics studies are required.
Here, a protocol specifically designed for high-confidence R-methyl-peptides identification and quantitation from cellular samples is described, which couples metabolic labeling of cells with heavy isotope-encoded Methionine (hmSILAC) and dual protease in-solution digestion of whole cell extract, followed by off-line High-pH Reversed Phase (HpH-RP) chromatography fractionation and affinity enrichment of R-methyl-peptides using anti-pan-R-methyl antibodies. Upon high-resolution MS analysis, raw data are first processed with the MaxQuant software package and the results are then analyzed by hmSEEKER, a software designed for the in-depth search of MS peak pairs corresponding to light and heavy methyl-peptide within the MaxQuant output files.
Introduction
Arginine (R)-methylation is a post translational modification (PTM) that decorates around 1% of the mammalian proteome1. Protein Arginine Methyltransferases (PRMTs) are the enzymes catalyzing R-methylation reaction by the deposition of one or two methyl groups to the nitrogen (N) atoms of the guanidino group of the side chain of R in a symmetric or asymmetric manner. In mammals, PRMTs can be grouped into three classes-type I, type II, and type III-depending on their capability to deposit both mono-methylation (MMA) and asymmetric di-methylation (ADMA), MMA and symmetric di-methylation (SDMA) or only MMA, respectively2,3. PRMTs mainly target R residues located within glycine- and arginine-rich regions, known as GAR motifs, but some PRMTs, such as PRMT5 and CARM1, can methylate proline-glycine-methionine-rich (PGM) motifs4. R-methylation has emerged as a protein modulator of several biological processes, such as RNA splicing5, DNA repair6, miRNA biogenesis7, and translation2, fostering the research on this PTM.
Mass Spectrometry (MS) is recognized as the most effective technology to systematically study global R-methylation at protein-, peptide-, and site-resolution. However, this PTM requires some particular precautions for its high-confidence identification by MS. First, R-methylation is substoichiometric, with the unmodified form of the peptides being much more abundant than the modified ones, so that mass spectrometers operating in the Data Dependent Acquisition (DDA) mode will fragment high-intensity unmodified peptides more often than their lower-intensity methylated counterparts8. Moreover, most MS-based workflows for R-methylated site identification suffer from limitations at the bioinformatic analysis level. Indeed, the computational identification of methyl-peptides is prone to high False Discovery Rates (FDR), because this PTM is isobaric to various amino acid substitutions (e.g., glycine into alanine) and chemical modification, such as methyl-esterification of aspartate and glutamate9. Hence, methods based on the isotope labeling of methyl groups, such as Heavy Methyl Stable Isotope Labeling with Amino Acids in Cell culture (hmSILAC), have been implemented as orthogonal strategies for confident MS-identification of in vivo methylations, significantly reducing the rate of false positive annotations10.
Recently, various proteome-wide protocols to study R-methylated proteins have been optimized. The development of antibody-based strategies for the immuno-affinity enrichment of R-methyl-peptides has led to the annotation of several hundreds of R-methylated sites in human cells11,12. Furthermore, many studies3,13 reported that coupling antibody-based enrichment with peptide separation techniques such as HpH-RP chromatography fractionation can boost the overall number of methyl-peptides identified.
This article describes an experimental strategy designed for the systematic and high-confidence identification of R-methylated sites in human cells, based on various biochemical and analytical steps: protein extraction from hmSILAC-labeled cells, parallel double enzymatic digestion with Trypsin and LysargiNase proteases, followed by HpH-RP chromatographic fractionation of digested peptides, coupled with antibody-based immuno-affinity enrichment of MMA-, SDMA-, and ADMA-containing peptides. All affinity-enriched peptides are then analyzed by high-resolution Liquid Chromatography (LC)-MS/MS in DDA mode, and raw MS data are processed by MaxQuant algorithm for identificationof R-methyl-peptides. Finally, the MaxQuant output results are processed with hmSEEKER, an in-house developed bioinformatics tool to search pairs of heavy and light methyl-peptides. Briefly, hmSEEKER reads and filters methyl-peptides identifications from the msms file, then matches each methyl-peptide to its corresponding MS1 peak in the allPeptides file, and, finally, searches the peak of the heavy/light peptide counterpart. For each putative heavy-light pair, the Log2 H/L ratio (LogRatio), Retention Time difference (dRT), and Mass Error (ME) parameters are calculated, and doublets that are located within user-defined cut-offs are labeled as true positives. The workflow of the biochemical protocol is described in Figure 1.
Protocol
1. Cell culturing and protein extraction (time: 3 - 4 weeks required)
- Grow HeLa cells in parallel in media supplied with either Light (L) or Heavy (H) Methionine, respectively (see Table 1 for media composition). Upon at least eight cell divisions, collect an aliquot of cells from each SILAC channel and perform the incorporation test.
NOTE: To check for the incorporation efficiency, test by LC-MS/MS analysis that the percentage of heavy Methionine (Met-4) in the Heavy channel is as near as possible to 100%. Analyze an aliquot of heavy-labeled cells by LC-MS/MS (for settings see Table 2), then process the MS data with MaxQuant using the parameters indicated in Table 3. To check for the Met-4 incorporation an in-house developed script is available at https://bitbucket.org/EMassi/hmseeker/src/master/. - Consider heavy Methionine incorporation as complete when it reaches >97%. When each channel reaches a total number of about 60 x 106 of cells (corresponding to about 40 dishes of 15 cm each at 85% confluency for HeLa cells, with variations depending on the cell type) harvest them. Carefully count them, mix in 1:1 proportion and pellet by centrifugation at 335 x g for 5 min at 4 °C.
NOTE: To assess the proper 1:1 L/H mixing, keep an aliquot and run it on a slice of a gel which is known to contain a high abundance and heavily R-methylated protein (e.g., fibrillarin). If labeling has been successful and 1:1 mixing has been achieved, there should be a 1:1 ratio of light and heavy versions of the R-methylated peptides present in the sample. Alternatively, keep an aliquot of mixed sample to be analyzed by LC-MS/MS, then process the MS data with MaxQuant using the parameters indicated in Table 3 and plot the distribution of Log2 H/L ratio as depicted in Figure 2C. The protocol can be stopped here by snap-freezing the pellet and storing it at -80 °C. - Re-suspend the cell pellet in four volumes of Lysis Buffer (see Table 1 for Lysis Buffer composition) with respect to the cell pellet volume. For instance, use 6 mL of Lysis Buffer for a pellet from 120 x 106 Hela cells (60 x 106 Light + 60 x 106 Heavy) corresponding to 1.5 mL volume.
NOTE: Protein extraction must be performed at room temperature (RT) because Lysis Buffer contains the chaotropic agent 9 M Urea that precipitates at ice temperature; therefore, the addition of a broad spectrum of Serine and Cysteine protease inhibitors is important, as well as phosphatases inhibitor, to simultaneously protect proteins against proteolytic degradation and dephosphorylation, cocktail of protease and phosphatase inhibitors are commercially available as small tablets, see Table 1 and Table of Materials. - Sonicate the sample with a microtip cell disruptor sonicator for at least five cycles of 15 s ON and 30 s OFF, to ensure efficient breakage of cell membranes and DNA release and shearing. Check the viscosity of the extract by pipetting the solution up and down. If it is too viscous due to incomplete DNA shearing and membrane solubilization, repeat the sonication cycles.
NOTE: Ensure that the sample does not over-heat during sonication, because high temperature can damage proteins. However, it is not possible to put the sample on ice between sonication cycles, because of the presence of 9M Urea; hence, it is advisable to pause for 60 s OFF between different sonication cycles. Moreover, avoid the formation of air bubbles during sonication because they reduce the sonication efficacy. - Centrifuge the extract at 3,000 x g for 10 min at RT to pellet the debris and transfer the supernatant in a new 15 mL tube.
- Measure the protein content of the extract with a colorimetric assay, such as Bradford or bicinchoninic acid (BCA)14,15. An optimal starting amount of protein extract for this protocol is between 20-30 mg.
NOTE: Lysis buffers containing high concentration urea are compatible both with Bradford and BCA quantification assay; other types of Lysis buffer, such as those including high concentration of sodium dodecyl sulphate (SDS), are not compatible with Bradford.
2. Lysate digestion (indicative time required 2 hours)
- Perform reduction of thiol group (-SH) of proteins using a stock solution of dithiothreitol (DTT) dissolved in ultrapure water at a final concentration of 4.5 mM and let the reaction go for 30 min at 55 °C.
NOTE: It is possible to prepare 1 M stock DTT solution and store it at -20 °C for up to 1 month, thawing just the aliquots needed for each experiment. Alternatively, sulfhydryl reductant tris-(2-carboxyethyl)-phosphine (TCEP) can be used to perform reduction of -SH groups; especially for long-term storage of proteins, TCEP is significantly more stable than DTT without metal chelates such as EGTA in the buffer, whereas DTT is more stable if metal chelates are present16. - Perform alkylation of thiol group (-SH) of proteins by adding iodoacetamide (IAA) at a concentration of 10 mM and incubate for 15 min at RT in dark. Perform the incubation of extracted proteins with IAA solution in dark because IAA is photosensitive.
NOTE: The IAA stock solution at 100 mM should be prepared fresh before each experiment. Alternatively, chloroacetamide could be used to perform alkylation of -SH groups, especially if the goal of the experiment is to analyze cross-talk between methylation and ubiquitination because IAA-induced artefact mimics ubiquitination17. - Before proceeding with the protein digestion step, save an aliquot of protein extract (1/1,000 of starting undigested lysate) for subsequent analysis on SDS-PAGE Coomassie-stained gel and comparison with a corresponding amount of sample upon digestion; this test serves to verify the proteolysis efficiency (see point 4).
- Dilute the remaining protein extract with four volumes of 20 mM HEPES pH 8.0, to reach a final urea concentration of 2 M (which is the concentration compatible with the enzymatic activity of proteases). Split the sample into two parts: in the first add Sequencing Grade Modified Trypsin and in the second add LysargiNase protease (see Table of Materials) at 1:100 (w/w) proportion relative to the mg of starting material. Leave overnight at 37 °C in a thermomixer at 600 rpm, to allow enzymatic digestion.
NOTE: Trypsin, the most common digestion enzyme in proteomics, cleaves at the C-terminus of R and Lysine (K), generating peptides with a charge distribution that results in fragmentation spectra dominated by y-type ions upon collision-induced dissociation (CID). LysargiNase cleaves at the N-terminus of R and K, therefore, mirroring the Trypsin cleavage specificity and generating peptides that release mainly b-type ions upon CID fragmentation. This combined analysis leads to much increased peptide sequence coverage and in higher confidence in site-specific identification of R-methylations18.
3. Peptide purification (indicative time required 1 hour)
- Keep an aliquot of digested peptides from both reactions, collecting the same volumes as in point 2.3 for the comparison on SDS-PAGE Coomassie-stained gel to assess protease digestion efficiency (see point 4).
- Stop the digestion by acidifying the samples with the addition of trifluoroacetic acid (TFA) to a final concentration of 5%. Mix well and measure the samples pH with a litmus paper (pH should be around 3). Vortex briefly and spin down the acidified samples before transferring them into new 15 mL tubes.
- Clean up the samples through two C18 vac cartridge (sorbent weight 1 g, see Table of Materials), one for the sample digested with Trypsin and the other for the sample digested with LysargiNase. Prepare Solvent A, Solvent B, and Wash Buffer (see Table 1 for buffer composition).
- Using glass pipettes, rehydrate each cartridge with 6 mL of ACN 100% for 3 times. After that, equilibrate each cartridge sequentially with 3-9-18 mL of Solvent A. Load the samples (the resins should become yellow). Wash again sequentially with 3-9-18 mL of Solvent A and then add 6 mL of Wash buffer. Transfer each column into clean 15 mL tubes and elute the samples with 7 mL of Solvent B. Repeat the elution step with 7 mL of Solvent B, for a final volume of 14 mL.
NOTE: Perform all these steps by letting the buffers and solution pass through the columns by gravity. To favor the flow of the buffers through the column, push each solution slowly with a syringe, to mimic vacuum. - Save 50 µL of eluted peptides, 50 µL of flow-through (FT), 50 µL of the wash with Solvent A, and 50 µL of the last wash for the subsequent peptide assessment by SDS-PAGE (see point 4).
4. Coomassie-stained SDS-PAGE gel (indicative time required 2 hour)
- Run the collected aliquots on a 17.5% SDS-PAGE gel and stain with Instant-Blu Coomassie staining (see Table of Materials). The expected result is represented in Figure 2A.
5. Peptide lyophilization (indicative time 2 days)
- Cover the 15 mL tubes containing the eluted peptides with paraffin film, which is then punched with a 20 G needle to create 3-5 holes. Put the tubes in dry ice for at least 30 min, until the samples are completely frozen.
- Lyophilize the frozen fractions for 48 h, a time interval typically sufficient to ensure a complete lyophilization of the samples, even if some variability may occur, due to the freeze dryer performance.
NOTE: The experiment can be paused here, storing the lyophilized samples at -80 °C.
6. Off-line HpH-RP chromatographic fractionation of peptides (indicative time 4 days)
- To fractionate the peptides into 60 fractions, use HpH-RP liquid chromatography, using HPLC system equipped by C12-RP HPLC column (250 x 4.6 mm, 4 µm Proteo 90A).
- Before the run, prepare fresh Buffer A and Buffer B (the composition of the Buffers is described in Table 1).
- Filter all solution with 0.22 µm filter and degas them in a sonicator bath for at least 30 min.
- Dissolve the lyophilized peptides in 1 mL of Buffer A. Filter the peptides through a polytetrafluoroethylene (PTFE) 0.45 µm filter, using a syringe.
- Set the fractionation rate at 1 mL/min flow and collect 1 mL of fractions, using the following chromatographic gradient: 5% B to 30% B in 60 min; 30% B to 60% in 2 min; 70% B for 3 min.
- Set the HPLC so that, at this point, fraction collection is halted, and the gradient held at 70% Buffer B for 5 min before an extensive wash of the column with a quick gradient up to 100% Buffer B, followed by a final wash (100% Buffer B for 10 min).
NOTE: At the end of each chromatographic run, always equilibrate the column with 100% Buffer A for 20 min. - Fractionate both samples separately digested with Trypsin and LysargiNase by Off-Line HpH RP chromatographic gradients, as described at point 6.5.
- For each chromatographic gradient, collect all the fractions into a deep 96 well plate.
- Pool the fractions collected before the gradient into one single fraction named PRE. Concatenate the 60 fractions from the HpH-RP liquid chromatographic (LC) gradient by pooling them in a non-contiguous way into 14 final fractions. To obtain such non-contiguous concatenation, pool the HpH-RP fractions according to the following scheme.
- Fraction 1 (final volume 5 mL): Pool 1-15-29-43-57
- Fraction 2 (final volume 5 mL): Pool 2-16-30-44-58
- Fraction 3 (final volume 5 mL): Pool 3-17-31-45-59
- Fraction 4 (final volume 5 mL): Pool 4-18-32-46-60
- Fraction 5 (final volume 4 mL): Pool 5-19-33-47
- Fraction 6 (final volume 4 mL): Pool 6-20-34-48
- Fraction 7 (final volume 4 mL): Pool 7-21-35-49
- Fraction 8 (final volume 4 mL): Pool 8-22-36-50
- Fraction 9 (final volume 4 mL): Pool 9-23-37-51
- Fraction 10 (final volume 4 mL): Pool 10-24-38-52
- Fraction 11 (final volume 4 mL): Pool 11-25-39-53
- Fraction 12 (final volume 4 mL): Pool 12-26-40-54
- Fraction 13 (final volume 4 mL): Pool 13-27-41-55
- Fraction 14 (final volume 4 mL): Pool 14-28-42-56
NOTE: The non-contiguous concatenation consists in combining early-, mid-, and late-eluting fractions, which allows increasing the heterogeneity in peptide composition within the pooled fractions. Consequently, the peptide mixture of each pooled fraction is efficiently separated, with limited co-elution, in the subsequent nano-flow low pH-RP-LC chromatography directly coupled to the mass spectrometer.
- Pool the fractions collected after the gradient into a unique fraction, named POST.
NOTE: By including the fractions PRE and POST gradient, a total of 16 fractions are obtained, in 15 mL tubes (see Figure 3A). - Cover the 15 mL tubes with paraffin film and punch it with a 20 G needle to generate 3-5 holes. Freeze them by incubating the centrifuge tubes in dry ice until each fraction is completely frozen.
- Lyophilize the fractions for about 48 h. Ensure that each sample is completely dried before stopping the freeze-dryer.
NOTE: The experiment can be paused here, storing the lyophilized samples at -80 °C.
7. R-methylated peptide immuno-affinity enrichment (indicative time 2 days)
- Perform the sequential immuno-affinity enrichment of modified peptide with anti-pan-R-methylation antibodies in parallel, but separately for the two samples from Trypsin and LysargiNase digestions, respectively. The Immuno-Affinity Purification (IAP) Buffer is provided by the company purchasing the anti-pan-R-methyl antibodies for modified peptide affinity enrichment (details are in Table Material and Reagents). The IAP buffer is concentrated 10x and should be diluted 10 times before use.
NOTE: The IAP Buffer 1x can be stored at -20 °C to up to 1 year. - Centrifuge the lyophilized peptides at 2,000 x g for 5 min at RT to spin down the peptides to the bottom of the 15 mL tube. Re-suspend the lyophilized peptides with 250 µL of 1x IAP Buffer per 15 mL tube and transfer in a 1.5 mL low-binding tube. Check using a litmus paper whether the pH is >6.
- Keep a small aliquot (about 5% of the volume) of each fraction as input for the subsequent MS analysis.
- Split each fraction in two aliquots, in order to perform the immuno-enrichment of asymmetrically-di-methylated (ADMA) and symmetrically-di-methylated (SDMA) peptides in parallel.
- Use three vials of the selected anti-pan-R-methylated antibodies conjugated to protein A agarose beads per 10 mg of the initial protein extract.
- Prepare the correct amount of antibody conjugated to agarose beads by centrifuging each vial at 2,000 x g for 30 s and removing the buffer from the beads. Wash the beads three times with 1 mL of 1x PBS always by centrifuging them at 2,000 x g for 30 s.
- After the last wash, re-suspend the beads in 40 µL 1x PBS for each vial; pool them and finally divide them equally into 16 fractions (so that 2.5 µL of antibody-beads is added to each fraction).
- Add 250 µL of 1x IAP Buffer to each tube, mix by inverting and let it incubate on a rotating wheel for 2 h at 4 °C.
NOTE: Mix the samples by inverting the 1.5 mL tubes rather than by pipetting them with microtips, which could damage the beads or result in losing them. - Upon 2 h incubation, centrifuge the 1.5 mL tubes containing peptides and pan-R-methyl-antibody-conjugated beads at 2,000 x g for 30 s to pellet the beads; transfer the FT from each fraction into clean 1.5 mL low-binding tubes.
- Add the beads conjugated to antibodies against R-mono-methylation (MMA) to the FTs and repeat the steps 7.7 to 7.9.
- During the incubation of the peptide samples with the MMA-beads, wash twice the fractions which were previously immuno-precipitated with anti-ADMA and SDMA with 250 µL IAP Buffer (inverting and not pipetting), and discard the supernatant at each wash.
- Repeat the wash with LC-MS grade H2O thrice.
- Elute the affinity-enriched symmetrically and asymmetrically R-di-methylated peptides from the agarose beads by adding 50 µL of 0.15% TFA to each tube (strong acid conditions, in fact, denature the epitope leading to the release of the antigens from the antibodies). Leave this solution 10 min at RT, inverting the tubes every 2-3 min.
- Transfer the first elution into clean 1.5 mL low-binding tubes and repeat the elution with 50 µL 0.15% TFA; pool the 2 fractions in one tube.
- Repeat steps from 7.11 to 7.14 for the R-mono-methylated peptides that were incubated with the anti-MMA antibody-beads.
8. Desalting and concentration of affinity-enriched methyl-peptides by C18 microcolumns (indicative time required 30 minutes)
- Equilibrate with methanol the C18-RP microcolumns made with 3M Solid Phase extraction cartridges for peptide desalting and concentration prior to MS analysis19.
- Load the samples (corresponding to the separate immuno-affinity enriched fractions and input fractions) on the C18 microcolumns in two steps (50 µL + 50 µL on each C18 microcolumn) by centrifuging at 600 x g for 6 min.
- Wash the microcolumns with 55 µL Buffer A (see Table 1 for buffer composition), always by centrifugation at around 900 x g for 5 min.
NOTE: The experiment can be paused here, leaving the C18-RP microcolumns at 4 °C, where they can be stored up to 2 weeks.
9. Second enzymatic digestion (indicative time required 3 hours)
- Wash the C18-RP microcolumns with 55 µL of Buffer A (see Table 1 for buffer composition) for two times, by centrifugation at around 850 x g for 5 min.
- Elute the peptides twice with 20 µL of Buffer B (see Table 1 for buffer composition) and pool the two fractions.
- Dry the eluted peptides in a vacuum concentrator (see Table Material and Reagents for details). Meanwhile, prepare the digestion solution that consists of 50 mM ammonium bicarbonate that is diluted from a freshly made 1 M stock solution (see Table 1).
- Add Trypsin or LysargiNase to the respective samples, to a final concentration of 25 ng/µL. Incubate each sample at 37 °C for 2 h.
- Add 1 µL of 5% TFA to stop digestion; vortex and spin down the samples.
NOTE: Enzymatic cleavage by Trypsin can be inhibited at the C-terminus of methylated R and K, causing missed cleavages that increase peptide length and charge, which in turn produce complex and incomplete fragmentation spectra hindering peptide identification and site-specific attribution of methylation sites. It has been shown that a second enzymatic digestion may reduce the frequency of such missed cleavages, with improved sequence coverage and site-attribution20.
10. Desalting peptides (indicative time required 30 minutes)
- Load the acidified peptide solutions to new C18-RP microcolumns that have been previously equilibrated following the same steps described in point 8.
- The peptide loaded on the C18-RP microcolumns can be stored at 4 °C until elution for LC-MS/MS analysis.
11. Liquid chromatography-tandem mass spectrometry (LC-MS/MS) analysis (indicative time 5 days)
- Elute the peptides from the C18-RP microcolumns by passing 10µL of Buffer B, centrifuging at 615 x g for 5min at RT. Repeat this step twice and combine the eluates.
- Reduce the volume of the eluates in a vacuum concentrator until they are almost dry, avoiding over drying.
- Re-suspend the peptides in 10 µL of Buffer A for LC-MS/MS analysis.
- Analyze each fraction of R-methyl-peptides by liquid chromatography-tandem mass spectrometry (LC-MS/MS) in a high-resolution Mass Spectrometer (see Table of Materials), coupled to a nano-flow ultra-high-performance liquid chromatography (UHPLC) system. Set the instrument parameters as described in Table 2.
- Load 2 µL of each sample on a nano-analytical column (easy spray column 75 µm inner diameter, 25 cm length), packed with C18-RP resin (2 µm particle size).
- Samples are passed through the C18 RP nano-column at a flow rate of 300 nL/min, with the following linear gradient: 3%-30% B for 89 min, 30%-60% B for 5 min, 60%-95% B for 1 min, and 95% B for 5 min.
- The mass spectrometer operates in data-dependent acquisition (DDA) mode to automatically switch between full scan MS and MS/MS acquisition. Set the survey full scan MS to be analyzed in the spectrometer detector with resolution R = 70,000. The fifteen most intense peptide ions are sequentially isolated to a target value of 3 x 10⁶ and fragmented by relative collision energy of 28%. Set the maximum allowed ion accumulation times to 20 ms for full scans and 50 ms for MS/MS and fix the target value for MSMS to 1 x 10⁶. The dynamic exclusion time is set to 20 s.
12. Running MaxQuant and hmSEEKER data analysis
- Upon completion of the LC-MS/MS runs, import the MS raw data into a peptide search engine to identify the methyl-peptides by probability-based approach against the reference database. In this protocol, MaxQuant version 1.6.2.10 was used for our analysis. MaxQuant requires a minimum of 2 GB RAM to run, as well as enough disk space to store all the raw data and all the output files.
NOTE: Refer to the official documentation at https://www.maxquant.org for all the details about the installation and the hardware and software requirements. - Duplicate each raw data file. Rename the originals by appending "_light" to their name, then rename the copies by appending "_heavy".
NOTE: hmSEEKER, the script for downstream analysis, is case sensitive. - Launch MaxQuant/Andromeda search for peptide identification with the settings indicated in Table 3. Of the several output data produced by MaxQuant, only the allPeptides.txt and msms.txt files (located in the combined/txt subfolder) are required for the post processing step.
- The post processing of MaxQuant output data is carried out by the algorithm hmSEEKER. Download hmSEEKER from: https://bitbucket.org/EMassi/hmseeker/src/master/. The script is available as a Jupyter notebook written in Python 3.7 and comes with a sample dataset for testing purposes. For new users, it is advisable to download and install the Anaconda platform (https://www.anaconda.com/products/individual). The latest release includes by default Python 3.8, Jupyter and all the packages that are required to run hmSEEKER (e.g., Scikit-learn 0.23.1).
- Create a folder and store the files allPeptides.txt and msms.txt from MaxQuant output into it.
- Launch Jupyter (from the command line or from the Anaconda navigator).
- Navigate to the hmSEEKER folder and open hmSEEKER.ipynb.
- In the Input Parameters section of the notebook, indicate the paths to the FASTA database and to the folder(s) containing the MaxQuant text files.
- Run the code inside each cell by selecting the cell and clicking on the Play button on top of the Jupyter interface.
- The script produces a comma-separated output file for each dataset that was analyzed, plus a combined file. The final doublets list can be found in the file named "[date]-[time]-combined_hmSILAC_doublets_HxL_summary.csv"
(Table 4 includes a brief description of the columns in the output table).
Results
The article describes a workflow for the high-confidence identification of global protein R-methylation, which is based on the combination of the enzymatic digestion of the protein extract with two distinct proteases in parallel, followed by HpH-RP liquid chromatography fractionation of proteolytic peptides and immuno-affinity enrichment of R-methyl-peptides with anti-pan-R-methyl antibodies (Figure 1).
The cells were grown in the presence of Methionine, either natural (Light, L, Met-0) or isotopically labeled (Heavy, H, Met-4). Upon full isotopic labeling, which was tested by MS analysis on a small aliquot of Met-4 only extract, the heavy and light cells were harvested and mixed 1:1 L/H proportion, as illustrated in Figure 1A. Upon 13CD3-methionine metabolic labeling, the methyl groups are added to the protein backbone from the methyl-donor S-adenosyl-methionine (SAM) and will be present in either the light or the heavy-isotope form21. Figure 1B describes the arginine methylation reaction carried out by the Protein Arginine Methyltransferases (PRMTs) family that catalyze the transfer of a methyl group from S-adenosyl methionine (SAM) to the guanidino nitrogen of arginine. If a single methyl group is placed on one of the terminal nitrogen atoms of arginine, mono-methylated arginine (MMA) is obtained. If two methyl groups are added on the same nitrogen atom of the guanidino group, asymmetric di-methylated arginine (ADMA) is generated, while if two methyl groups are placed on two different nitrogen atoms, symmetric di-methylated arginine (SDMA) is produced.
After mixing in 1:1 ratio light- and heavy-labeled cells, proteins were extracted and subjected to digestion by Trypsin and LysargiNase, in parallel. As displayed in Figure 2, the SDS-PAGE Coomassie-stained gel was used to verify efficient enzymatic digestion of total proteins in peptides (compare lanes I and II). Moreover, the efficiency of purification step performed by C18 Sep-Pak column was evaluated, confirming the absence of peptides in the flow-through of the C18 column (Figure 2, lane III) and in the first and second wash (Figure 2 lane IV and V, respectively), with their expected presence in the eluate (Figure 2, lane VI). Proper Met-4 incorporation in the heavy channel (Figure 2B) and correct 1:1 H/L mixing (Figure 2C) were evaluated.
Figure 3 displays the chromatogram from the off-line HpH-RP liquid chromatography fractionation of peptides and the subsequent non-contiguous concatenation of fractions. Peptides were detected by 215 nm UV while undigested proteins potentially remaining were evaluated by 280 nm UV. Below the chromatogram the fraction concatenation strategy is schematized, to reduce the 70 starting fractions to final 16, including the PRE and POST gradient fractions.
Anti-pan-R-methyl antibodies were used for the enrichment of R-methyl-peptides. These antibodies recognize the three types of R-methylation (MMA, SDMA, and ADMA) and they are commercially available as directly conjugated to agarose beads (see Table Material and Reagents for details). Table 1 lists all buffers and solutions used in this protocol.
After acquisition, each MS raw data was analyzed twice with MaxQuant, to identify light and heavy methylations in different search groups, with the rationale that methyl-peptides (heavy and light) will only be identified in a specific group. Searching heavy and light methylations separately improves the analysis by reducing the number of variable modifications introduced and by reducing the risk of false positive mixed labeled peptides. Once MaxQuant has assigned methyl-sites, hmSEEKER parses its output table to reconstruct possible pairs of heavy-light peaks13.
Figures 4 and 5 illustrate full MS spectra of peptides FELTGIPPAPR(me) (4) and NPPGFAFVEFEDPR(me) (5), which represent a True Positive and a False Positive methyl-peptide annotation, respectively. In Figure 4, the m/z differences observed between the three peaks are consistent with the presence of an enzymatically methylated residue (7.0082 Th between the unmodified and light-methylated; 2.0102 Th between the light and heavy forms of the methyl-peptide). The resulting hmSILAC doublets has a ME of 0.40 ppm, a dRT of 0.00 min, and a LogRatio of -0.41; these values are below the default thresholds employed by hmSEEKER to distinguish true and false doublets, which was previously estimated to be as follows: |ME| < 2 ppm, |dRT| < 0.5 min, and |LogRatio| < 1. In the second case illustrated in Figure 5, the m/z difference observed between the light-methylated peptide and its putative heavy counterpart deviates from the expected value by 0.0312 Th (ME = -37.28 ppm). Moreover, this doublet has a LogRatio of 2.50, which is outside the default LogRatio prediction interval (these cut-off values have been defined and discussed in13). In fact, in the MS/MS spectrum, the sequence of the peptide NPPGFAFVEFEDPR(me) resulted not fully covered and the assigned R-methylation could be interpreted also as a methyl-esterification on the glutamate or aspartate close to R.
The hmSEEKER workflow is schematized in Figure 6, whereas Table 4 provides a description of the output table produced by the this tool, to help the interpretation of the results: peptides that carry multiple modifications appear multiple times, each entry corresponding to a different methylation event on a given peptide; finally, the peak doublets are divided into three Classes: Matched doublets are the most confident, as the peptide was fragmented and identified in both the heavy and the light form.
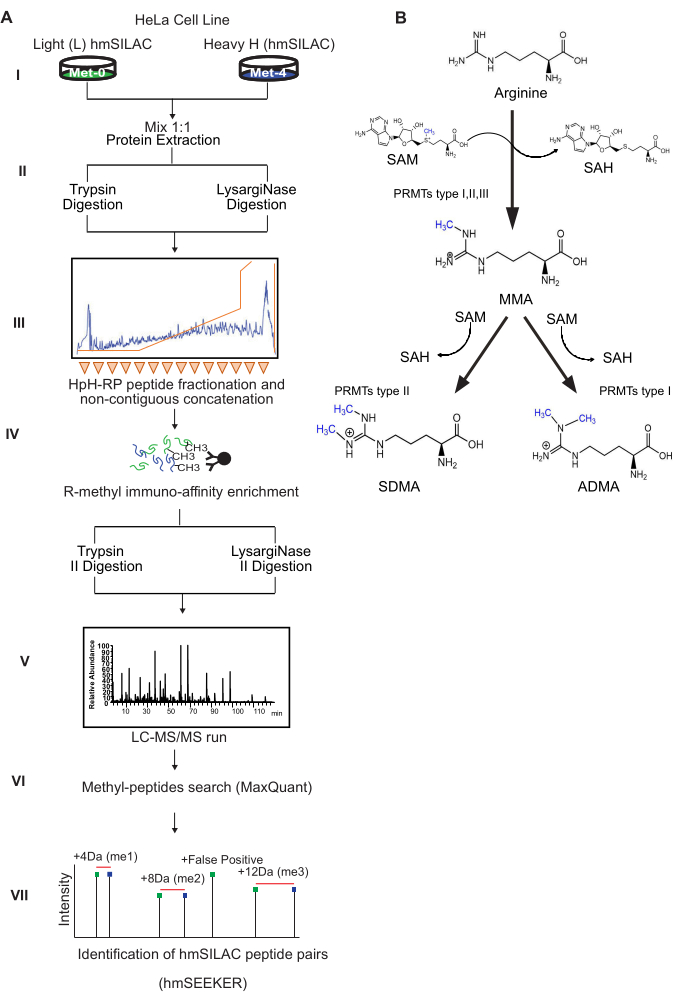
Figure 1: Scheme of the experimental workflow and of enzymatic protein-R-methylation reactions. (A) Workflow diagram of biochemical protocol.Cells are grown in light (Met-0) and heavy (Met-4) Methionine containing medium for at least 8 doublings and light and heavy channels are mixed 1:1 proportion. Proteins are extracted and subjected to digestion with Trypsin or LysargiNase in parallel and fractionated by off-line HpH-RP liquid chromatography by collecting 70 fractions, finally combined into 16 fractions. R-methyl-peptides are enriched by anti-pan-R-methyl antibodies conjugated to agarose beads, that underwent second enzymatic digestion (Trypsin or LysargiNase, respectively), and analyzed by LC-MS/MS. Raw MS data are processed by MaxQuant algorithm for peptide and PTM identification. MaxQuant output data are then submitted for analysis by hmSEEKER bioinformatic tool, developed in-house for heavy and light methyl-peptide association. (B) Scheme of R-methylation reaction. The Guanidino group of arginine can be modified by the addition of one methyl-group, producing mono-methylated arginine (MMA) or by the addition of two methyl-groups, producing either symmetric (SDMA) or asymmetric (ADMA) di-methylated arginine. The reaction is catalyzed by enzymes of the Protein Arginine Methyltransferases (PRMTs) family, that transfer these methyl groups from S-Adenosyl-Methionine (SAM). After the methyl group transfer, SAM is reduced to S-adenosylhomocysteine (SAH). Please click here to view a larger version of this figure.
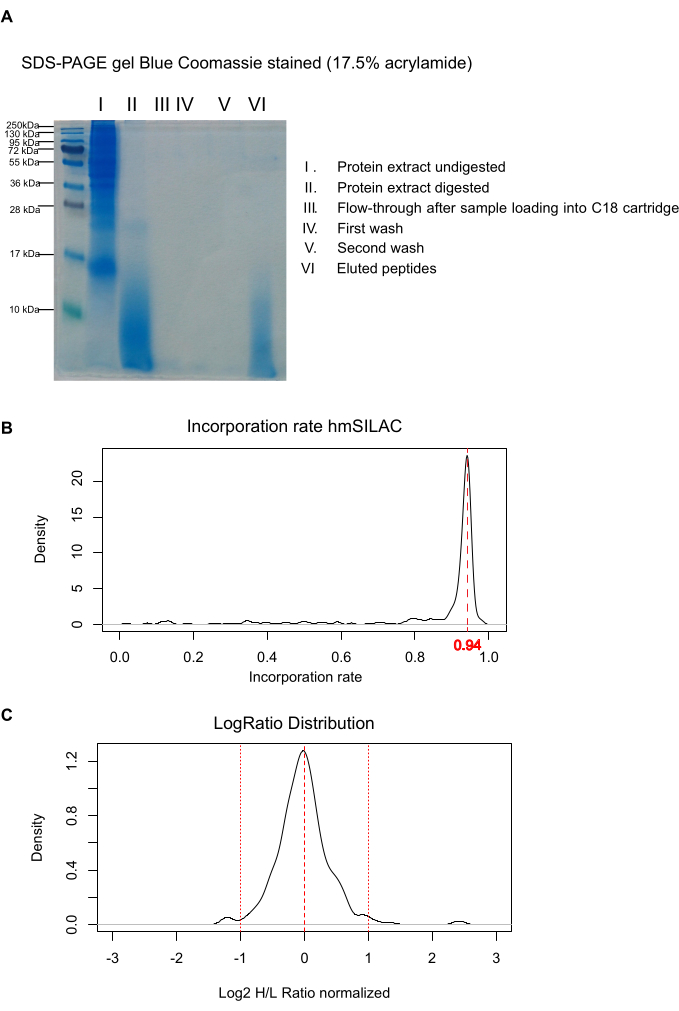
Figure 2: Controls of protocol critical steps. (A) SDS-PAGE Coomassie-stained gel for evaluation of proteolytic digestion efficiency. MW: molecular weight markers. I) 20 µg of total H/L protein extract prior to digestion quantified by BCA; II) digested peptides loaded in the same proportion as in I; III) Flow-through of C18 cartridge loaded in the same proportion as lane I; IV-V) first and second wash of the C18 cartridge with buffer A, loaded in the same proportion as I; VI) eluates from the C18 cartridge, loaded in the same proportion as I. (B) Met-4 incorporation rate analysis. The Met-4 incorporation in the heavy channel is evaluated by in-house developed script (available at https://bitbucket.org/EMassi/hmseeker/src/master/); rate = 1 indicates full incorporation (C) Gaussian distribution of H/L ratios for 1:1 mixing assessment. A normal distribution of Log2 H/L ratio is plotted considering ±2σ. Please click here to view a larger version of this figure.
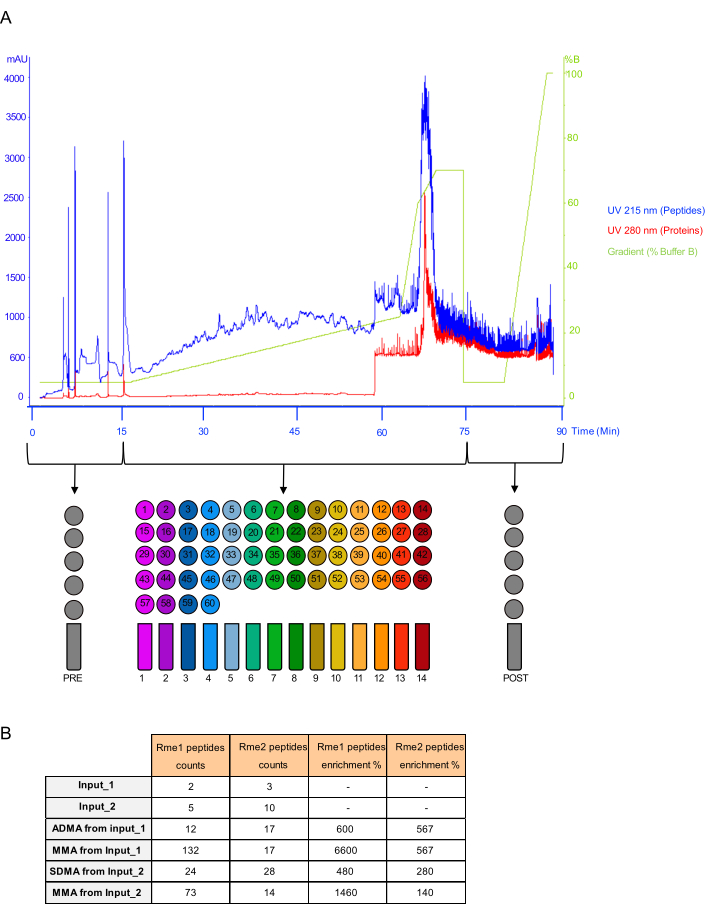
Figure 3: HpH fraction concatenation scheme and representative R-methylated peptides enrichment assessment. (A) High pH-Reversed Phase fractionation chromatogram and scheme of the non-contiguous fraction concatenation. The chromatogram represents the HpH-RP separation profile of peptides detected at 215 nm UV (blue line), while the presence of undigested proteins was tracked in the 280 nm UV channel (red line). The light green line represents the concentration of Buffer B along the chromatographic run. The fraction pooling scheme is reported, depicting the strategy of non-contiguous concatenation of early-, mid-, and late-eluting fractions, from 70 to 16, including PRE and POST gradient fractions. (B) Representative Table summarizing the enrichment of R-methylated peptides. The table recapitulates the total number of peptides and the relative percentage of R-methylation enrichment comparing each IP on its Input. Please click here to view a larger version of this figure.
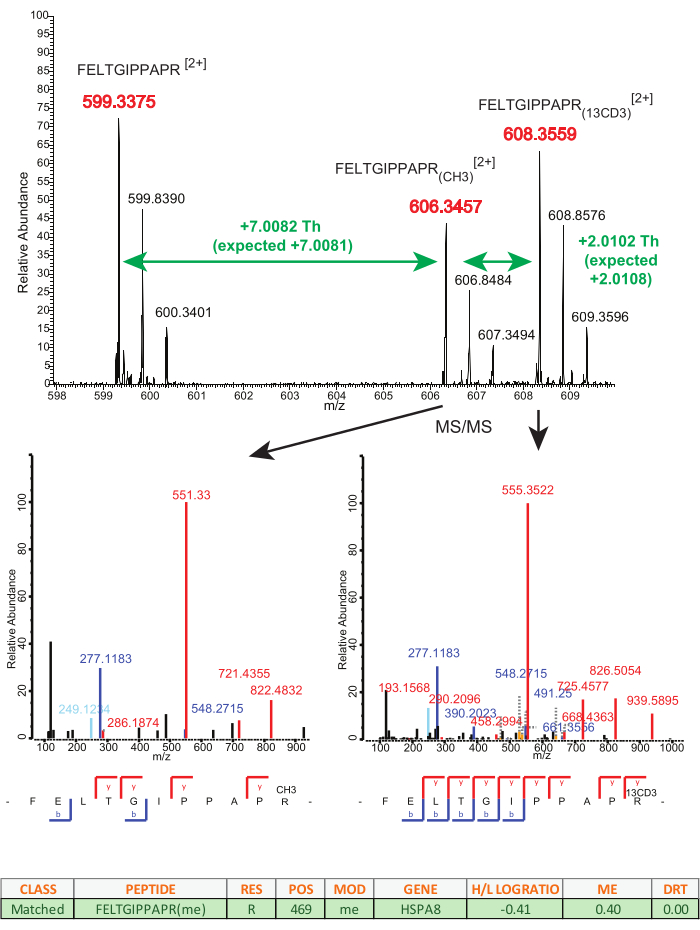
Figure 4: Example of true hmSILAC doublet. Mass spectrum of a true positive doublet. The peaks displayed correspond to peptide FELTGIPPAPR in the unmodified, light mono-methylated (CH3) and heavy mono-methylated (13CD3) forms, with charge 2+. The m/z differences observed between the three peaks are consistent with the presence of an enzymatically methylated residue. The table under the mass spectrum represents hmSEEKER output and contains the LogRatio, ME, and dRT parameters of the doublet. Please click here to view a larger version of this figure.
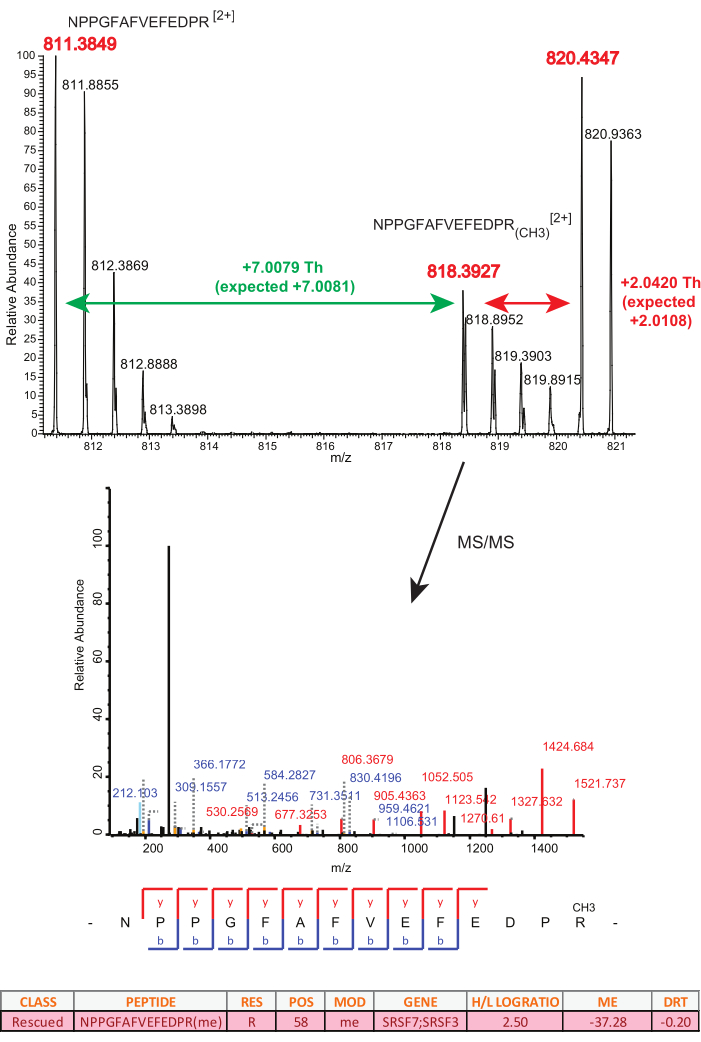
Figure 5: Example of false hmSILAC doublet. Mass spectrum of a negative in vivo methyl-peptide assignment. The peaks at 811.3849 m/z and 818.3927 m/z correspond to the unmodified and light mono-methylated forms of peptide NPPGFAFVEFEDPR, with charge 2+. The third peak could be assigned as the heavy-methyl-counterpart of the light methylated peptide, but the observed m/z shift differs from the expected shift by 0.0312 Th, which rules out this possibility. The table under the mass spectrum represents hmSEEKER output and contains the LogRatio, ME, and dRT parameters of the doublet. Please click here to view a larger version of this figure.
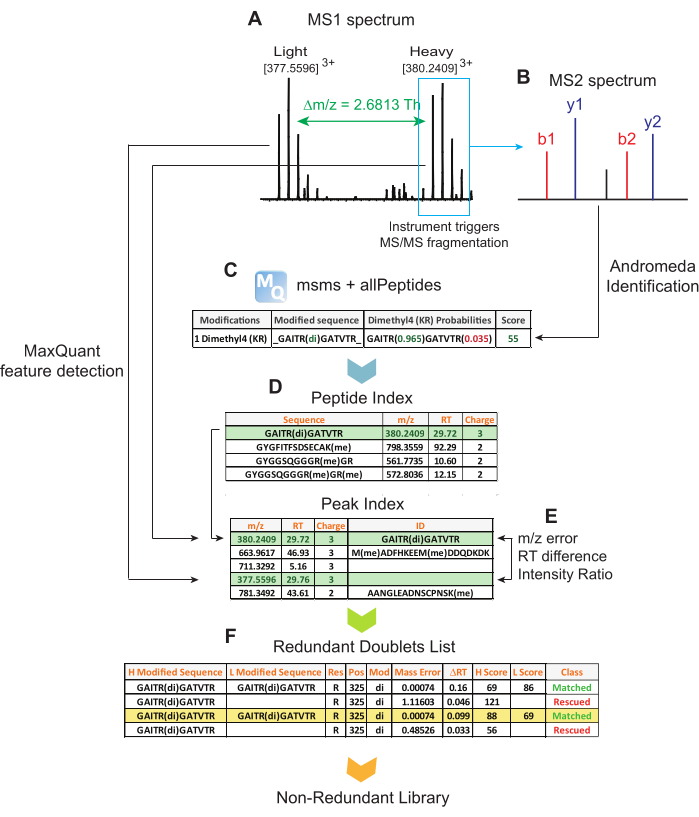
Figure 6: Schematic representation of data analysis workflow. (A) MaxQuant detects MS1 peaks in the raw data. (B) Peaks with an associated MS2 spectrum are processed by the database search engine Andromeda to obtain a peptide identification. (C) hmSEEKER reads MaxQuant peptide identifications and extracts methyl-peptides with Andromeda Score > 25, Delta Score > 12, and modifications with a Localization Probability > 0.75. (D) For each methyl-peptide that passes the quality filtering, hmSEEKER finds its corresponding MS1 peak in MaxQuant allPeptides table and then searches for its counterpart in the same table. (E) A doublet of peaks is defined by the difference in their retention time (RT), their intensity ratio (LogRatio), and the deviation between expected and observed delta mass (ME); these three parameters are used by hmSEEKER to distinguish true positives from false positives, as discussed13. (F) Finally, hmSEEKER produces lists of redundant and non-redundant doublets; the first includes predictions for all methyl-peptides, while the second is filtered so that when a peptide is identified multiple times, only the best scoring doublet is reported. Please click here to view a larger version of this figure.
| Buffer | Volume | Composition |
| L-methionine (L) solution | 10mL | 30mg/mL Light-Methionine in ultrapure water |
| L-methionine (H) solution | 10mL | 30mg/mL Heavy-Methionine in ultrapure water |
| Medium for cell culture | 500mL | DMEM with stabile glutamine and without methionine, 10%(v/v) dialyzed FBS, 1% (v/v) P/S, 1:1000 (v/v) L-methionine solution |
| Lysis Buffer | 50mL | 9M Urea, 20mM HEPES pH 8.0;1% (v/v) Protease Inhibitor; 1% (v/v) Phosphatase Inhibitor in ultrapure water |
| Ammonium Bicarbonate (AMBIC) solution | 50mL | 1M (NH4)2CO3 in ultrapure water |
| DTT solution | 10mL | 1.25M DTT in ultrapure water |
| IAA solution | 5mL | 109mM in ultrapure water |
| Solvent A for Sep-Pak C18 | 50mL | 0.1% TFA in ultrapure water |
| Solvent B for Sep-Pak C18 | 50mL | 0.1% TFA + 40% ACN in ultrapure water |
| Wash solution for Sep-Pak C18 | 50mL | 0.1% TFA + 5% ACN in ultrapure water |
| Buffer A for HpH fractionation | 500mL | 25 mM NH4OH in ultrapure water |
| Buffer B for HpH fractionation | 500mL | 25 mM NH4OH+ 90% ACN in ultrapure water |
| IP binding buffer 1x | 5mL | diluite 1:10 (v/v) in ultrapure water from 10x commercially stock solution available |
| IP elution buffer | 50mL | 0.15% TFA in ultrapure water |
| Buffer A for Stage-Tips | 50mL | 0.1% TFA in ultrapure water |
| Buffer B for Stage-Tips | 50mL | 0.1% TFA + 40% ACN in ultrapure water |
| Buffer C for Stage-Tips | 50mL | 0.1% TFA + 50% ACN in ultrapure water |
| MS Solvent A | 250mL | 0.1% FA in ultrapure water |
| MS Solvent B | 250mL | 0.1% FA + 80% ACN in ultrapure water |
| Protease inhibitors cocktail | 5 mL | cOmplete, EDTA-free Protease Inhibitor Tablets (ROCHE) dissolved in ultrapure water according to the manufacture instruction |
| Phosphatase inhibitors cocktail | 5 mL | PhosSTOP Tablets (ROCHE) dissolved in ultrapure water according to the manufacture instruction |
Table 1: Buffers and solutions composition. Lists of the buffers and solutions used in this protocol.
| Parameters | Value |
| Sample Loading (uL) | 2 |
| Loading Flow Rate (uL/min) | 10 |
| Gradient Flow Rate(nL/min) | 300 |
| Linear Gradient | 3-30% B for 89min, 30-60% B for 5min, 60-95% B for 1min, 95% B for 5min |
| Full Scan Resolution | 70,000 |
| Number of most intense ions selected | 15 |
| Relative Collision energy (%) (CID) | 28 |
| Dynamic Exclusion (s) | 20.0 |
Table 2: LC-MS/MS setting. Parameters applied for the LC-MS/MS analysis of R-methyl-peptides on a high-resolution Quadrupole-Orbitrap Mass Spectrometer, coupled to a nano-flow ultra-high-performance liquid chromatography (UHPLC) system.
| MQ Parameters Settings (ver 1.6.2.10) | |||
| Setting | Action | ||
| Configuration | |||
| Modifications | Met4 | Add new modification. Set Composition to H(-3) Hx(3) Cx C(-1) and choose M as the specificity. | |
| Methyl4 (KR) | Duplicate "Methyl (KR)", rename it and change composition to Cx H(-1) Hx(3) | ||
| Dimethyl4 (KR) | Duplicate "Dimethyl (KR)", rename it and change composition to H(-2) Hx(6) Cx(2) | ||
| Trimethyl4 (K) | Duplicate "Trimethyl (K)", rename it and change composition to Cx(3) H(-3) Hx(9) | ||
| OxMet4 | Duplicate "Oxidation (M)" and rename it. | ||
| Proteases | Lysarginase | Add new protease. Select the 'R' and 'K' columns. | |
| When creating a new PTM or protease, click "Modify Table" to change the MaxQuant settings and then "Save Changes" to confirm the changes. Restart MaxQuant and the new options will be visible. | |||
| Raw Files tab | |||
| Parameters group | Separate the raw files into 2 groups (0 and 1) | ||
| Group Specific Parameters | |||
| Type | Type | Standard | |
| Multiplicity | 1 | ||
| Digestion | Enzyme | Trypsin or Lysarginase | |
| Max. Missed Cleavages | Set to 3 | ||
| Modifications | Variable modifications | Group 0 | Oxidation (M), Methyl (KR), Dimethyl (KR), Trimethyl (K) |
| Group 1 | OxMet4, Methyl4 (KR), Dimethyl4 (KR), Trimethyl4 (K) | ||
| Fixed Modifications | Group 0 | Carbamidomethylation | |
| Group 1 | Carbamidomethylation and Met4 | ||
| Global parameters | |||
| Sequences | Fasta files | Load FASTA file | |
| Identification | PSM FDR | Set to 0.01 | |
| Min. Score for modified peptides | Set to 1 | ||
| Min. Delta score for modified peptides | Set to 1 | ||
| Advanced Identification | Second peptide search | Check off | |
| Tables | Write allPeptides table | Check | |
| Advanced | Calculate peak properties | Check | |
| If not specified, leave the default parameter. | |||
| MQ Parameters Settings for Incorporation Test | |||
| Group Specific Parameters | |||
| Type | Type | Standard | |
| Multiplicity | 2 | ||
| Max Labeled | 5 | ||
| Heavy Label | Select Met4 | ||
| Digestion | Enzyme | Trypsin or Lysarginase | |
| Max. Missed Cleavages | Set to 3 | ||
| Modifications | Variable modifications | Oxidation (M) | |
| Fixed Modifications | Carbamidomethylation | ||
| If not specified, leave the default parameter. | |||
Table 3: MaxQuant processing parameters. Group-specific and global parameters adjusted to the specific experiment described, are listed. All other parameters have been set as default, depending on the program version used.
| Column name | Description |
| Rawfile | Raw data file in which the doublet was identified |
| H-Scan | Scan number of the Heavy counterpart |
| L-Scan | Scan number of the light counterpart |
| CLASS | Can have 3 values: |
| Matched = Heavy and Light peptides are identified with the same sequence | |
| Mismatched = Heavy and light peptides have the same aa sequence but there is a mismatch in the localization of the methylated site | |
| Rescued = Only one peptide in the doublet is identified; its counterpart is an unidentified peak. | |
| PEPTIDE | Peptide sequence |
| SCORE | Peptide Andromeda Score |
| RES | Modified residue |
| POS | Position of the modified residue |
| MOD | Modification |
| LEAD PROTEIN | Protein the peptide belongs to |
| GENE | Gene name corresponding to the protein |
| PROBABILITY_TRUE | Probability of the doublet being a true hmSILAC doublet, calculated by the logistic regression model |
| PREDICTION | 1 if the doublet is putative true, 0 if it's false |
| H/L LOGRATIO | Log2 of the Heavy/Light Intensity ratio |
| ME | Deviation between expected and observed mass difference |
| DRT | Difference in retention time |
Table 4: hmSEEKER output results description. List of the column entries in the hmSEEKER output table, with a brief description of their content.
Discussion
The high confidence identification of in vivo protein/peptide methylation by global MS-based proteomics is challenging, due to the risk of high FDR, with several amino acid substitutions and methyl-esterification occurring during sample preparation that are isobaric to methylation and can cause wrong assignments in the absence of orthogonal MS validation strategies. The substoichiometric nature of this PTM further complicates the task of global methyl-proteomics, but can be overcome with the selective enrichment of modified peptides10.
Here, a biochemical and analytical workflow is presented, which is designed to increase the efficiency and reliability of global MS-analysis of R-methyl-peptides through the application of hmSILAC strategy coupled to HpH-RP chromatography peptide fractionation and affinity-enrichment with anti-pan-R-methyl-peptides antibody kits. The former strategy allows orthogonal validation of methyl-peptides and strongly reduces the FDR of identification, while the latter protocol increases their detectability from the background of unmodified peptides22. However, a limitation of this protocol is the requirement of very large amount of starting protein extract (in the range of 20-40 mg) as input for the subsequent peptide fractionation and affinity enrichment, which limits the application of the method to immortalized, fast growing cell lines which can be expanded extensively. Instead, the current setup is not applicable to patient-derived primary cells or tissues. Future investigations should be directed to improve the protocol in this direction: additional strategies for the biochemical enrichment of methylated peptide over unmodified ones could allow circumventing the use of antibodies, enabling the scaling down of the experiments. Another interesting development could be represented by the combination of the current methods with the chemical modification of proteolytic peptides with isobaric or tandem mass tags, with two-fold potential advantages: on the one hand, the possibility of combining multiple conditions in one single experiment, thus multiplexing the relative quantification of methyl-proteomic changes upon different perturbations; on the other hand, pooling different samples into one prior to chromatographic fractionation and affinity enrichment may allow to reduce the scale of individual experiments.
This protocol relies on two separate digestions of the whole cell extract in parallel with Trypsin and LysargiNase. Trypsin cleaves the peptide bond at the C-terminal side of K and R residues, generating peptides that present a positively charged residue at the C-terminus, in addition to the N-terminal positive charge from the α-amine23. The LysargiNase enzyme selectively hydrolyzes peptidyl-K and -R bonds, generating peptides that bear a K or R at the N-terminal site, which can include K-methylated forms. The use of both proteases increases the overall proteome coverage in large scale MS-analysis, leading to the identification of peptides eventually missed upon a single tryptic digestion18. The double enzymatic digestion, instead, is carried out to reduce the number of possible missed enzymatic cleavages. In fact, methylation of K and R strongly reduce the efficiency of protein cleavage by trypsin. In spite of this precaution, it is still common for methylated peptides to be longer and contain missed cleavages, which lead to poor CID fragmentation.
The use of another type of fragmentation, such as Electron Transfer Dissociation (ETD), could solve this issue. As a matter of fact, ETD usually does not fragment doubly charged peptide ions efficiently like CID does, but it provides fairly uniform cleavage of peptide precursors of higher charge states (≥3). This could be an advantage in the case of R-methylation, since it frequently occurs in Arginine-rich domains that contain multiple and neighboring R residues. However, ETD has a lower scan rate than CID, so the total number of peptide identifications is reduced24,25,26.
Recently, several protocols that involve the enrichment of post-translationally modified peptides have been coupled with different chromatography separation strategies that help reducing the complexity of the peptide mixture, thus increasing the overall efficiency of modified peptides detection in MS. Here, HpH-RP chromatographic fractionation coupled with non-contiguous concatenation of the fractions is applied. The off-line peptide fractionation based on a high pH reversed phase chromatography displays a high resolving power separation that is orthogonal to the on-line low pH RP-separation carried out downstream during the LC-MS/MS run27. Moreover, the non-contiguous concatenation strategy has two main advantages: first, it increases the protein coverage by pooling early-, middle-, and late-eluting fractions into individual concatenated fractions, preserving the heterogeneity of peptide mixture. Second, the concatenation reduces the subsequent MS run-time analysis, by acquiring a lower number of sample fractions28.
Due to the substoichiometric nature of R-methylation, an enrichment step is necessary in order to facilitate the detection of methyl-peptides in global MS-analysis of modification proteomes. In this protocol, the methyl-peptides are enriched by immuno-affinity precipitation (IAP) using the antibodies anti-SDMA and anti-ADMA in parallel, while the immuno-precipitation of mono-methyl-peptides using anti-MMA antibody is carried out on the FTs from the previous IAP experiments. This order reflects the different efficiency of these antibodies: anti-SDMA and anti-ADMA antibodies have lower binding efficiency compared to anti-MMA antibody. Noteworthy, this different efficiency may also cause biases in the representation of the different degrees of R-methylations in modification-proteomes experimentally annotated29.
Before the commercial availability of anti-pan-R-methylation antibodies, other separation strategies were applied to boost R-methylated peptide detection by MS, such as strong cation exchange (SCX) and hydrophilic interaction (HILIC) chromatography. Despite these techniques could reduce the complexity of the peptide mixture analyzed in MS, they did not significantly improve the identification of methyl-peptides30,31,32,33.
In spite of all these technical and analytical solutions aiming at increasing the methyl-peptide separation, detection, fragmentation, and sequence annotation, the methyl-proteome coverage is still limited and biased toward the more abundant methylated proteins, such as ribonucleoprotein, RNA-binding helicases, while several known low-abundant modified proteins (e.g., TP53BP1, CHTF8, MCM2) are only detected serendipitously and not reliably over multiple global experiments34. Subcellular fractionation applied prior to the current workflow could improve the detection of such proteins; however, the current experimental scale required do not make this a viable alternative.
Upon MS, the raw data are analyzed through the MaxQuant algorithm for peptide and PTM identification. The analysis of data from hmSILAC experiments is, however, not straightforward with standard search algorithms. For instance, while MaxQuant can efficiently analyze standard SILAC experiments based on the metabolic labeling with isotopically encoded K and R, it does not work efficiently when the isotope-labeling is encoded into a variable PTM, as in the case of heavy-methyl labeling that leads to heavy-methylation. Therefore, the strategy adopted here consists in first analyzing the hmSILAC data with MaxQuant without using its built-in doublet-searching functionality so that the light and heavy peptides can be identified independently; then they are matched with a post-processing software. This bioinformatic workflow also has its own pitfalls, as one has to specify methylations in both heavy and light forms in the Variable Modifications panel of MaxQuant, ending up with a total of eight variable modifications when Methionine oxidation (heavy and light) is also included. Searching too many PTMs with a database search engine such as MaxQuant/Andromeda is impractical, because it leads to an exponential increase of the theoretical peptides the algorithm has to test: our solution was to analyze each MS raw data twice, with different sets of variable PTMs (through the parameters groups function of MaxQuant). After peptide search, the in-house developed tool hmSEEKER is employed to support the assignment of heavy-light peptide pairs from the output tables produced by MaxQuant. The first release of the hmSEEKER algorithm has been recently published13, where it was shown that hmSEEKER can identify hmSILAC doublets with FDR < 1%. False positives can still arise from pairs of peaks that by chance have a mass difference multiple of 4.02 Da, but this is very unlikely for the doublets classified as Matched or Mismatched, in light of the following facts: for a Matched or Mismatched doublet to be false, Andromeda has to incorrectly determine the sequence of both the heavy and the light counterpart. Assuming that the search engine has been run with its default parameters, each identification has a 1% probability of being incorrect. Thus, the probability of the hmSILAC counterpart also being incorrect is 0.01%.
One pitfall of hmSILAC is that peptides containing Methionine in their backbone also generate doublets that are indistinguishable from those generated by methyl-peptides. Nevertheless, from our experience, this should not represent a major issue, first because peptides without methylations can be simply discarded from the MaxQuant output and, second, because hmSEEKER automatically takes into account any Methionine residue in a methyl-peptide when calculating the expected mass difference; last, this risk is also excluded by the fact that the heavy and light modifications are searched in separate parameters groups, so that the search engine cannot split a heavy mono-methylation (+18.03 Da) into a light mono-methylation plus a heavy Methionine (14.01 + 4.02 Da).
A more formal and experimental solution to this problem was proposed by Oreste Acuto and his collaborators, who developed a variant of hmSILAC, named isomethionine methyl-SILAC (iMethyl-SILAC)22. In this alternative metabolic labeling protocol, natural light Methionine is replaced by [13C4]-Methionine, which has the same mass as [13CD3]-Methionine (Met-4), yet it does not produce stable isotopically-encoded methyl-groups, due to the different distribution of the heavy isotopes within the molecular tag. Thus, in iMethyl-SILAC experiments, unmodified Methionine-containing peptides do not generate doublets. However, it should be noted that when Acuto and co-workers compared the performance of iMethyl-SILAC and traditional hmSILAC, the two methods still displayed very similar FDRs.
A possible limitation of hmSEEKER is that it is designed to work directly on MaxQuant output tables so that its source code is not compatible with other search engines, whose output files are structured differently; in this sense, MethylQuant35 provides a good alternative bioinformatic tool that is tailored ad hoc for the direct analysis of MS raw data from hmSILAC-type of experiments and is more flexible in terms of the input files provided. A machine learning model is under development in order to distinguish true and false methyl-peptide H/L doublets without relying on user-defined thresholds.
Disclosures
The authors have nothing to disclose.
Acknowledgements
MM and EM are PhD students within the European School of Molecular Medicine (SEMM). EM is the recipient of a 3-years FIRC-AIRC bursary (Project Code: 22506). Global analyses of R-methyl-proteomes in the TB group are supported by the AIRC IG Grant (Project Code: 21834).
Materials
| Name | Company | Catalog Number | Comments |
|---|---|---|---|
| Ammonium Bicarbonate (AMBIC) | Sigma-Aldrich | 09830 | |
| Ammonium Persulfate (APS) | Sigma-Aldrich | 497363 | |
| C18 Sep-Pak columns vacc 6cc (1g) | Waters | WAT036905 | |
| Colloidal Coomassie staining Instant | Sigma-Aldrich | ISB1L-1L | |
| cOmplete Mini, EDTA-free | Roche-Sigma Aldrich | 11836170001 | Protease Inhibitor |
| Dialyzed Fetal Bovine Serum (FBS) | GIBCO ThermoFisher | 26400-044 | |
| DL-Dithiothreitol (DTT) | Sigma-Aldrich | 3483-12-3 | |
| DMEM Medium | GIBCO ThermoFisher | requested | with stabile glutamine and without methionine |
| EASY-nano LC 1200 chromatography system | ThermoFisher | ||
| EASY-Spray HPLC Columns | ThermoFisher | ES907 | |
| Glycerolo | Sigma-Aldrich | G5516 | |
| HeLa cells | ATCC | ATCC CCL-2 | |
| HEPES | Sigma-Aldrich | H3375 | |
| Iodoacetamide (IAA) | Sigma-Aldrich | 144-48-9 | |
| Jupiter C12-RP column | Phenomenex | 00G-4396-E0 | |
| L-Methionine | Sigma-Aldrich | M5308 | Light (L) Methionine |
| L-Methionine-(methyl-13C,d3) | Sigma-Aldrich | 299154 | Heavy (H) Methionine |
| LysargiNase | Merck Millipore | EMS0008 | |
| Microtip Cell Disruptor Sonifier 250 | Branson | ||
| N,N,N′,N′-Tetramethylethylenediamine (TEMED) | Sigma-Aldrich | T9281 | |
| Penicillin-Streptomycin | GIBCO ThermoFisher | 15140122 | |
| PhosSTOP | Roche-Sigma Aldrich | 4906837001 | Phosphatase Inhibitor |
| Pierce C18 Tips | ThermoFisher | 87782 | |
| Pierce 0.1% Formic Acid (v/v) in Acetonitrile, LC-MS Grade | ThermoFisher | 85175 | LC-MS Solvent B |
| Pierce 0.1% Formic Acid (v/v) in Water, LC-MS Grade | ThermoFisher | 85170 | LC-MS Solvent A |
| Pierce Acetonitrile (ACN), LC-MS Grade | ThermoFisher | 51101 | |
| Pierce Water, LC-MS Grade | ThermoFisher | 51140 | |
| Polyacrylamide | Sigma-Aldrich | 92560 | |
| Precision Plus Protein All Blue Prestained Protein Standards | Bio-Rad | 1610373 | |
| PTMScan antibodies α-ADMA | Cell Signaling Technology | 13474 | |
| PTMScan antibodies α-MMA | Cell Signaling Technology | 12235 | |
| PTMScan antibodies α-SDMA | Cell Signaling Technology | 13563 | |
| Q Exactive HF Hybrid Quadrupole-Orbitrap Mass Spectrometer | ThermoFisher | ||
| Sequencing Grade Modified Trypsin | Promega | V5113 | |
| Trifluoroacetic acid | Sigma-Aldrich | T6508 | |
| Ultimate 3000 HPLC | Dionex | ||
| Urea | Sigma-Aldrich | U5378 | |
| Vacuum Concentrator 5301 | Eppendorf | Speed vac |
References
- Bulau, P., et al. Quantitative assessment of arginine methylation in free versus protein-incorporated amino acids in vitro and in vivo using protein hydrolysis and high-performance liquid chromatography. Biotechniques. 40 (3), 305-310 (2006).
- Blanc, R. S., Richard, S. Arginine methylation: the coming of age. Molecular Cell. 65 (1), 8-24 (2017).
- Sylvestersen, K. B., Horn, H., Jungmichel, S., Jensen, L. J., Nielsen, M. L. Proteomic analysis of arginine methylation sites in human cells reveals dynamic regulation during transcriptional arrest. Molecular & Cellular Proteomics. 13 (8), 2072-2088 (2014).
- Yang, Y., Bedford, M. T. Protein arginine methyltransferases and cancer. Nature Reviews Cancer. 13 (1), 37-50 (2013).
- Bezzi, M., et al. Regulation of constitutive and alternative splicing by PRMT5 reveals a role for Mdm4 pre-mRNA in sensing defects in the spliceosomal machinery. Genes & Development. 27 (17), 1903-1916 (2013).
- Auclair, Y., Richard, S. The role of arginine methylation in the DNA damage response. DNA Repair. 12 (7), 459-465 (2013).
- Spadotto, V., et al. PRMT1-mediated methylation of the microprocessor-associated proteins regulates microRNA biogenesis. Nucleic Acids Research. 48 (1), 96-115 (2020).
- Musiani, D., Massignani, E., Cuomo, A., Yadav, A., Bonaldi, T. Biochemical and computational approaches for the large-scale analysis of protein arginine methylation by mass spectrometry. Current Protein and Peptide Science. 21 (7), 725-739 (2020).
- Ong, S. -E., Mittler, G., Mann, M. Identifying and quantifying in vivo methylation sites by heavy methyl SILAC. Nature Methods. 1 (2), 119-126 (2004).
- Hart-Smith, G., Yagoub, D., Tay, A. P., Pickford, R., Wilkins, M. R. Large scale mass spectrometry-based identifications of enzyme-mediated protein methylation are subject to high false discovery rates. Molecular & Cellular Proteomics. 15 (3), 989-1006 (2016).
- Bedford, M. T., Clarke, S. G. Protein arginine methylation in mammals: who, what, and why. Molecular Cell. 33 (1), 1-13 (2009).
- Larsen, S. C., et al. Proteome-wide analysis of arginine monomethylation reveals widespread occurrence in human cells. Science Signaling. 9 (443), (2016).
- Massignani, E., et al. hmSEEKER: Identification of hmSILAC doublets in MaxQuant output data. Proteomics. 19 (5), 1800300(2019).
- Bradford, M. M. A rapid and sensitive method for the quantitation of microgram quantities of protein utilizing the principle of protein-dye binding. Analytical Biochemistry. 72, 248-254 (1976).
- Smith, P. K., et al. Measurement of protein using bicinchoninic acid. Analytical Biochemistry. 150 (1), 76-85 (1985).
- Getz, E. B., Xiao, M., Chakrabarty, T., Cooke, R., Selvin, P. R. A comparison between the sulfhydryl reductants tris(2-carboxyethyl)phosphine and dithiothreitol for use in protein biochemistry. Analytical Biochemistry. 273 (1), 73-80 (1999).
- Nielsen, M. L., et al. Iodoacetamide-induced artifact mimics ubiquitination in mass spectrometry. Nature Methods. 5 (6), 459-460 (2008).
- Huesgen, P. F., et al. LysargiNase mirrors trypsin for protein C-terminal and methylation-site identification. Nature Methods. 12 (1), 55-58 (2015).
- Rappsilber, J., Mann, M., Ishihama, Y. Protocol for micro-purification, enrichment, pre-fractionation and storage of peptides for proteomics using StageTips. Nature Protocols. 2 (8), 1896(2007).
- Hartel, N. G., Chew, B., Qin, J., Xu, J., Graham, N. A. Deep protein methylation profiling by combined chemical and immunoaffinity approaches reveals novel PRMT1 targets. Molecular & Cellular Proteomics. 18 (11), 2149-2164 (2019).
- Bremang, M., et al. Mass spectrometry-based identification and characterisation of lysine and arginine methylation in the human proteome. Molecular bioSystems. 9 (9), 2231-2247 (2013).
- Geoghegan, V., Guo, A., Trudgian, D., Thomas, B., Acuto, O. Comprehensive identification of arginine methylation in primary T cells reveals regulatory roles in cell signalling. Nature Communications. 6 (1), 1-8 (2015).
- Tabb, D. L., Huang, Y., Wysocki, V. H., Yates, J. R. Influence of basic residue content on fragment ion peak intensities in low-energy collision-induced dissociation spectra of peptides. Analytical Chemistry. 76 (5), 1243-1248 (2004).
- Guthals, A., Bandeira, N. Peptide identification by tandem mass spectrometry with alternate fragmentation modes. Molecular & Cellular Proteomics. 11 (9), 550-557 (2012).
- Swaney, D. L., et al. Supplemental activation method for high-efficiency electron-transfer dissociation of doubly protonated peptide precursors. Analytical Chemistry. 79 (2), 477-485 (2007).
- Kundinger, S. R., Bishof, I., Dammer, E. B., Duong, D. M., Seyfried, N. T. Middle-down proteomics reveals dense sites of methylation and phosphorylation in arginine-rich RNA-binding proteins. Journal of Proteome Research. 19 (4), 1574-1591 (2020).
- Batth, T. S., Francavilla, C., Olsen, J. V. Off-line high-pH reversed-phase fractionation for in-depth phosphoproteomics. Journal of Proteome Research. 13 (12), 6176-6186 (2014).
- Yang, F., Shen, Y., Camp, D. G., Smith, R. D. High-pH reversed-phase chromatography with fraction concatenation for 2D proteomic analysis. Expert Review of Proteomics. 9 (2), 129-134 (2012).
- Hartel, N. G., Chew, B., Qin, J., Xu, J., Graham, N. A. Deep protein methylation profiling by combined chemical and immunoaffinity approaches reveals novel PRMT1 targets. Molecular & Cellular Proteomics. 18 (11), 2149-2164 (2019).
- Uhlmann, T., et al. A method for large-scale identification of protein arginine methylation. Molecular & Cellular Proteomics. 11 (11), 1489-1499 (2012).
- Wang, K., et al. Antibody-free approach for the global analysis of protein methylation. Analytical chemistry. 88 (23), 11319-11327 (2016).
- Moore, K. E., et al. A general molecular affinity strategy for global detection and proteomic analysis of lysine methylation. Molecular cell. 50 (3), 444-456 (2013).
- Wu, Z., et al. A chemical proteomics approach for global analysis of lysine monomethylome profiling. Molecular & Cellular Proteomics. 14 (2), 329-339 (2015).
- Sylvestersen, K. B., Horn, H., Jungmichel, S., Jensen, L. J., Nielsen, M. L. Proteomic analysis of arginine methylation sites in human cells reveals dynamic regulation during transcriptional arrest. Molecular & Cellular Proteomics. 13 (8), 2072-2088 (2014).
- Tay, A. P., Geoghegan, V., Yagoub, D., Wilkins, M. R., Hart-Smith, G. MethylQuant: A Tool for Sensitive Validation of Enzyme-Mediated Protein Methylation Sites from Heavy-Methyl SILAC Data. Journal of Proteome Research. 17 (1), 359-373 (2018).
Reprints and Permissions
