1. Microfluidic chamber preparation
- Select a SU-8 master mold with several chamber patterns. Typical chambers are cross-shaped with three inlets and one outlet, 20 µm high and 800 µm wide (Figure 1). Such master molds can be purchased from external companies or made in academic laboratories (e.g., Gicquel, Y. et al.5).
- Place tape around the edge of the mold.
- Put ~50 cm long, 19 mm wide, standard transparent office tape (see Table of Materials) on a bench, sticky side up. Place the mold vertically at one end and along the midline of the tape.
- Roll the mold to the other end of the tape to create a 1 cm border around the mold. Fold down the tape over the bottom of the mold.
- Prepare Polydimethylsiloxane (PDMS) solution.
- In a disposable weighing dish, directly pour 25-30 g of PDMS base (Table of Materials). Add 10% weight/weight PDMS curing agent (Table of Materials) with a disposable plastic Pasteur pipette.
- Mix manually and thoroughly with a plastic stick. Ensure that the curing agent is well incorporated into the PDMS base, even if stirring creates lots of bubbles.
- Degas the PDMS solution in a vacuum desiccator (Table of Materials) for at least 5 min at room temperature (RT). Bubbles will expand, rise to the surface, and burst when the vacuum is broken.
- Pour the PDMS solution over the SU-8 mold. Use a plastic stick to scrape and transfer as much of the mixture as possible.
- Degas PDMS for a second time (5 min in the vacuum desiccator). Make sure to get rid of most bubbles (a few small bubbles at the top surface are fine).
- Place the mold in an oven at 70 °C for at least 5 h for the PDMS to reticulate and solidify.
- Remove solid PDMS chambers from the mold.
CAUTION: Silicon wafers for SU-8 molds are extremely fragile, so extensive care must be taken when separating the PDMS from wafers. Work on a hard, flat surface and keep the wafer flat on the surface.- With a razor blade, make a circular cut in the PDMS, about 1 cm away from the edge of the mold. All patterns must be at least 0.5 cm inside the cut. Gently peel off the central PDMS block with gentle tugs.
CAUTION: When peeling off, maintain the SU-8 mold flat on the benchtop to prevent breaking it. - Place PDMS on clean aluminum foil, the molded surface facing the aluminum foil, to protect its surface from dust and to make patterns more visible.
- With a razor blade, make a circular cut in the PDMS, about 1 cm away from the edge of the mold. All patterns must be at least 0.5 cm inside the cut. Gently peel off the central PDMS block with gentle tugs.
- Choose and cut a chamber with a razor blade at least 0.5 cm away from the pattern. The resulting PDMS block is around 0.5 cm high, 1.5 cm wide, and 3 cm long. Pierce three inlets and one outlet with a biopsy punch 0.75 mm I.D. (Table of Materials).
- Clean the PDMS chamber with ultrapure ethanol (Table of Materials) and air-dry using a safety blowgun (Table of Materials). Place the PDMS with the pattern facing up in a clean Petri dish, and close the dish with its lid.
2. Glass coverslip cleaning
NOTE: Here, a standard coverslip cleaning procedure, based on a series of sonication steps, is detailed. Other glass coverslip-cleaning procedures have been described in many other publications that can achieve similar satisfying results6,7,8,9.
- Place 10-20 coverslips (40 mm long) on a Polytetrafluoroethylene (PTFE) holder (Table of Materials). Sonicate the coverslips in 0.5 L of 2% glass cleaning solution (Table of Materials) in a 1 L glass beaker (35 °C, 30 min).
- Dispose the glass cleaning solution and rinse the coverslips extensively with dH2O in at least three successive 0.5 L baths.
- Prepare 0.5 L of 2 M KOH in a 1 L glass beaker. Sonicate the coverslips in KOH (RT, 30 min). Dispose KOH and rinse the coverslips with dH2O in at least three 0.5 L baths.
CAUTION: Use appropriate lab safety protection equipment (gloves, glasses, and lab coat). - Transfer and sonicate the coverslips in 0.5 L of ultrapure ethanol (RT, 30 min). Coverslips can be kept in ethanol for up to 2 weeks. Close the beaker with thermoplastic film (Table of Materials) to prevent evaporation. Before use, dry the coverslip with air flow.
3. PDMS chamber assembly
- Preheat the hot plate to 100 °C. Place up to three cleaned PDMS chambers and glass coverslips in a clean Petri dish. Place the open Petri dish in a deep Ultraviolet (UV) cleaner (λ = 185 nm, see Table of Materials) and expose it to UV light for 3-5 min.
NOTE: Alternatively, PDMS chambers and coverslips can be exposed to air or oxygen plasma for 30 s. - Gently position the PDMS chamber over the coverslip. Make sure the two surfaces put in contact were directly exposed to UV. The PDMS automatically sticks to the glass and the chamber becomes clearly visible.
- To remove any air trapped at the PDMS-coverslip interface, very gently press the surface with a finger. For a tighter bonding, press more strongly over corners and sides. Make sure that the ceiling of the chamber does not come in contact with the glass surface.
- Place the chamber with the glass bottom facing the hot plate at 100 °C for 5 min. After this step, the glass-PDMS bonds become permanent, and chambers can only be used once. Use the chamber immediately or store it in a clean Petri dish for up to a week.
4. [OPTIONAL] Direct passivation and functionalization
NOTE: Depending on the application, chambers can be passivated and functionalized either once connected to the microfluidic controlling device (see Table of Materials) or by manually injecting solutions directly into the chamber with a pipette prior to its connection to the microfluidic device. The latter offers the advantage of consuming less reagent and avoiding potential contamination by flowing the solution through the polyether ether ketone (PEEK) tubing of the microfluidic device. In all the following steps, solutions are injected by directly sticking the pipette tip into the outlet. In order to avoid creating bubbles inside the chamber, make sure to have a tiny droplet sticking out of the pipette tip when plugging the tip into the outlet of the PDMS chamber. Likewise, remove the pipette tip before the entire volume has been injected.
- Inject 20 µL of PLL-PEG (1 mg/mL in Phosphate-buffered saline (PBS)). Incubate for a minimum of 1 h (or overnight) at RT. To prevent evaporation, place the PDMS chamber in a humid box (e.g., an empty tip box with water in the lower compartment and the PDMS chamber on the tip-holding platform).
- Inject 20 µL of 100 pM spectrin-actin seeds (in F-buffer, see Table 1 and Table 2). Wait for no more than 1 min. Adjust the seed concentration and timing to tune seed surface density, high enough for large statistics and low enough for filaments not to overlap.
NOTE: Alternatively, if spectrin-actin seeds are not available, use biotin-functionalized short filament segments that will be immobilized on a streptavidin-coated coverslip9,10. - [OPTIONAL] Inject 20 µL of 5% bovine serum albumin (BSA) in F-buffer. Leave at RT for 10 min.
- [OPTIONAL] Inject 20 µL of 1 mg/mL β-casein in F-buffer. Leave at RT for 10 min.
NOTE: Follow steps 4.3 and/or 4.4 to further passivate the chamber. The choice of passivation depends on the proteins used and does not work equally well on all ABPs. When using actin alone, PLL-PEG or BSA is sufficient.
5. Connect microfluidic device
NOTE: Use a pressure-based microfluidic system with up to four channels to control flows in the microfluidic chamber (Figure 1A, see Table of Materials). To avoid bubbles forming in the microfluidic tubing and perturbing flow stability, degas all solutions. Place 5 mL of dH20 and 10 mL of F-buffer stock in a vacuum desiccator connected to a vacuum pump (ultimate vacuum <250 mbar) and degas for at least 1 h at RT.
- Rinse inlets + outlet tubings with dH2O (500 µL, 300 mbar).
- Fill all 2 mL reservoir tubes (see Table of Materials) with 300 µL of F-buffer. Set pressure to 300 mbar and let five to eight drops go to waste. Repeat for each channel and set pressure to 0.
- Connect the outlet and rinse the chamber extensively.
- Set the pressure for the reservoir tube 4 (outlet) to 50 mbar. Once a droplet comes out from the tubing end, connect the tubing to the outlet of the PDMS chamber. The liquid fills in the chamber and comes out of all inlets.
- [OPTIONAL] If the chamber has been directly passivated (section 4), set pressure to 100 mbar to rinse the chamber with 50-100 µL of F-buffer (3-5 min). Remove the excess liquid at inlets with a cleaning tissue.
- Set pressure to 20 mbar.
- Connect inlets.
- Set the pressure for the reservoir tube 1 to 50 mbar. To avoid introducing air bubbles, ensure that a droplet comes out of the tubing and the PDMS inlet.
- Connect the tubing to inlet 1 (the two droplets merging when connecting). Set the pressure to 30 mbar.
- Repeat steps 5.4.1-5.4.2 to connect inlets 2 and 3.
- Set the pressure of all inlets to 20 mbar and the outlet pressure to 0 mbar. Ensure that the flow rates in the inlets are roughly equal (see Troubleshooting section).
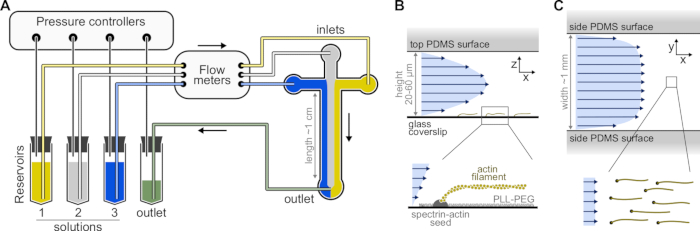
Figure 1: Injecting solutions through a microfluidic chamber. (A) Standard microfluidic setup for single actin filaments experiments. Protein solutions, placed in reservoirs 1-3, are pushed into the chamber by adjusting the pressure in the gas phase. The generated flow rates are measured by flow meters. Inside the microfluidic chambers, solutions do not mix and occupy space depending on the relative pressures applied (here, equal pressure on all inlets). Typical dimensions: reservoir tubes contain up to 2 mL of solution. PEEK tubing (0.25 mm inner diameter) connects the reservoirs to the flow meters (after 10 cm of tubing) and then to the PDMS chamber (after another 70 cm). Silicon tubing and stainless steel tubing couplers are used to connect the PEEK tubing to the PDMS inlets. The main microfluidic channel is 20-60 µm high, around 1 mm wide and 1 cm long. (B,C) Flow profiles inside the microfluidic chamber. (B) The fluid generates a parabolic profile across the chamber height: v(z) = 6z(h-z)R/h3w, where h and w are the chamber height and width, and R is the total flow rate. Bottom: Single actin filament polymerized from surface-anchored spectrin-actin seeds. (C) When the chamber width is considerably larger than its height, the flow is nearly uniform across the chamber, except at the PDMS surfaces, where it goes to zero. Please click here to view a larger version of this figure.
6. Configuring the setup with standard flow rates
NOTE: The computer-controlled pressure system allows easy and precise adjustment of the pressures of all inlets/outlet connected to the PDMS chamber, therefore the control of incoming and outcoming flow rates. Preset configurations can be saved and turned on/off with a single mouse click. Below are the recommended configurations (unless otherwise stated, outlet pressure is set to 0 mbar). See Table 3 for expected flow rates for these preset configurations. The pressures indicated here must be adjusted depending on the chamber geometry and system configuration.
- Change: Use this preset when changing one or more reservoir(s). It creates a mild backward flow in the tubing of interest to prevent introducing bubbles.
- Set all inlet pressures to 12 mbar and outlet pressure to 5 mbar (Figure 2B).
- High Flow 'All': Use this preset to rapidly inject three solutions in parallel. They will reach the chamber within 4 min.
- Set all inlet pressures to 150 mbar.
- High Flow 'x': Use this preset to rapidly inject a solution. It will reach the chamber within 3 min (Figure 3A-C).
- Set inlet 'x' pressure to 150 mbar (~15 µL/min). The pressure in the other inlets is adjusted to around 100 mbar, such that the resulting flow rate in these inlets is ~500 nL/min.
- Mid Flow 'All': Use this preset to pause the system.
- Set all inlets to 20 mbar (Figure 2A).
- Mid Flow 'x': Use this preset to allow the solution 'x' to fill in most of the main channel width (see Figure 2C,D), while restricting the other inlet solutions to the channel sides. Actin filaments in the chamber will thus be exposed to the biochemical condition imposed by solution 'x' only.
- Set inlet 'x' pressure to 12 mbar. Set the pressure in the other inlets and adjust to ~9 mbar, such that their respective flow rates are ~ 150 nL/min.
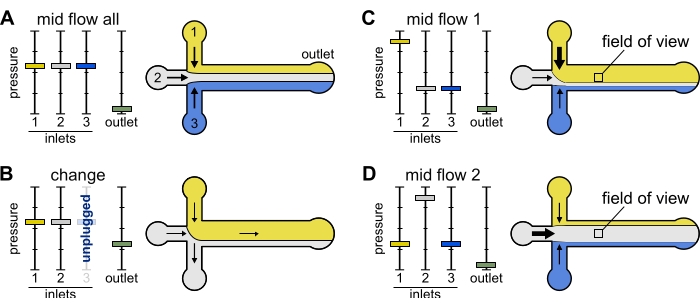
Figure 2: The pressure applied to each reservoir controls the partition/spatial distribution of solutions inside the microfluidic chamber. (A) With equal pressure applied to the reservoirs, each solution occupies one-third of the chamber. (B) When changing a reservoir tube (here reservoir 3), the effective pressure drops down to zero, creating a backward flow. (C,D) Increasing the relative pressure on one of the reservoirs allows exposure of the glass surface to a single solution. The field of view in the middle of the chamber can be sequentially exposed to solutions 1 and 2 by alternating between configuration Mid Flow 1 (C) and Mid Flow 2 (D). Please click here to view a larger version of this figure.
7. Changing solution 'x'
NOTE: As shown in Figure 3A-C, it is important to keep in mind that solutions take minutes to flow from a reservoir tube to the main channel of the chamber. This minimal 'dead' time is imposed by the liquid volume contained in the tubing and the flow profile within the tubing (Figure 3A-C).
- Prepare 200-300 µL of solution in a new reservoir tube. Set pressure to Change setting (see section 6).
- Unscrew the reservoir tube of inlet 'x'. The solution in the tubing will slowly flow backwards, from the chamber to the free tubing tip. The measured flow rate becomes negative (Figure 2B).
- Once a tiny droplet has formed at the tubing tip, screw in the new tube with the fresh solution. Once the tube is correctly tightened to the pressure system, the flow rate of the inlet returns to positive.
- Set the pressure setting to High Flow 'x'.
- Depending on the microfluidic configuration and chamber geometry, wait for 3-5 min for the solution to fully fill in the tubing and reach the chamber.
- [OPTIONAL] Follow this process by measuring the increase in fluorescence over time (Figure 3C).
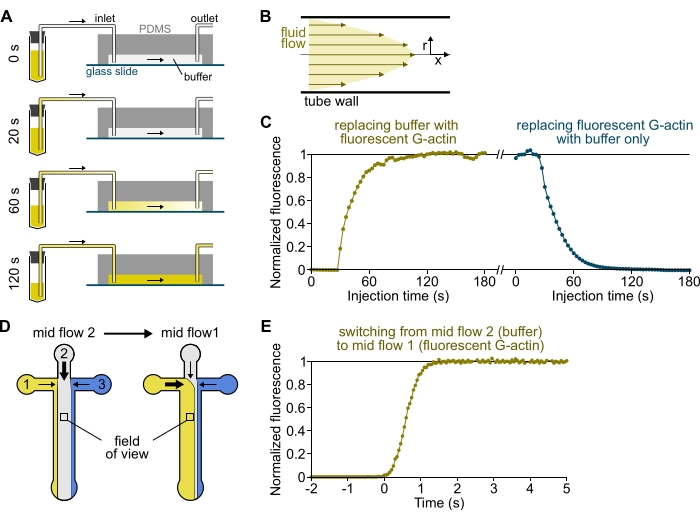
Figure 3: Delayed arrival of solutions from the reservoirs to the PDMS chamber and rapid change of biochemical conditions. (A-C) Delayed arrival of solutions from the reservoirs to the PDMS chamber. (A) Depending on the chamber geometry, the tube length, and the applied pressure at the inlet(s), the replacement of one solution by another is not instantaneous. After changing the reservoir tube to one containing a fluorescent solution (0 min), the solution progressively fills in the tubing (0.4 min) and the PDMS chamber (1-2 min). Indicative timing is given for a 150 mbar applied pressure, 80 cm PEEK tubing, and a 1600 µm wide, 20 µm high PDMS chamber. (B) The parabolic flow profile inside the PEEK tubing generates an effective gradient of fluorescence along the tubing radial profile and inside the chamber (see also Figure 1B). (C) Delayed arrival of solutions can be quantified by measuring the background epifluorescence signal in the chamber as a function of time. Experimental conditions: 0.5 µM 10% Alexa-568-labeled G-actin is injected with 150 mbar through a flow meter and 80 cm PEEK tubing. (D,E) Rapid change of biochemical conditions. (D) Pattern of incoming solutions in two Mid Flow conditions. (E) Increase in background fluorescence as a readout of actin concentration. Time t = 0 is set as the onset of fluorescence increase. Solution 1: 0.5 µM 10% Alexa-488-labeled G-actin, solution 2: F-buffer. (C,E) PDMS chamber: 20 µm high and 1600 µm wide. The epifluorescence intensity, ~2 µm above the surface, was quantified by averaging the signal over the full field of view, normalized to 0 in the absence of fluorophore and 1 at maximum intensity. Please click here to view a larger version of this figure.
8. Basic single filament experiment: Adenosine diphosphate (ADP)-actin barbed end depolymerization
NOTE: This section assumes a non-functionalized chamber (section 5 only). If the chamber has been directly functionalized (section 4), start at step 8.4.
- Surface functionalization with actin filament seeds:
- Change solution 3 to 200 µL of 50 pM spectrin-actin seeds11 in F-buffer (see section 7).
NOTE: Alternatively, if spectrin-actin seeds are not available, one can use biotin-functionalized short filament segments that will be immobilized on a streptavidin-coated coverslip (refer to9,10 for details). - Inject for 2 min with High Flow 3.
NOTE: Adjust the concentration and time depending on the final seed density.
- Change solution 3 to 200 µL of 50 pM spectrin-actin seeds11 in F-buffer (see section 7).
- Surface passivation:
- Change tube 3 with 300 µL of 5% BSA in F-buffer.
- Inject for 5 min at High Flow 3, followed by 5 min at Mid Flow 3. During this second step, reduce pressure in channels 1 and 2 to 7-8 mbar to get a counter flow ~-100 nL/min, so that the entire chamber surfaces are BSA passivated.
NOTE: Since the BSA solution is more viscous, the pressures need to be adjusted accordingly.
- Change tube 3 to F-buffer and rinse the channel (5 min, High Flow 3).
- Prepare the following 200-300 µL solutions, all proteins being diluted in F-buffer:
Inlet 1, polymerization solution: 1 µM 10% Alexa-488 labeled G-actin, 1 µM profilin (Table 1).
Inlet 2, aging solution: 0.15 µM 10% Alexa-488 labeled G-actin.
Inlet 3, depolymerization solution: F-buffer only.
NOTE: Profilin is used here to prevent spontaneous nucleation and to maintain a constant concentration of G-actin. - Change tubes 1 to 3 (section 7). Inject using the High Flow All preset for 3-4 min. The three solutions have now filled the PEEK tubing and reached the chamber (Figure 3A). The glass surface can be exposed to any inlet solution without deadtime (<1 s, Figure 3D,E).
- Switch on the microscope. Set the settings: 150 mW 488 nm excitation laser at 10%-20% power, 100-200 ms camera exposure time, 200-300 nm TIRF penetration depth, 60x objective. These settings are used throughout the manuscript.
- Filament polymerization (Figure 4A):
- Set the pressure setting to Mid Flow 1 for ~10 min.
- [OPTIONAL] Record polymerization (1 frame/20 s, TIRF). Filaments should polymerize at around 10 subunits/second (sub/s)1,12.
- Filament aging: Set the pressure setting to Mid Flow 2 for 15 min. At the critical concentration, 0.15 µM G-actin, filament length will remain constant, and filaments will turn to >99% ADP-F-actin4.
- Depolymerization (Figure 4A):
- Start acquisition at 1 frame/5 s, in epifluorescence mode. As there is a very low fluorescence background in channels 2 and 3, it is not necessary to use TIRF.
- After one to two frames, switch to Mid Flow 3. Filaments should depolymerize at around 10 sub/s (reference12).
- To reset the experiment, break all fluorescently labeled filaments by continuously exposing them to the laser at maximum power for ~2 min. To test different conditions, change solutions 1, 2, or 3 and inject them (High Flow, 3-4 min). Repeat steps 8.7-8.9.
9. Other single-filament experiments
- Testing the interactions of ABPs with F-actin
NOTE: Microfluidics has been successfully used to quantify the activity of several side-binding ABPs, such as cofilin, tropomyosin, and Arp2/3. Following the protocol in section 8:- Change channel 3 to the fluorescent ABP of interest in F-buffer. Inject (High Flow 3, 3 min).
- Filament polymerization: Set the pressure setting to Mid Flow 1 for 10 min.
- ABP binding: Start acquisition with TIRF. Adjust frame rate depending on the ABP concentration. After 1-2 frames, switch to Mid Flow 3.
NOTE: Depending on the ABP, it can also be possible to rapidly (e.g., for less than 5 s) switch to Mid Flow 2 to further reduce the background fluorescence when taking an image. - ABP unbinding: While continuing the acquisition, switch to Mid Flow 2.
- Polymerization with formin at the free barbed end
NOTE: Formins have been shown to affect filament barbed end polymerization. Microfluidics is particularly adapted to measure formin binding and unbinding rates and their impact on filament elongation.- Prepare the following solutions:
Channel 1: 10 nM formin in F-buffer (Table 1).
Channel 2: 1 µM 10% Alexa-488 labeled G-actin, 4 µM profilin.
Channel 3: F-buffer. - Change tubes 1, 2, and 3 (section 7). Inject using the High Flow All preset for 3-4 min.
- Initiate filament polymerization: Set the pressure setting to Mid Flow 2 for 2 min.
- Formin binding to filament barbed end: Set the pressure settings to Mid Flow 1 for 30 s.
- Formin-mediated polymerization: Set the pressure setting to Mid Flow 2. With formin mDia1 at their barbed end, filaments should polymerize at around 50 sub/s13,14,15.
- Prepare the following solutions:
- Polymerization/depolymerization from surface-anchored formin
NOTE: The polymerization and depolymerization rates of formin-decorated barbed ends have been shown to depend on the tension applied to the filament. In microfluidics, the friction of the fluid flow along the filament side generates a tension proportional to the filament length and to the flow rate14,16.- Use the method in section 8 described above, replacing steps 8.1, 8.2, and 8.3 for surface passivation with:
- Change tube 3 to 1 µg/mL anti-His antibody in F-buffer. Inject for 2 min with High Flow 3.
- Change tube 3 with 5% BSA in F-buffer. Inject for 5 min at High Flow 3, followed by 5 min at Mid Flow 3. During this second step, reduce pressure in channels 1 and 2 to 7-8 mbar to get a counter flow ~-100 nL/min so that the entire chamber surfaces are BSA passivated.
- Change tube 3 to 100 nM His-tagged formin in F-buffer. Inject for 5 min with High Flow 3. Change tube 3 with F-buffer. Inject for 5 min with High Flow 3 to ensure that no formins remain in the tubing.
- Prepare and inject the following solutions (200-300 µL each, in F-buffer):
Channel 1: 1 µM 10% Alexa-488 labeled G-actin.
Channel 2: 1 µM unlabeled G-actin, 4 µM profilin.
Channel 3: F-buffer only. - Filament nucleation: Expose the surface-anchored formins to G-actin (setting Mid Flow 1).
- Filament polymerization: Expose the chamber to profilin-actin using Mid Flow 2.
- Start acquisition: 1 frame/2 s, epifluorescence. With formin mDia1, filaments should polymerize at 50-80 sub/s, depending on the filament length and the flow rate14.
- Filament depolymerization: Start acquisition (1 frame/4 s, epifluorescence). After 1-2 frames, expose the filaments to F-buffer, Mid Flow 3. With formin mDia1, filaments should depolymerize at 5-15 sub/s, depending on the filament length and flow rate14.
- Use the method in section 8 described above, replacing steps 8.1, 8.2, and 8.3 for surface passivation with:
- Actin filaments with unlabeled segments
NOTE: Actin fluorescent labeling creates several artifacts, such as pauses during depolymerization17 and altered tropomyosin binding18. A workaround for these artifacts is to use microfluidics to assemble filaments displaying unlabeled segments.- Prepare and inject the following solutions (200-300 µL in F-buffer):
Channel 1: 1 µM unlabeled G-actin, 1 µM profilin.
Channel 2: 0.3 µM 10% Alexa-488 labeled G-actin. - Sequentially expose the surface to channel 2 (5 min), channel 1 (10 min), and channel 2 (15 min) to generate ADP-actin unlabeled segments with fluorescently labeled segments at each end.
- Prepare and inject the following solutions (200-300 µL in F-buffer):
- Barbed end-anchored filaments with gelsolin
NOTE: With spectrin-actin seeds, filaments polymerize at their free barbed end while the pointed end is stabilized by the spectrin-actin seed. An alternative is to anchor filaments with a barbed end capper such as gelsolin.- Prepare a F-actin solution of 4 µM 10% Alexa-488 labeled G-actin in 20 µL of F-buffer. Let the actin spontaneously nucleate and polymerize at RT for at least 30 min on the bench. Wrap the tube in aluminum foil to protect it from light.
- Meanwhile, prepare the microfluidic chamber and passivate the surface with a mixture of 5% BSA and 1% biotin-BSA (see step 8.2).
- Rinse channel 3 with F-buffer (2 min at High Flow 3). Inject 10 µg/mL neutravidin in F-buffer (4 min at High Flow 3).
- Change tubes to:
Channel 1: 10 nM biotin-gelsolin (Table 1).
Channel 2: F-buffer.
Channel 3: 0.4 µM prepolymerized F-actin. - Inject all solutions together using the High Flow All setting for 3 min.
- Expose the entire chamber to gelsolin (Mid Flow 1, 30 s).
- Attach filaments to the surface (Low Flow 3: Channel 3 at 3 mbar, Channels 1 and 2 at ~2 mbar, for about 2 min).
- [OPTIONAL] If the filament density is too low, repeat step 9.5.6 and 9.5.7.
- Pointed end depolymerization: Start acquisition (1 frame/30 s, epifluorescence). After 1-2 frames, expose filaments to buffer only, Mid Flow 2. Filaments should depolymerize at around 0.2 sub/s.
10. Fascin-induced filament bundle formation and disassembly by ADF/cofilin
NOTE: To form actin filament bundles, make sure to have a sufficiently high filament seed density at the surface of the chamber. When exposed to fascin protein, neighboring filaments that fluctuate laterally will be dynamically cross-linked by fascin proteins. As fascin quickly unbinds from the filament side19, fascin has to be constantly present in the main flowing solution in order to maintain filament bundling.
- Follow steps 8.1-8.3.
- Prepare the following solutions (200-300 µL in F-buffer):
Channel 1, polymerization solution: 1 µM 10% Alexa-488 labeled G-actin, 1 µM profilin.
Channel 2, Bundling solution: 200 nM fascin (Table 1), 0.15 µM 10% Alexa-488 labeled G-actin.
Channel 3, Disassembly solution: 200 nM ADF/cofilin (Table 1), 100 nM fascin, 0.15 µM 10% Alexa-488 labeled G-actin. - Change tubes 1 to 3 (section 7). Inject using the High Flow All preset, for 3-4 min.
- Filament polymerization: Set the pressure setting to Mid Flow 1 for ~10 min. Polymerization can be imaged with TIRF.
- Filament bundling (Figure 4C): Start image acquisition (1 frame/5 s, epifluorescence). After 1-2 frames, set the pressure setting to Mid Flow 2 and observe filament bundling.
- Bundle fragmentation: Start image acquisition (1 frame/5 s, epifluorescence). After 1-2 frames, set the pressure setting to Mid Flow 3 and observe the cofilin-induced disassembly of both single filaments and bundles.
11. Microfluidic device cleaning procedure
NOTE: To avoid any contamination from one experiment to another, it is critical to extensively clean and completely dry all the tubings and flow meters after each experiment.
- Disconnect all tubings from the PDMS chamber and discard the chamber.
- To clean PEEK tubing and flow meters, tape the tubing ends in an empty 15 mL plastic tube and inject the following solutions at maximum pressure until the reservoir is almost empty:
400 µL of F-buffer.
400 µL of 0.5 M NaOH.
400 µL of pure water.
200 µL of isopropanol. - Replace with an empty reservoir and blow air until the tubings are fully dry (~2-4 min, maximum pressure).
12. Image analysis
NOTE: While this manuscript focuses on the method to assemble, manipulate, and visualize single actin filaments in microfluidics, a brief method to analyze acquired movies is provided here. The analysis is performed on 16-bit images, using ImageJ, following section 8.
- Image treatment is minimal:
- Import the polymerization or depolymerization image stack.
- [OPTIONAL] Homogenize image intensity with function Subtract Background (default settings (i.e. 'Rolling ball radius' = 50 pixels)). This is particularly useful if the background fluorescence changes during the course of a movie or if fluorescence illumination is not homogeneous over the field of view.
- Adjust brightness and contrast (background near zero, filaments near maximum).
- Create filament kymograph:
- Select a filament that does not pause, break or detach. Do not select based on behavior otherwise. Draw a line 1-2 pixels above (Straight Line tool). Save the filament number (Add in ROI Manager).
- Apply the function Reslice (Slice count: 5 pixels). Calculate the maximum intensity (function Zprojection).
- Measure the polymerization/depolymerization rate:
- On the kymograph, draw a line along the filament barbed end (Straight Line tool, Figure 4A). Measure the line width and height (function Measure).
- Repeat steps 12.2-12.3 over multiple filaments. Calculate the polymerization/depolymerization rates (Figure 4A):
 , where v is the rate (in sub/s), w the line width (pixels), pix the pixel size (nm), h the line height (frames), and dt the time between frames (in second). Here, 2.7 nm corresponds to the effective contribution of an actin subunit to the filament length.
For all the experiments described above, fluorescently labeled actin filaments should be clearly visible, with good contrast, indicative of low background fluorescence from the surface (Figure 4, see Supplementary File 1 for troubleshooting of common issues). Actin filaments should also not stick to the surface: when the dominant flow rate is low, the actin filaments' lateral fluctuations should be perceptible when observing them live and allow one to clearly determine that they are anchored by one of their ends only. Similarly, when using TIRF imaging, their vertical fluctuations should be visible by changes in intensity along their length and time. Depending on the applied flow rates, one may need to adjust the TIRF penetration depth to optimize the image quality of the actin filaments acquired by TIRF.
When exposing filaments to polymerization conditions (see section 8), filament elongation should be regular (i.e., the elongation at the end of the filament is not impeded by surface interaction or permanent sticking). In addition, the measured filament barbed end elongation rate should match the expected value according to the actin concentration in the tube1,20, indicating that the tube solution has been correctly flowed up to the microfluidic chamber (Figure 4A). Similarly, when exposed to a buffer solution, filaments should depolymerize steadily at a rate that reflects their ADP-content4 (Figure 4A). When exposing already grown actin filaments to a solution of fluorescently labeled cofilin, cofilin clusters will be nucleated and grow toward both the pointed and barbed ends (Figure 4B) at a rate that is dependent on the cofilin concentration. When assessing a potential cross-linking activity of an ABP, such as fascin (Figure 4C), close-by actin filaments forming bundles will be easily detected by their higher fluorescence intensity and a change in their lateral fluctuations.
The flow of liquid applies a viscous friction force on actin filaments that are anchored to the surface of the microfluidic chamber. The friction force coefficient on F-actin is η = 6.10-4 pN·s/µm2, expressed per filament micron length14. At intermediate flow rates, as filament height fluctuates around a constant average of 250 nm above the surface, there exists a force gradient from the free-floating end up to the filament anchoring point. One can therefore compute the applied tension at any point along the filament, using F = 6ηπLv, where v is the local flow velocity 250 nm above the surface (Figure 1B) and L is the downstream filament segment length (i.e., from the considered point up to the free end). For higher flow rates, the filament average height is not constant but increases linearly from the anchoring point to the free end, remains below 250 nm on average, and will vary depending on the flow rates, thus leading to a more complex tension force profile along the filament21.
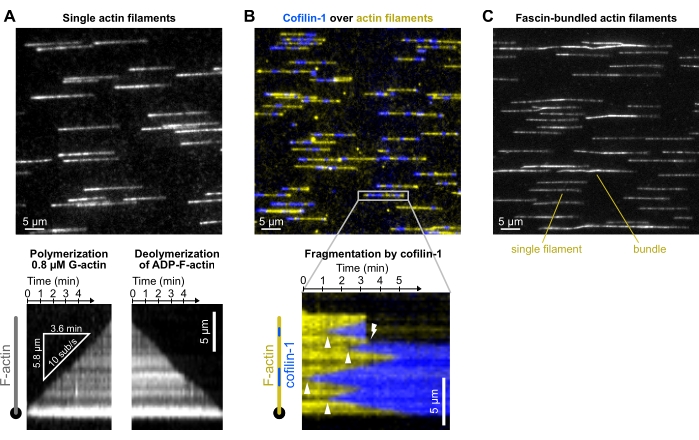
Figure 4: Representative results. Typical experiments in which actin filaments are polymerized from spectrin-actin seeds and exposed to different ABPs. For the sake of clarity, only a fraction of the field of view is shown. (A) Outcome from the basic polymerization-depolymerization experiment (section 8). Filaments are polymerized with a solution of 0.8 µM 10% Alexa-488 labeled G-actin, aged for 15 min to convert all subunits into ADP-actin (not shown), and depolymerized when exposed to F-buffer only. Bottom: kymographs used to quantify the polymerization and depolymerization rates. Acquired at 1 frame/5 s, 200 ms exposure time, 150 mW 488 nm laser at 9% power, TIRF (laser penetration depth 250 nm). (B) Fragmentation of single actin filaments by 500 nM mCherry-cofilin-1. Actin is labeled with ATP-ATTO48822 (yellow) and cofilin-1 is fused to mCherry (blue). Top: fraction of a field of view. Note: protein aggregates on the surface. Bottom: kymograph showing the binding of cofilin-1 to a filament (arrowheads show cofilin-1 domain nucleation events), leading to a fragmentation event (lightning symbol). Acquired at 1 frame/4 s, 200 ms exposure, 150 mW 488 nm laser at 16% and 100 mW 561 nm laser at 12% power, epifluorescence. (C) Bundling of actin filaments by fascin (section 10.5). Filaments were first polymerized with 0.8 µM 5% Alexa-488 labeled G-actin and bundled with 200 nM fascin. Compared with single filaments, filament bundles appear two- to threefold brighter and not perfectly aligned with the flow. Acquired at 1 frame/10 s, 200 ms exposure, 20% 200 W Mercury lamp intensity, epifluorescence. (A–C) The background was subtracted with ImageJ's ad hoc function. Please click here to view a larger version of this figure.
| Protein name | species | Uniprot ref (sequence) | original purification protocol ref. | comments |
| actin | rabbit | P68135 (full length) | 23 | For fluorescent labeling, see ref 24 |
| profilin1 | human | P07737 (full length) | 25 | see also ref 11 |
| Spectrin-actin seed | human | N/A | 26, 27 | see also ref 11 |
| cofilin1 | mouse | P18760 (full length) | 28 | |
| gelsolin | human | P06396 (full length) | 29 | |
| mDia1 formin | mouse | O08808 (aa 552–1255) | 13 | more detailed protocol in ref 24 |
| fascin1 | human | Q16658 (full length) | 30 |
Table 1: Actin and actin-binding proteins23,24,25,26,27,28,29,30
| Reagent | concentration |
| Tris-HCl pH 7.4 | 5 mM |
| KCl | 50 mM |
| MgCl2 | 1 mM |
| EGTA | 0.2 mM |
| ATP | 0.2 mM |
| DTT | 10 mM |
| DABCO | 1 mM |
Table 2: F-buffer composition. DABCO and a relatively high concentration of DTT are used to limit photo-induced damage to filaments due to light exposure during fluorescence microscopy experiments.
| Setting names | Pressure (mBar) | Flow rate (nL/min) |
| Max pressure | 300 | ~ 30 000 (in dominant channel) |
| High pressure | 150 | ~ 15 000 (in dominant channel) |
| Mid pressure | 12 | ~ 1500 (in dominant channel) |
| ‘Change’ pressure | 12 for all inlets, 5 for outlet |
~ 500 (in each inlet) |
Table 3: Correspondence between applied pressures and measured flow rates. The resulting flow rates highly depend on the experimental setup. Values are given for a microfluidic chamber with a 1 cm long main channel of cross-section 20 µm x 800 µm (height x width), connected to each reservoir with 80 cm long PEEK tubing.
Supplementary File 1: Classical issues, causes, and solutions. They commonly encountered issues when working with microfluidics and/or single actin filaments. Please click here to view a larger version of this figure.