Here we describe a time-specific method to effectively manipulate critical developmental pathways in the mouse placenta in vivo. This is performed through the injection and electroporation of CRISPR plasmids into the placentas of pregnant dams on embryonic day 12.5.
Method Article
Mouse In Vivo Placental Targeted CRISPR Manipulation
In This Article
Summary
Abstract
The placenta is an essential organ that regulates and maintains mammalian development in utero. The placenta is responsible for the transfer of nutrients and waste between the mother and fetus and the production and delivery of growth factors and hormones. Placental genetic manipulations in mice are critical for understanding the placenta's specific role in prenatal development. Placental-specific Cre-expressing transgenic mice have varying effectiveness, and other methods for placental gene manipulation can be useful alternatives. This paper describes a technique to directly alter placental gene expression using CRISPR gene manipulation, which can be used to modify the expression of targeted genes. Using a relatively advanced surgical approach, pregnant dams undergo a laparotomy on embryonic day 12.5 (E12.5), and a CRISPR plasmid is delivered by a glass micropipette into the individual placentas. The plasmid is immediately electroporated after each injection. After dam recovery, the placentas and embryos can continue development until assessment at a later time point. The evaluation of the placenta and offspring after the use of this technique can determine the role of time-specific placental function in development. This type of manipulation will allow for a better understanding of how placental genetics and function impact fetal growth and development in multiple disease contexts.
Introduction
The placenta is an essential organ involved in the development of the fetus. The main role of the placenta is to provide essential factors and regulate the transfer of nutrients and waste to and from the fetus. Mammalian placentas are composed of both fetal and maternal tissue, which make up the fetal-maternal interface, and, thus, the genetics of both the mother and fetus impact function1. Genetic anomalies or impaired function of the placenta can drastically alter fetal development. Previous work has shown that placental genetics and development are associated with the altered development of specific organ systems in the fetus. Particularly, abnormalities in the placenta are linked with changes in the fetal brain, heart, and vascular system2,3,4,5.
The transport of hormones, growth factors, and other molecules from the placenta to the fetus plays a major role in fetal development6. It has been shown that altering the placental production of specific molecules can alter neurodevelopment. Maternal inflammation can increase the production of serotonin by altering tryptophan (TRP) metabolic gene expression in the placenta, which subsequently creates an accumulation of serotonin in the fetal brain7. Other studies have found placental abnormalities alongside heart defects. Abnormalities in the placenta are thought to contribute to congenital heart defects, the most common birth defect in humans8. A recent study has identified several genes that have similar cellular pathways in both the placenta and heart. If disrupted, these pathways could cause defects in both organs9. The defects in the placenta may exacerbate congenital heart defects. The role of placental genetics and function on specific fetal organ system development is an emerging field of study.
Mice have hemochorial placentas and other features of human placentas, which makes them highly useful models for studying human disease1. Despite the importance of the placenta, there is currently a lack of targeted in vivo genetic manipulations. Furthermore, there are currently more options available for knockouts or knockdowns than overexpression or gain-of-function manipulations in the placenta10. There are several transgenic Cre-expressing lines for placental-specific manipulation, each in different trophoblast lineages at different time points. These include Cyp19-Cre, Ada/Tpbpa-Cre, PDGFRα-CreER, and Gcm1-Cre11,12,13,14. While these Cre transgenes are efficient, they may not be capable of manipulating some genes at specific time points. Another commonly used method to either knockout or overexpress placental gene expression is the insertion of lentiviral vectors into blastocyst culture, which causes a trophoblast-specific genetic manipulation15,16. This technique allows for a robust change in the placental gene expression early in development. The use of RNA interference in vivo has been sparsely utilized in the placenta. The insertion of shRNA plasmids can be performed similarly to the CRIPSR technique described in this paper. This has been done at E13.5 to successfully decrease PlGF expression in the placenta, with impacts on offspring brain vasculature17.
In addition to techniques that are primarily used for knockout or knockdown, inducing overexpression is commonly performed with adenoviruses or the insertion of an exogenous protein. The techniques used for overexpression have varying rates of success and have mostly been performed later in gestation. To investigate the role of insulin-like growth factor 1 (IGF-1) in placental function, an adenoviral-mediated placental gene transfer was performed to induce the overexpression of the IGF-1 gene18,19. This was performed late in mouse gestation on E18.5 via direct placental injection. To provide additional options and circumvent possible failures of established placental genetic manipulations, such as Cre-Lox combination failures, the possible toxicity of adenoviruses, and the off-target effects of shRNA, in vivo direct CRISPR manipulation of the placenta can be used20,21,22. This model was developed to address the lack of overexpression models and to create a model with flexibility.
This technique is based upon the work of Lecuyer et al., in which shRNA and CRISPR plasmids were targeted directly in vivo to mouse placentas to alter PlGF expression17. This technique can be used to directly alter placental gene expression using CRISPR manipulation at multiple time points; for this work, E12.5 was selected. The placenta has matured by this point and is large enough to manipulate, allowing for the insertion of a specific CRISPR plasmid on E12.5, which can have a significant impact on fetal development from mid to late pregnancy23,24. Unlike transgenic approaches, but similar to viral inductions or RNA interference, this technique allows for overexpression or knockout at particular time points using a relatively advanced surgical approach, thus avoiding possible impaired placentation or embryonic lethality from earlier changes. As only a few placentas receive the experimental or control plasmid within a litter, the approach allows for two types of internal controls. These controls are those injected and electroporated with the appropriate control plasmid and those that receive no direct manipulation. This technique was optimized to create an overexpression of the IGF-1 gene in the mouse placenta via a synergistic activation mediator (SAM) CRISPR plasmid. The IGF-1 gene was chosen, as IGF-1 is an essential growth hormone delivered to the fetus that is primarily produced in the placenta prior to birth25,26. This new placental-targeted CRISPR technique will allow for direct manipulation to help define the connection between placental function and fetal development.
Protocol
All procedures were performed in accordance and compliance with federal regulations and University of Iowa policy and were approved by Institutional Animal Care and Use Committee.
1. Animals and husbandry
- Keep the animals in a 12 h daylight cycle with food and water ad libitum.
- Use CD-1 female mice aged 8-15 weeks. Use the presence of a copulatory plug to identify E0.5.
- On E0.5, singly house the pregnant dams.
2. Calibration of the micropipette
NOTE: The calibration of the micropipette should be performed prior to surgery when possible.
- Prior to making and calibrating the micropipette, dilute all the plasmids to the recommended concentration (0.1 µg/µL) in DNase-free water. Mix the plasmid with appropriately diluted Fast Green dye (1 µg/µL in PBS) (final plasmid concentration: 0.06 µg/µL).
- Pull micropipettes using 10 cm glass capillaries with an outer diameter of 1.5 mm and an inner diameter of 0.86 mm with a micropipette puller.
- Carefully break off the tip of a micropipette (2-3 mm) with sterile forceps.
- Load the micropipette into a microcapillary tip attached to a microinjector. Ensure the microinjector is attached to the microinjection machine and that there are sufficient levels of nitrogen to calibrate the micropipette.
- Once the micropipette is attached to the microinjector, load it with the Fast Green dye solution to perform the calibration (1 µg/µL in PBS). Calibrate the micropipette to inject a volume of approximately 3.5 µL. Empty ("clear") the micropipette in preparation for loading the plasmid solutions as below.
NOTE: Each micropipette will be slightly different. To avoid damaging the placenta during the injection, the injection time should be set between 0.5-1.5 s. The pressure should be set between 1-8.5 psi. Calibrate each micropipette separately; if the micropipette cannot be calibrated within these parameters, then it should not be used.
3. Surgery (Figure 1A)
NOTE: To prepare, clean the surfaces of both the preparation and surgical areas with 70% ethanol. Place an absorbent underpad in the preparation area. In the surgery area, place a heating pad down, and then place an absorbent underpad on top of this. Sterilize all the tools prior to surgery. The time the dam is under anesthesia should be under 1 h.
- Anesthetization
- Administer 5 mg/kg of NSAID (meloxicam) or another approved analgesic to the pregnant dam 30 min to 1 h before surgery.
- Place the pregnant dam in an induction chamber attached to an isoflurane vaporizer.
- Set the vaporizer to 4% isoflurane and 3.5 L/min oxygen.
- Once anesthetization has been confirmed by the lack of response to a toe pinch and a reduced breathing rate, remove the dam from the induction chamber to the preparation area.
- Surgery preparation
- In the preparation area, place the dam supine with a nose cone.
- Reduce the vaporizer to 2% isoflurane and 3.5 L/min oxygen while the dam is in the nose cone.
- Shave the abdomen of the dam thoroughly and remove excess fur. Alternate coating the shaved abdomen with povidone solution and 70% ethanol three times using sterile cotton-tipped applicators. Apply final coat of povidone solution. To prevent corneal drying, place artificial tear gel over both eyes of the dam (Figure 2A, B).
- After preparation, move the dam with the nose cone to the designated surgery area.
- Uterine laparotomy
NOTE: Use sterile gloves throughout the surgical procedure. Change the gloves if any non-sterile surface is contacted.- In the surgery area, place the dam supine, and secure the nose cone in place with tape. Set the heating pad underneath the absorbent pad to 45 °C.
- Using forceps and scissors, make an approximate 2 cm midline incision through the skin. Use forceps to tent the skin, and make a vertical incision into the skin. After this, make another similarly sized incision through the peritoneum to expose the uterine horns. Using forceps, tent the peritoneum while making the vertical incision (Figure 2C, D).
NOTE: Failure to properly tent while incising the peritoneum may lead to a fatal incision of the intestines. - Gently massage the uterine horns through the incision by pressing on the sides of the abdomen. Do this by carefully guiding the uterus without tools, using only fingers to avoid accidental injury. Place the exposed uterus on top of a sterile surgical drape covering the abdomen of the dam and keep it moist throughout surgery with drops of sterile saline, which can be warmed to 30 °C prior to use as needed (Figure 2E, F).
NOTE: The uterine horns can be identified as described in Wang et al.27. - Once the uterus is exposed, select three pairs of placentas for manipulation.
NOTE: The placentas can be identified as described by Elmore et al.24. To maximize the survival of the embryos, no more than 6 placentas should be treated. If there are fewer than 12 embryos present, no more than 4 placentas should be injected. Select two adjacent placentas so that one receives a control injection and the other receives the experimental plasmid. The use of two adjacent placentas allows for a better comparison of placentas in similar locations in the uterus and also enables an increased rate of survival. The selected placental pairs are chosen randomly and spaced throughout both uterine horns (Figure 1B). - Record the location of placental manipulations and organization of the embryos within the uterine horns so that the embryos and placentas can be identified during collection, as one dam will carry both control and experimentally treated placentas/embryos.
- Placental injection and electroporation of the control plasmid
NOTE: To maintain an aseptic technique, sterilize the electroporation paddles and microinjector with a cold sterilant before use. Change gloves if any non-sterile surface is contacted.- Using the calibrated micropipette, load a sufficient quantity of the appropriate control plasmid for three injections. Perform all the injections at a depth of ~0.5 mm laterally into the placenta between the decidua (white) and junctional zone (dark red) (Figure 3A-F).
- Perform injections in the three control placentas.
NOTE: Perform all the control plasmid injections prior to the experimental injections to avoid cross-contamination of the plasmids with the micropipette. This will allow for the same micropipette to be used, as changing micropipettes and calibration time drastically increases the surgery time and decreases dam survival. - Perform electroporation of the control plasmid-injected placentas within 2 min of the injection.
- For electroporation, use a pair of 3 mm paddles attached to an electroporation machine. To ensure CRISPR incorporation efficiency and the viability of embryos, use the following electroporation settings: 2 pulses, 30 V, 30 ms pulse, 970 ms pulse off, unipolar.
- After injection but immediately prior to electroporation, coat the places of contact with sterile saline, applying the saline precisely to the three sites on the uterine wall and the paddles with a dropper or syringe.
- Gently press the electroporation paddles on the lateral sides of the placenta. Place the anode paddle over the injection site and the cathode directly opposite (Figure 4A-C).
- Press the pulse on the electroporation machine, and wait for the two pulses to complete prior to removing the electroporation paddles.
NOTE: A small amount of white foam is often seen between the paddles and placenta during pulses. If this does not occur, check the voltage from the paddles with a voltmeter before further use. If the reading on the voltmeter does not match the electroporation voltage setting, the paddles are nonfunctional.
- Placental injection and electroporation of the experimental plasmid
- Follow the same instructions from step 3.4.1. to step 3.4.2. using the experimental plasmid instead of the control plasmid.
- Perform electroporation of all three experimental injected placentas within 2 min of the injection. This should be performed in the same manner as for those injected with the control plasmids. Follow step 3.4.4. to step 3.4.7.
- Completion of the surgery
- Once the placental manipulation is complete, gently massage the uterine horns back inside the abdominal cavity using only fingers (Figure 5A).
- First, perform double-knotted single sutures on the peritoneum layer using coated and braided dissolvable sutures that are 45 cm long with a 13 mm 3/8c needle alloy. Space the sutures 2-3 mm apart (Figure 5B).
- After suturing the peritoneum layer, suture the skin with dissolvable sutures. Triple knot the single sutures 2-3 mm apart to ensure that the dam cannot undo the suturing (Figure 5C).
- Once the suturing is complete, set the isoflurane to 1% and the oxygen to 3.5 L/min, and apply tissue adhesive to the sutures on the skin (Figure 5D).
NOTE: Tissue adhesive is optional but recommended to prevent re-opening of the incision due to dam chewing. - When the tissue adhesive has dried, turn off the vaporizer, and remove the dam from the surgery area. Place the dam in a supportive cage on its back.
4. Post-surgery care and monitoring
- Allow the pregnant dam to recuperate in a clean cage under supervision for a minimum of 30 min to ensure no immediate complications of the surgery. Observe until it is fully ambulatory and can flip onto its feet without assistance. Singly house the dam post-surgery.
- Follow the institutional post-operative care and monitoring until embryo collection. Record the dam weight, and monitor the sutures and the incision site daily.
5. E14.5 placental collection
- On E14.5, deeply anesthetize the dam with a ketamine/xylazine cocktail (1 mg/mL ketamine and 0.1 mg/mL xylazine), and then cervically dislocate the dam.
- Make a V-shaped incision into the abdomen of the dam with scissors, and remove the uterus. Place immediately onto a 5 cm Petri dish on ice. Using forceps, carefully remove the embryo and the corresponding placenta from the uterus.
NOTE: Keep a record of the embryo location and corresponding placenta in the uterine horns to determine which received the direct manipulation during surgery. - Record the placental weights. Using RNAse-free forceps and razors, cut the placenta in half down the midline. Put one half into 4% PFA at 4 °C. Cut the remaining half in half again, and store the remaining two quarters at −80 °C in two tubes, one with RNA storage reagent.
NOTE: Embryos and other maternal tissues can be stored from the collection at −80 °C for future use.
6. Placental gene expression analysis
- Use the quarter of the placenta stored at −80 °C in RNA storage reagent.
- Process the placentas for qPCR as described in Elser et al. using the Trizol method for RNA isolation, a spectrophotometer for RNA concentration, a cDNA synthesis kit, and qPCR with SYBR Green Master Mix28. In place of the Turbo DNAfree kit DNAse referenced in Elser et al., use an RNAcleanup kit after the Trizol RNA isolation to ensure the samples do not contain contaminants28.
NOTE: Read the material safety data sheet (MSDS) for Trizol, and use it in a chemical fume hood. - Assess the plasmid insertion of the control plasmid with GFP primers and of the experimental plasmid with BLAST primers (primers listed in Supplementary Table 1). Use the CT value to determine the presence of the plasmid.
NOTE: CT values above 35 are false positives, and only those below 35 should be considered a positive indicator that the plasmid was successfully inserted. - Assess IGF-1 placental expression normalized to the housekeeping gene 18s (primers listed in Supplementary Table 1). Use the ddCT method to calculate the fold change, and then calculate the normalized fold change of the experimental samples to the mean fold change of the control samples.
7. Placental protein level analysis
- Use the quarter of the placenta that has been stored at −80 °C. Homogenize the tissue in a buffer solution made of 11.5 mM Tris HCl, 5 mM MgCl2, and 10 mM protease inhibitor in diH2O with a final pH of 7.4. Use a handheld homogenizer and pestle to break up the tissue.
NOTE: The sample should not exceed 10% of the volume of the buffer. - Dilute the homogenized samples in the buffer at 1:12, so that they are within the detectable range of a bicinchoninic acid assay (BCA) kit. Perform the BCA assay according to the manufacturer's instructions, and quantify the total protein using a plate reader.
- After performing the BCA assay, normalize all the samples to the same total protein concentration of 2 mg/mL for the IGF-1 ELISA, as done in Gumusoglu et al.29.
- Perform the IGF-1 ELISA according to the manufacturer's instructions, and quantify the IGF-1 protein levels with a plate reader using a standard concentration curve.
8. Spatial CRIPSR verification using fluorescent in situ hybridization labeling
- After the placental halves have been appropriately fixed in 4% PFA at 4 °C for 1-3 days, move them into 20% sucrose at 4 °C before freezing them in optimal cutting temperature (OCT) compound.
- Serially section the OCT-embedded placenta halves in a −20 °C cryostat into 10 µm sections, and place them onto slides to be labeled. Section the placenta halves so that all three subregions are visible. Store the slides at −80 °C until use for in situ hybridization.
- Perform fluorescence in situ hybridization (FISH) labeling following the manufacturer's protocols. Hybridize one slide with a dCas9-3xNLS-VP64 probe and a second "sister" slide of the same placenta with a Prl8a8 probe.
NOTE: The dCas9-3xNLS-VP64 probe detects the presence of the overexpression plasmid. The Prl8a8 probe highlights spongiotrophoblasts of the junctional zone, which allows for the subregions of the placenta to be identifiable. These two probes are labeled on separate "sister" slides to avoid interference of multi-channel fluorescence with the green autofluorescence in the placentas. - Label both probes with the detection dye (Opal 620). After completing the manufacturer's protocol for FISH, apply DAPI mounting medium, and place a coverslip on the slide. Seal the coverslip with clear nail polish.
- Image the slides on an upright compound fluorescence microscope, and process them using an appropriate image processing software. Here, the CellSens software was used.
Results
General procedure outcomes (Figure 6)
In the study, there were three manipulated groups. These included placentas injected with a general CRISPR Cas9 control plasmid (Cas9 Control), an activation control CRISPR plasmid (Act Control), or an IGF-1 SAM activation plasmid (Igf1-OE). The Cas9 Control is better suited for knockout plasmids, and the activation control is better suited for overexpression/activation plasmids. To assess the viability changes caused by manipulating the placentas via injection and electroporation, embryo survival within the litter was analyzed on E14.5 (Figure 6A). This timepoint was selected as other studies that have performed the in vivo insertion of CRISPR plasmids using electroporation have shown that expression changes can be achieved within 8-22 h30,31,32. Collection at E14.5 allows the CRISPR plasmid approximately 48 h to integrate and activate an increase in gene expression. It was found that surgical manipulation of the dam impacted the survival of all the embryos, but the embryos associated with the manipulated placentas that underwent injection and electroporation had significantly reduced survival. The survival rate of the untreated embryos (in the same litter but not undergoing targeted manipulation) was decreased from 100% survival to an average of 79.05%. There was a significant decrease in the survival of the manipulated embryos, with an average survival rate of 55.56%. No significant difference was found between the three manipulated groups.
To determine if significant gross changes occurred in the manipulated placentas, the placental weight was recorded. There was no significant difference in any group's placental weight (Figure 6B), and the gross appearance of the placenta and embryo was unchanged. Representative post-necroscopy images were taken on a dissection microscope at collection on E14.5. Images were taken of the placentas/embryos from different treatment groups, all within the same litter. There was no noticeable damage or change in the phenotypic appearance in any treatment groups either in the amniotic sac or the exposed embryo and its corresponding placenta (Figure 6D-I). While no gross differences were seen in the morphology of the manipulated groups with the use of an IGF-1 activation plasmid, this may not be true of other experimental plasmids targeting other genes that may more substantially impact essential growth and function regulators of the placenta or embryo. No differences were found in any measure between the Cas9 Control and Act Control placentas. Therefore, these two groups were combined and referred to as Con or Controls for all the analyses. These results demonstrate that the manipulation of placentas in utero on E12.5 using this technique causes a decrease in embryo survival, but there is still significant viability. The results also demonstrate that placental growth is overall not significantly impacted, as there was no significant change in weight between the manipulated and untreated placentas. This demonstrates that the proposed technique can allow for the survival of healthy and viable CRISPR-manipulated placentas and their corresponding embryos.
Dam weight change was recorded each day post-surgery prior to embryo collection on E14.5 (Figure 6C). The surgery took place on E12.5, so all the dam weight changes are listed relative to the weight on E12.5. The experimental (Exp) dams underwent placental manipulation, whereas sham dams underwent anesthesia and a laparotomy of similar duration with no placental manipulation. Many pregnant dams displayed a slight decrease or no change in weight the day after the procedure (E13.5); this was likely due to disrupted eating during and briefly after the surgery. Most dams showed increased weight on E14.5, but occasionally, a decrease in weight was still observed. Tracking of the maternal dam weight post-surgery allowed for the monitoring of embryo survival. Variation between the pregnant dams' weight post-surgery was common and did not indicate that all the treated embryos were lost. There were no significant differences in post-surgery weight changes in the sham versus experimental dams. This demonstrates that the well-being of the dam was generally preserved after the insertion of the CRISPR plasmids into the placenta. Overall, this shows that while this surgical technique can cause a decrease in the viability of embryos, it still yields a significant percentage of healthy progeny that can be used for the study.
Analysis of expression and CRISPR incorporation in E14.5 placentas (Figure 7)
To determine if the cellular insertion of the IGF-1 activation plasmid was successful for overexpressing IGF-1, qPCR was performed. As expected, the qPCR showed a significant increase in IGF-1 expression in the IGF1-OE placentas versus the control placentas when the fold change was normalized to 18s expression (Welch's t-test, p = 0.0302) (Figure 7A). To determine if the IGF-1 protein levels were altered, an ELISA was performed on the placentas from all the groups. Consistent with the qPCR, the ELISA assessment of the E14.5 placentas showed a significant increase in IGF-1 protein levels in the IGF1-OE placentas versus the control placentas (Welch's t-test, p = 0.0469) (Figure 7B). The qPCR and ELISA showed that the overexpression plasmid successfully increased IGF-1 gene expression and IGF-1 protein production, respectively.
To ensure that the delivery of the plasmid was specific to the manipulated placentas, qPCR was performed for the specific IGF-1 activation plasmid and CRISPR Cas9 Control plasmid. These qPCRs were performed on both the manipulated placentas and the untreated placentas that were adjacent to those injected. The qPCR primers used to assess the activation plasmid expression targeted a sequence of the BLAST plasmid, which is part of the activation system (Figure 7C). The untreated placentas showed no presence of the BLAST plasmid (cycle threshold [CT] undetermined, labeled as 40 on the graph), and the Igf1-OE placentas showed a CT around 30. The qPCR performed to assess the control plasmid expression targeted a sequence from the inserted GFP gene (Figure 7D). The untreated placentas showed CT values over 35, likely caused by primer dimerization, as these values are outside an expected range of expression. The controls showed a CT value of approximately 30. These qPCRs serve as a quality check to demonstrate the expected overexpression of IGF-1 or lack thereof and that the plasmids are only present in the expected manipulated placentas.
Spatial verification of the IGF-1 activation plasmid was performed using placental sections. Placentas that were fixed and frozen in OCT compound were serially sectioned at 10 µm onto slides so that all the layers were visible. The slides were then frozen at −80 °C until use for FISH labeling. To verify where within the placenta the IGF-1 CRISPR activation plasmid was incorporated, a dCas9-3xNLS-VP64 probe with red fluorescent labeling was used. This probe targets a functional component of the activation system. Green autofluorescence was used to demonstrate the subregions of the placental maternal-fetal interface (Figure 7E,F). No dCas9-3xNLS-VP64 was detected in the untreated placentas, as they had not been treated with CRISPR manipulation (Figure 7E). As expected, the IGF1-OE placentas displayed labeling for dCas9-3xNLS-VP64, as seen in red (Figure 7F). CRISPR incorporation was found in all three subregions of the placenta, with the clearest labeling of the junctional zone (Figure 7E). The fluorescence intensity of the dCas9-3xNLS-VP64 labeling varied across the plasmid-treated placentas, indicating that some expressed the plasmid more highly than others, and there were variations in the precise location/extent of the labeling, but labeling was generally present in all the subregions. To confirm the location of the dCas9-3xNLS-VP64 labeling, Prl8a8 FISH labeling targeting spongiotrophoblasts was performed to label the middle junctional subregion (Figure 7G,H). This was performed in adjacent sections from the same placenta on a "sister" slide of the sections that were labeled for dCas9-3xNLS-VP64. As expected, the structure indicated by Prl8a8 labeling was similar between the IGF1-OE and untreated placentas. The decidua and labyrinth zone could be identified by the blue nuclei (DAPI) labeling surrounding the red junctional zone (Figure 7G,H). The FISH labeling of dCas9-3xNLS-VP64 clarified that the plasmid was inserted into all three subregions, and this was confirmed with Prl8a8 labeling. The results of the FISH labeling confirmed that the incorporation of the IGF-1 activation plasmid was successful, and the plasmid did not migrate into untreated placentas.
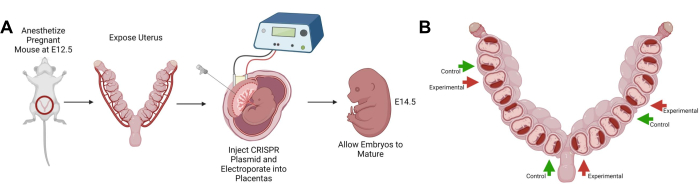
Figure 1: Schematic of the protocol. (A) Simplified schematic of the surgical procedure. Chronological order of the major steps of the technique. (B) Schematic displaying an example of manipulated placenta spacing within the uterine horns. Both panels were created with BioRender.com. Please click here to view a larger version of this figure.
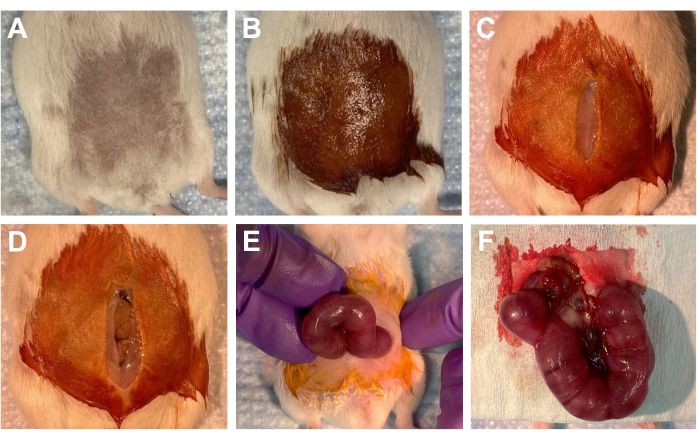
Figure 2: Uterine laparotomy procedure. (A-B) During surgery preparation, (A) the shaved abdomen of a dam, and (B) the shaved area coated with iodine solution. (C-F) In the surgery area, (C) a ~2 cm incision in the abdominal skin, and (D) a ~2 cm incision in the peritoneum; intestines are visible. (E) Manipulating the uterine horns through the incision site. Uterine horns are visible. (F) Completely exposed uterine horns placed on a sterile surgical drape. Please click here to view a larger version of this figure.
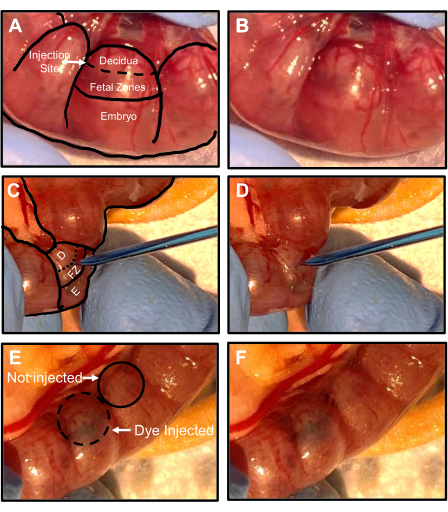
Figure 3: Injection of CRISPR plasmids into E12.5 placentas. (A,B) Orientation of the embryos and placenta within the uterine horns. (A) Oblique view of a labeled uterine horn showing decidua, fetal zones, and an embryo. The dashed line represents where the injection site should be. (B) An unlabeled uterine horn from panel A. (C,D) Side view of the micropipette inserted into the injection site in the placenta. D is the decidua, FZ is the fetal zones, E is the embryo, and the dashed line represents the injection site location. (D) Unlabeled image of the micropipette insertion from panel C. (E,F) Side view of dye in the placenta post-injection. (E) Labeled image of a uterine horn displaying a placenta that has been injected with a CRIPSR plasmid containing a visible dye and a placenta that has not been injected. (F) Unlabeled image of the uterine horn in panel E. Please click here to view a larger version of this figure.
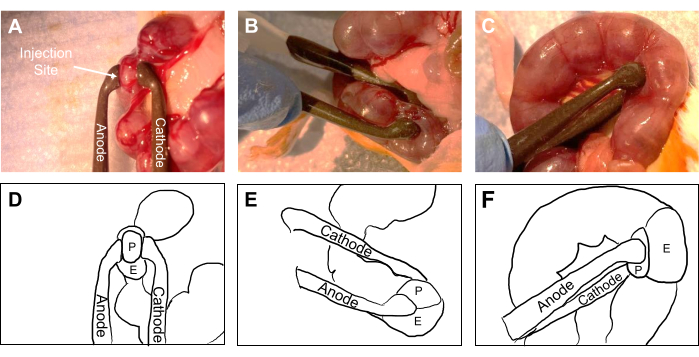
Figure 4: Electroporation of E12.5 placentas post-injection of CRISPR plasmids. (A) Top view of placentas in a uterine horn. The anode and cathode electroporation paddles are labeled, and the white arrow indicates the location of the injection site. (B) Oblique view of the electroporation of a placenta. (C) Side view of the electroporation of a placenta. (D-F) Simplified outline of panels A, B, and C. The anode and cathode paddles are labeled, P is the placenta, E is the embryo, and the unlabeled area is the uterus. Please click here to view a larger version of this figure.
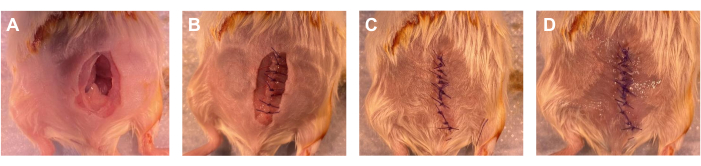
Figure 5: Suturing of the abdominal skin and peritoneum. (A) Uterine horns returned to the abdomen after the completion of the surgery. Abdominal skin and peritoneum incisions are visible. (B) Peritoneum incision completely sutured. (C) Abdominal skin incision completely sutured. (D) Application of tissue adhesive to the abdominal skin sutures. Please click here to view a larger version of this figure.
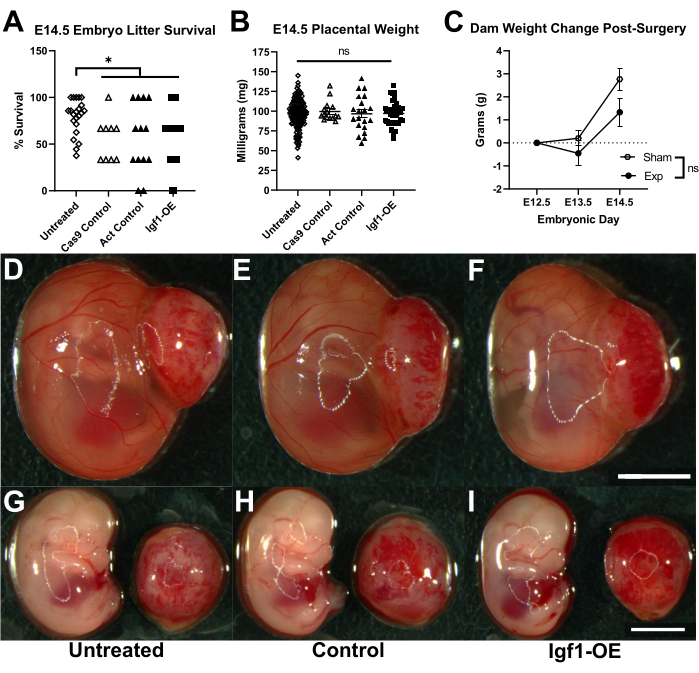
Figure 6: General procedure outcomes. (A) Embryo survival rates post-surgery collected on E14.5, 2 days post-procedure. A significant decrease in survival was observed in the manipulated groups versus the untreated embryos (Mann-Whitney U test: Untreated vs. Cas9 Control, p = 0.0077; Untreated vs. Act Control, p = 0.0330; and Untreated vs. IGF1-OE, p = 0.0032). No significant differences were observed in the survival of the manipulated groups (one-way ANOVA, p = 0.9454). Each point represents the survival percentage from a single litter (Untreated n = 22, Cas9 Control n = 9, Act Control n = 13, and IGF1-OE n = 22 litters). (B) Placental weight of the surviving embryos on E14.5 (one-way ANOVA, p = 0.1436) (Untreated n = 138, Cas9 Control n = 15, Act Control n = 20, and IGF1-OE n = 36 placentas). (C) Dam weight changes post-surgery on E13.5 and E14.5 seen in dams that underwent a sham laparotomy procedure or underwent experimental (Exp) placental manipulation. No significant difference is seen between the two groups of dams' weight changes post-surgery (Unpaired t-tests: E13.5 p=0.5452 and E14.5 p=0.2493) (Sham dams n=3 and Exp dams n=10). All error bars represent the SEM. (D-F) Images of E14.5 embryos post-necroscopy in the amniotic sac with the placenta still attached. (F) The scale bar in the far-right corner represents 3.75 mm. (G-I) Oblique image of the embryo and top view of the corresponding placenta. (I) The scale bar in the far-right corner represents 3.75 mm. (D-I) All the treatment group labels are listed below the images. Please click here to view a larger version of this figure.
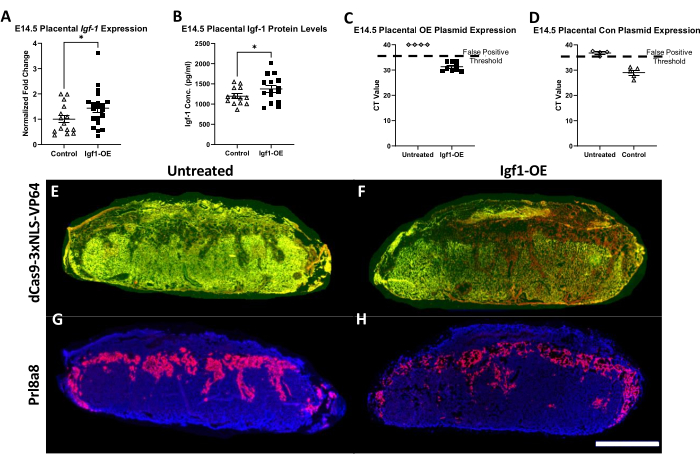
Figure 7: Analysis of expression and CRISPR incorporation in E14.5 placentas. (A) qPCR analysis of IGF-1 expression in E14.5 control and IGF1-OE placentas. A significant increase in IGF-1 expression normalized to 18s expression was observed in the IGF1-OE placentas (Welch's t-test, p = 0.0302) (Control n = 15 and IGF1-OE n = 20 placentas). (B) ELISA of IGF-1 protein levels in E14.5 control and IGF1-OE placentas. A significant increase in IGF-1 levels was observed in the IGF1-OE placentas compared to control levels (Welch's t-test, p = 0.0469) (Control n = 13 and IGF1-OE n = 15 placentas.) (C) qPCR analysis of BLAST sequence from the IGF-1 SAM plasmid. The expression of BLAST was found in the IGF1-OE placentas only, and no/undetermined expression was found in the untreated placentas (Untreated n = 4 and IGF1-OE n = 9 placentas). (D) qPCR analysis of the GFP sequence from the CRISPR Cas9 control plasmid. Expression of the plasmid was found in the control placentas, and CT values over 35/false positive results were found in the untreated samples (Untreated n = 4 and Control = 5 placentas). The dashed line represents the false positive threshold at 35 CT. Each data point is from one placenta. All error bars represent the SEM. (E-H) Fluorescence in situ hybridization of E14.5 placental sections at 10 µm thickness. (E) Untreated and (F) IGF1-OE placenta sections with a dCas9-3xNLS-VP64 probe labeled in red. The red signal is only present in the IGF1-OE placenta. The green signal is autofluorescence used to help identify the placental subregions. (G) Untreated and (H) IGF1-OE placenta sections with a Prl8a8 probe labeled in red to identify spongiotrophoblasts of the middle junctional zone. DAPI in blue shows the decidua and labyrinth zones that surround that junctional zone. (H) The scale bar in the far-right corner represents 2 mm. Please click here to view a larger version of this figure.
Supplementary Table 1: Primers used in this study. Please click here to download this File.
Discussion
The placenta is a primary regulator of fetal growth, and as previously noted, changes in placental gene expression or function may significantly impact fetal development6. The protocol outlined here can be used to perform a targeted in vivo CRISPR manipulation of the mouse placenta using a relatively advanced surgical approach. This technique allows for a significant yield of viable embryos and their corresponding placentas that can be used for further study (Figure 6A,B). This technique allowed us to successfully overexpress placental IGF-1 on E14.5 (Figure 7A,B). The plasmids used showed specificity, as the inserted plasmids remained in the manipulated placentas and were not present in the adjacent untreated placentas (Figure 7C,D). The spatial distribution of the IGF-1 activation plasmid was confirmed by FISH for dCas9-3xNLS-VP64 and Prl8a8, which demonstrated that the activation plasmid was present in the three subregions of the IGF1-OE placentas and not in any subregions of the untreated placentas (Figure 7E-H). This technique can be used to alter placental gene expression in ways which may not be possible with previous techniques. The use of this technique will allow for a greater understanding of the influence of placental gene expression and function on fetal development in multiple contexts.
To optimize the success of this procedure for maternal and fetal outcomes, the effects of changing multiple parameters were explored, including the injection and electroporation settings, as well as the materials used. To increase the dam survival and recovery, it was found that the time under anesthesia should not exceed 1 h, as longer surgery periods significantly decreased survival. If the time under anesthesia reaches approximately 2 hours, the likelihood of survival is dramatically decreased to levels below 20%, likely due to the negative effects of extended time under isoflurane. Other than the time under anesthesia, the most common complication of surgery that led to maternal death was the failure to properly tent the peritoneum while making the skin and peritoneum incisions. If the peritoneum is not properly tented, the intestines may be injured, which could cause death in the days post-surgery. The time the uterus is exposed also impacts the survival of the dam and embryos. The average time the uterus was exposed in successful experiments was approximately 15 min; over 30 min of exposure can lead to increased resorptions and possible maternal illness. The exposed uterus and any other exposed organs (often intestines) must be kept moist, but too much saline can cool the animal; when periodically moistening the exposed organs, less than 1 mL of sterile saline should be used.
The parameters of the injection and electroporation greatly impacted the embryo survival. The injection volume should not exceed approximately 4.5 µL, as this resulted in resorptions. The injection time and pressure are important to maximize survival; the injection time should be set between 0.5 s and 1.5 s, though 0.8 s appeared optimal. The pressure should be set between 1-8.5 psi. Low embryo survival rates were seen with low injection times and high injection PSI levels. It was also observed that if the micropipette was too blunt, there could be a decrease in embryonic viability, and the solution will also often leak out of the micropipette. The type of dye used to visualize the injections can impact survival. Methylene blue led to maternal death when used for this purpose, but a filtered Fast Green dye solution showed no negative impacts on maternal health. The electroporation settings were optimized from the recommended manufacturer settings based on previous electroporation studies in vivo33. Electroporation was found to be the manipulation that caused the most damage and decreased embryo survival. The recommended in vivo embryo electroporation settings suggest four pulses to maximize the CRISPR efficiency, but two pulses are recommended for a higher survival rate33. It was found that four pulses caused nearly all the embryos to resorb. Two pulses allowed for increased viability while maintaining the CRISPR efficiency. The size of the electroporation paddle significantly impacted the embryo survival as well. It was found that 5 mm electroporation paddles led to almost complete resorption when used with the recommended settings. Indeed, 3 mm electroporation paddles are recommended in the manufacturer's guide and significantly increase embryo viability33. It is also important to note that many electroporation paddles have certain pulse lives. After they have been used to this maximum, a decrease in quality can be seen. This can be identified if there is no formation of a small white foam between the paddles and placenta during a pulse. The electroporation paddle voltage can be checked using a voltmeter to determine if it is producing the expected voltage.
This study is limited in a few ways. This technique is time-specific and likely best performed no earlier than E10.5 and no later than E16.5. This is due to the placenta being too small prior to E10.5, and after E16.5, the plasmid may not have enough time to produce the desired effect. This timeframe means this technique is better suited for specific types of studies in mice. This technique is useful for studying neurodevelopment, as E12.5 falls within a crucial time of neurogenesis for many structures within the brain34. This technique may not be useful for studying placental impacts on the early stages of development, such as neural plate formation, which takes place on E8.535. The results of a knockout CRISPR plasmid are not known at this time; the application of this method to gene expression reduction needs further investigation as only the overexpression/activation of a gene has been demonstrated. Despite this, it is anticipated that this technique would also be successful for the insertion of a knockout CRISPR plasmid.
This technique could also allow for the possibility of performing a primary culture of genetically modified placental tissue36. Depending on the type of CRISPR used, such as CRISPRi and CRISPRa, a primary culture could be used to perform a rescue study37,38. This technique could also be used to further explore links between placental genetic and functional abnormalities and problems in offspring. Specifically, a previous study found a significant correlation between placental-specific genomic risk scores and schizophrenia risks39. This study identified many placental genes that may play a role in schizophrenia development that have not been explored in animal models. This technique lends itself to further studies of this type and others.
The knowledge gained from CRISPR modification of the placenta could be translated into a range of different biomedical applications. Studies that identify how specific gene expression in the placenta can impact fetal development could be used to create placental-targeted pharmacological interventions that could treat these abnormalities. Treatments targeted directly to a fetus can be difficult and dangerous40,41. The placenta is a more accessible target for treatment. In the case of developmental problems in the heart or brain that may be modifiable prenatally, direct heart or brain manipulation is high risk. Such risk could be avoided with placental intervention, which is more plausible and could lead to preventative strategies for neurodevelopmental disorders for which the molecular environment, which is in part provided by the placenta, may be critical5. This technique could be also utilized to treat diseases such as congenital heart disease, which has been linked to placental disorders9. As congenital heart disease is a common birth defect, the possibility of a placental intervention treatment could have a significant impact8. As the placenta has many functions, this technique could be used to advance the development of interventions for multiple diseases. Overall, this placental targeted technique could be used to further the understanding of the influence of placental genetics and function on multiple areas of fetal development.
Disclosures
The authors have nothing to disclose.
Acknowledgements
The authors acknowledge the following funding sources: R01 MH122435, NIH T32GM008629, and NIH T32GM145441. The authors thank Dr. Val Sheffield and Dr. Calvin Carter's labs at the University of Iowa for the use of their surgery room and equipment, as well Dr. Eric Van Otterloo, Dr. Nandakumar Narayanan, and Dr. Matthew Weber for their assistance with microscopy. The authors also thank Dr. Sara Maurer, Maya Evans, and Sreelekha Kundu for their assistance with the pilot surgeries.
Materials
| Name | Company | Catalog Number | Comments |
|---|---|---|---|
| 1.5 ml Tubes | USA Scientific Inc | 1615-5500 | |
| 4% Paraformeldhyde (PFA) in PBS | Thermo Fisher Scientific | J61899.AP | |
| 96 Well plate | Cornings | 3598 | For BCA kit |
| Absorbent Underpads | Fisher Scientific | 14-206-62 | |
| Activation Control Plasmid | Santa Cruz Biotechnology | sc-437275 | Dnase-free water provided for dilution |
| AMV Reverse Transcriptase | New England Biolabs | M0277L | Use for cDNA synthesis |
| Anesthetic Gas Vaporizor | Vetamac | VAD-601TT | VAD-compact vaporizer |
| Artifical Tear Gel | Akorn | NDC 59399-162-35 | |
| BCA Protein Assay Kit | Thermo Fisher Scientific | 23227 | Protein quantification |
| Biovortexer | Bellco Glass, Inc. | 198050000 | Hand-held tissue homogenizer |
| CellSens Software | Olympus | V4.1.1 | Image processing to FISH images. |
| Centrifuge 5810 | Eppendorf | EP022628168 | Plate centrifuge |
| Chloroform | Thermo Fisher Scientific | J67241-AP | RNA isolation |
| Cotton Tipped Applicators | ProAdvantage | 77100 | Sterilize before use |
| CRISPR/Cas9 Control Plasmid | Santa Cruz Biotechnology | sc-418922 | Dnase-free water provided for dilution |
| CryoStat | Leica | CM1950 | |
| Dissection Microscope | Leica | M125 C | Used for post-necroscopy imaging |
| Dissolvable Sutures | Med Vet International | J385H | |
| Distilled Water | Gibco | 15230162 | |
| Dulbecco's Phosphate Buffered Saline (DPBS) | Thermo fisher Scientific | 14190144 | (-) Calcium; (-) Magnesium |
| ECM 830 Electro Electroporator (Electroporation Machine) | BTX Harvard Apparatus | 45-0662 | Generator only |
| Electric Razor | Wahl | CL9990 | Kent Scientific |
| Electroporation paddles/Tweezertrodes | BTX Harvard Apparatus | 45-0487 | 3 mm diameter paddles; wires included |
| Embedding Cassette: 250 PK | Grainger | 21RK94 | Placenta embedding cassettes |
| Ethanol | Thermo Fisher Scientific | 268280010 | |
| F-Air Canisters | Penn Veterinary Supply Inc | BIC80120 | Excess isoflurane filter |
| Fast Green Dye FCF | Sigma | F7252-5G | Dissolve to 1 μg/ml and filter; protect from light |
| Filter-based microplate photometer (plate reader) | Fisher Scientific | 14377576 | Can be used for BCA and ELISA |
| Forceps | VWR | 82027-386 | Fine tips, straight, serrated |
| Formalin solution, neutral buffered, 10% | Sigma Aldrich | HT501128 | |
| Glass Capillaries - Borosilicate Glass (Micropipette) | Sutter Instrument | B150-86-10 | O.D.: 1.5 mm, I.D.: 0.86 mm, 10 cm length |
| Halt Protease and Phosphotase inhibitor cocktail (100x) | Thermo Scientific | 1861281 | Protein homogenization buffer |
| Heating Pad | Thermotech | S766D | Digitial Moist Heating Pad |
| Hemostats | VWR | 10806-188 | Fully surrated jaw; curved |
| Hot Water Bath | Fisher Scientific | 20253 | Isotemp 205 |
| Igf-1 SAM Plasmid (m1) | Santa Cruz Biotechnology | sc-421056-ACT | Dnase-free water provided for dilution |
| Induction Chamber | Vetamac | 941443 | No specific liter size required |
| Isoflurane | Piramal Pharma Limited | NDC 66794-013-25 | |
| Isoproponal/2-Proponal | Fisher Scientific | A451-4 | RNA isolation |
| Ketamine HCl 100mg/ml | Akorn | NDC 59399-114-10 | |
| MgCl2/Magneisum Chloride | Sigma Aldrich | 63069-100ML | 1M. Protein homogenization buffer |
| MicroAmp™ Optical 384-Well Reaction Plate with Barcode | Fisher Scientific | 4309849 | Barcoded plates not required |
| Microcapillary Tip | Eppendorf | 5196082001 | Attached to BTX Microinjector |
| Microinjector | BTX Harvard Apparatus | 45-0766 | Stainless Steel Pipette Holder, 130 mm Length, for 1 to 1.5 mm Pipettes |
| Microject 1000A (Injection Machine) | BTX Harvard Apparatus | 45-0751 | MicroJect 1000A Plus System |
| Micropipette Puller Model P-97 | Sutter Instrument | P-97 | Flaming/Brown type micropipette puller |
| Microplate Mixer (Plate Shaker) | scilogex | 822000049999 | |
| Mouse/Rat IGF-I/IGF-1 Quantikine ELISA Kit | R & D Systems | MG100 | |
| Needles | BD - Becton, Dickson, and Company | 305106 | 30 Gx 1/2 (0.3 mm x 13 mm) |
| Nitrogen Tank | Linde | 7727-37-9 | Any innert gas |
| Non-Steroidal Anti-Inflammatory Drug (NSAID) | Norbrook Laboratories Limited | NDC 55529-040-10 | Analesgic such as Meloxicam |
| Nose Cone | Vetamac | 921609 | 9-14 mm |
| Opal 620 detection dye | Akoya Biosciences | SKU FP1495001KT | Used for FISH |
| Optimal Cutting Temperature (O.C.T) Compound | Sakura | 4583 | |
| Oxygen Tank | Linde | 7782 - 44 - 7 | Medical grade oxygen |
| Pestles | USA Scientific Inc | 14155390 | |
| Povidone-Iodine Solution, 5% | Avrio Health L.P. | NDC 67618-155-16 | |
| Power SYBR™ Green PCR Master Mix | Thermo Fisher Scientific | 4367659 | Use for qPCR |
| Random Hexamers (Random Primers) | New England Biolabs | S1330S | Use for cDNA synthesis |
| Razor Blade | Grainger | 26X080 | |
| RNA Cleanup Kit & Concentrator | Zymo Research | R1013 | |
| RNALater | Thermo Fisher Scientific | AM7021 | |
| RNAscope kit v.2.5 | Advanced Cells Diagnostics | 323100 | Contains all reagents required for fluorescent in situ hybridization. Probes sold separately. |
| RNAscope™ Probe- Mm-Prl8a8-C2 | Advanced Cells Diagnostics | 528641-C2 | |
| RNAscope™ Probe- Vector-dCas9-3xNLS-VP64 | Advanced Cells Diagnostics | 527421 | |
| Roto-Therm Mini | Benchmark | R2020 | Dry oven for in situ hybridization |
| Scissors | VWR | 82027-578 | Dissecting Scissors, Sharp Tip, 4¹/? |
| Sodium Chloride (Saline) | Hospra | NDC 0409-4888-03 | Sterile, 0.9% |
| Sodium Citrate, Trisodium Salt, Dihydrate, [Citric Acid, Trisodium Dihydrate] | Research Product International | 03-04-6132 | |
| Sodium Hydroxide 1N Concentrate, Fisher Chemical | Fisher Scientific | SS277 | Protein homogenization buffer |
| Steamer | Bella | B00DPX8UBA | |
| Sterile Surgical Drape | Busse | 696 | Sterilize before use |
| Superfrost Plus Microscope Slides | Fisher Scientific | 12-550-15 | |
| Surgipath Cover Glass 24x60 | Leica | 3800160 | |
| Syringes | BD - Becton, Dickson, and Company | 309659 | BD Luer Slip Tip Syringe sterile, single use, 1 mL |
| Thermo Scientific™ Invitrogen™ Nanodrop™ One Spectrophotometer with WiFi and Qubit™ 4 Fluorometer | Fisher Scientific | 13-400-525 | This configuration comes with Qubit 4 fluorometer. Qubit quantification not required. |
| Tissue Adhesive | 3M | 1469SB | VetBond |
| Tris HCl | Thermo Fisher Scientific | 15568025 | 1M. Protein homogenization buffer |
| TRIzol™ Reagent | Thermo Fisher Scientific | 15596018 | RNA isolation |
| TSA Buffer Pack | Advanced Cells Diagnostics | 322810 | Used to dilute Opal 620 detection dye |
| Universal F-Circuit | Vetamac | 40200 | Attached to vaporizer and vaporizer accessories |
| Upright Compound Fluorescence Microscope | Olympus | BX61VS | Used for FISH imaging |
| Vectorshield with DAPI | Vector Laboratories | H-1200 | Coverslip mounting media |
| ViiA™ 7 Real-Time PCR System with 384-Well Block | Thermo Fisher Scientific | 4453536 | This is for SYBR 384-well block detection. TaqMan and/or smaller blocks available |
| Wet n Wild Nail Polish Wild Shine, Clear Nail Protector, Nail Color | Amazon | C450B | |
| Xylazine 20mg/ml | Anased | 343730_RX |
References
- Cross, J. C., et al. Genes, development and evolution of the placenta. Placenta. 24 (2-3), 123-130 (2003).
- Perez-Garcia, V., et al. Placentation defects are highly prevalent in embryonic lethal mouse mutants. Nature. 555 (7697), 463-468 (2018).
- Rosenfeld, C. S. The placenta-brain-axis. Journal of Neuroscience Research. 99 (1), 271-283 (2021).
- Maslen, C. L. Recent advances in placenta-heart interactions. Frontiers in Physiology. 9, 735(2018).
- Kundu, S., Maurer, S. V., Stevens, H. E. Future horizons for neurodevelopmental disorders: Placental mechanisms. Frontiers in Pediatrics. 9, 653230(2021).
- Woods, L., Perez-Garcia, V., Hemberger, M. Regulation of placental development and its impact on fetal growth-new insights from mouse models. Frontiers in Endocrinology. 9, 570(2018).
- Goeden, N., et al. Maternal Inflammation disrupts fetal neurodevelopment via increased placental output of serotonin to the fetal brain. Journal of Neuroscience. 36 (22), 6041-6049 (2016).
- vander Bom, T., et al. The changing epidemiology of congenital heart disease. Nature Reviews Cardiology. 8 (1), 50-60 (2011).
- Wilson, R. L., et al. Analysis of commonly expressed genes between first trimester fetal heart and placenta cell types in the context of congenital heart disease. Scientific Reports. 12 (1), 10756(2022).
- Renaud, S. J., Karim Rumi, M. A., Soares, M. J. Review: Genetic manipulation of the rodent placenta. Placenta. 32, S130-S135 (2011).
- Wenzel, P. L., Leone, G. Expression of Cre recombinase in early diploid trophoblast cells of the mouse placenta. Genesis. 45 (3), 129-134 (2007).
- Zhou, C. C., et al. Targeted expression of Cre recombinase provokes placental-specific DNA recombination in transgenic mice. PLoS One. 7 (2), e29236(2012).
- Wattez, J. S., Qiao, L., Lee, S., Natale, D. R. C., Shao, J. The platelet-derived growth factor receptor alpha promoter-directed expression of cre recombinase in mouse placenta. Developmental Dynamics. 248 (5), 363-374 (2019).
- Nadeau, V., et al. Map2k1 and Map2k2 genes contribute to the normal development of syncytiotrophoblasts during placentation. Development. 136 (8), 1363-1374 (2009).
- Chakraborty, D., Muto, M., Soares, M. J. Ex vivo trophoblast-specific genetic manipulation using lentiviral delivery. BioProtocol. 7 (24), e2652(2017).
- Okada, Y., et al. Complementation of placental defects and embryonic lethality by trophoblast-specific lentiviral gene transfer. Nature Biotechnology. 25 (2), 233-237 (2007).
- Lecuyer, M., et al. a placental marker of fetal brain defects after in utero alcohol exposure. Acta Neuropathologica Communications. 5 (1), 44(2017).
- Jones, H. N., Crombleholme, T., Habli, M. Adenoviral-mediated placental gene transfer of IGF-1 corrects placental insufficiency via enhanced placental glucose transport mechanisms. PLoS One. 8 (9), e74632(2013).
- Jones, H., Crombleholme, T., Habli, M. Regulation of amino acid transporters by adenoviral-mediated human insulin-like growth factor-1 in a mouse model of placental insufficiency in vivo and the human trophoblast line BeWo in vitro. Placenta. 35 (2), 132-138 (2014).
- Song, A. J., Palmiter, R. D. Detecting and avoiding problems when using the Cre-lox system. Trends in Genetics. 34 (5), 333-340 (2018).
- Chuah, M. K., Collen, D., VandenDriessche, T. Biosafety of adenoviral vectors. Current Gene Therapy. 3 (6), 527-543 (2003).
- Evers, B., et al. CRISPR knockout screening outperforms shRNA and CRISPRi in identifying essential genes. Nature Biotechnology. 34 (6), 631-633 (2016).
- Rossant, J., Cross, J. C. Placental development: Lessons from mouse mutants. Nature Reviews Genetics. 2 (7), 538-548 (2001).
- Elmore, S. A., et al. Histology atlas of the developing mouse placenta. Toxicologic Pathology. 50 (1), 60-117 (2022).
- Sferruzzi-Perri, A. N., Sandovici, I., Constancia, M., Fowden, A. L. Placental phenotype and the insulin-like growth factors: Resource allocation to fetal growth. The Journal of Physiology. 595 (15), 5057-5093 (2017).
- Agrogiannis, G. D., Sifakis, S., Patsouris, E. S., Konstantinidou, A. E. Insulin-like growth factors in embryonic and fetal growth and skeletal development (Review). Molecular Medicine Reports. 10 (2), 579-584 (2014).
- Wang, L., Jiang, H., Brigande, J. V. Gene transfer to the developing mouse inner ear by in vivo electroporation. Journal of Visualized Experiments. (64), e3653(2012).
- Elser, B. A., et al. Combined maternal exposure to cypermethrin and stress affect embryonic brain and placental outcomes in mice. Toxicological Sciences. 175 (2), 182-196 (2020).
- Gumusoglu, S. B., et al. Chronic maternal interleukin-17 and autism-related cortical gene expression, neurobiology, and behavior. Neuropsychopharmacology. 45 (6), 1008-1017 (2020).
- Liu, F., Huang, L. Electric gene transfer to the liver following systemic administration of plasmid DNA. Gene Therapy. 9 (16), 1116-1119 (2002).
- Kalli, C., Teoh, W. C., Leen, E. Introduction of genes via sonoporation and electroporation. Advances in Experimental Medicine and Biology. 818, 231-254 (2014).
- Wu, W., et al. Efficient in vivo gene editing using ribonucleoproteins in skin stem cells of recessive dystrophic epidermolysis bullosa mouse model. Proceedings of the National Academy of Sciences of the United States of America. 114 (7), 1660-1665 (2017).
- Nakamura, H. Electroporation and Sonoporation in Developmental Biology. , Springer. Tokyo, Japan. (2009).
- Bond, A. M., et al. Differential timing and coordination of neurogenesis and astrogenesis in developing mouse hippocampal subregions. Brain Sciences. 10 (12), 909(2020).
- Kojima, Y., Tam, O. H., Tam, P. P. Timing of developmental events in the early mouse embryo. Seminars in Cell & Developmental Biology. 34, 65-75 (2014).
- Pennington, K. A., Schlitt, J. M., Schulz, L. C. Isolation of primary mouse trophoblast cells and trophoblast invasion assay. Journal of Visualized Experiments. (59), e3202(2012).
- Mandegar, M. A., et al. CRISPR Interference efficiently induces specific and reversible gene silencing in human iPSCs. Cell Stem Cell. 18 (4), 541-553 (2016).
- Dai, Z., et al. Inducible CRISPRa screen identifies putative enhancers. Journal of Genetics and Genomics. 48 (10), 917-927 (2021).
- Ursini, G., et al. Placental genomic risk scores and early neurodevelopmental outcomes. Proceedings of the National Academy of Sciences of the United States of America. (7), e2019789118(2021).
- Smajdor, A. Ethical challenges in fetal surgery. Journal of Medical Ethics. 37 (2), 88-91 (2011).
- Antiel, R. M. Ethical challenges in the new world of maternal-fetal surgery. Seminars in Perinatology. 40 (4), 227-233 (2016).
Reprints and Permissions
