This protocol follows the guidelines of Lifenet Health's ethics committee. The manuscript does not contain any studies with human participants or animal studies performed by any of the authors. All cells were isolated from donor tissue fully consented for research purposes by Lifenet Health.
1. Medium preparation
- Thaw one bottle each feeder cell thawing medium, supplement A, supplement B, and supplement C (see Table of Materials) in a 37 °C water bath or 16-24 h at 4 °C.
- Aliquot the entire bottle (10 mL) of feeder cell thawing medium into a 15 mL or 50 mL conical tube.
NOTE: The size of the cell pellet will be easier to view using a 15 mL conical tube. - Add 4.5 mL of supplement B and 11 mL of supplement A to one bottle of plating medium (75 mL) (see Table of Materials) to make a complete plating medium.
NOTE: Complete plating medium has a concentration of FBS <5% v/v. - Into a separate bottle, add 100 mL of culture medium (see Table of Materials), 1 mL supplement C, and 14 mL supplement A to make a complete culture medium.
NOTE: Complete culture medium has a concentration of FBS <1% v/v - Store remaining supplement C and supplement A at -20 °C until week 2 medium preparation.
NOTE: Repeated freeze-thaw cycles will reduce the shelf life of the supplements. It is recommended to only freeze-thaw one time. - Prior to use, warm 10 mL of feeder cell thawing medium, hepatocyte thawing medium, complete plating medium, and complete culture medium for 20-30 min in a 37 °C water bath.
2. Thawing, counting, and plating human feeder cells (Figure 1A)
- Culture the feeder cells approximately 1 h prior to seeding PHHs. Thaw feeder cells (see Table of Materials) in a 37 °C water bath for 1-2 min.
NOTE: Avoid prolonged exposure (e.g., >2 min) by monitoring thawing and removing the vial when liquid becomes loose in the cryovial when inverted. - Immediately after thawing, place the feeder cells on ice.
- Using aseptic techniques, in a biosafety cabinet (BSC), add freshly thawed cells to 10 mL of feeder cell thawing medium.
- Use a 1000 µL pipette to wash the vial once with 1 mL of cell/thaw medium suspension and collect.
- Spin at 400 x g for 4 min at room temperature (RT).
- Carefully discard the supernatant to not disturb the cell pellet by pipetting or vacuum aspiration. Resuspend cell pellet in 1 mL of complete plating medium and count the feeder cells.
NOTE: Feeder cells can be counted using acridine orange and propidium iodide (AOPI) on an automated cell counter or trypan blue using a hemacytometer. Cell counts may vary depending on technology and user. For best results, count duplicate samples and remain consistent in the chosen methodology. - Dilute the cell suspension to 100,000 cells/mL using the complete plating medium.
- Plate 500 µL (50,000 cells) per well of the diluted cell suspension onto a collagen-coated 24-well plate (see Table of Materials).
- Shake the plate in a North (N)-South (S)-East (E)-West (W) motion by using a back-and-forth motion in the N-S direction 2 times followed by the same motion E-W. Repeat this shaking protocol 2 more times for a total of 3 rounds.
NOTE: Perform shaking using moderate force to avoid splashing on the plate lid while still assisting in cell distribution (please refer to video). - Incubate at 37 °C/5% CO2 for 60 min.
- View feeder cell attachment before proceeding to thawing hepatocytes.
NOTE: Acceptable feeder cell attachment is visually approximately 50% confluent.
3. Thawing, counting, and plating primary human hepatocytes (Figure 1B)
- Following 30 min of feeder cell culture, filter pre-warmed hepatocyte thawing medium through a 0.2 µm polyethersulfone (PES) filter unit.
- Thaw PHHs in a 37 °C water bath for 1-2 min.
NOTE: Avoid prolonged exposure (e.g., >2 min) by monitoring thawing and removing the vial when liquid becomes loose in the cryovial when inverted. - Immediately after thawing, place PHHs on ice.
- In a BSC, pour PHH suspension into the hepatocyte thawing medium.
NOTE: Avoid pipetting PHH cell suspensions when possible. It is most critical to perform no pipetting during the transfer of thawed PHHs from the cryovial to the thawing medium. - Use a 1000 µL pipette to wash the vial 3-4 times by gently pipetting 1 mL of hepatocyte/thaw medium suspension back into the vial and collecting the wash by pouring it back into the thaw medium.
- Cap and gently invert thawed PHH suspension 5 times.
- Spin at 100 x g for 8 min at RT.
- Carefully discard the supernatant to not disturb the cell pellet by pipetting or vacuum aspiration. To the wall of the conical tube, add 3 mL of complete plating medium.
- Rock the conical tube side to side to resuspend the cell pellet.
- Add an additional 5 mL of complete plating medium to the resuspended hepatocytes.
- Count PHHs.
NOTE: PHHs can be counted using AOPI on an automated cell counter or trypan blue using a hemacytometer. Cell counts may vary depending on technology and user. For best results, count duplicate samples and remain consistent in the chosen methodology. - Dilute the cell suspension to the desired seeding density (300,000-600,000 PHHs/mL) using the complete plating medium.
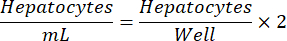
NOTE: Optimal hepatocyte seeding density may vary from lot to lot. The recommended seeding density for a given lot will be provided in the certificate of analysis (COA). Use the below equation to determine hepatocytes/mL for a 24-well plate.
- From the plated feeder cells, remove the medium by pipetting or vacuum aspiration.
NOTE: To ensure the viability of the feeder cells, it is recommended to change no more than 3 wells at a time. - Immediately plate 500 µL (150,000-300,000 cells) per well of the diluted hepatocyte suspension onto the pre-coated collagen 24-well plate containing feeder cells.
- Shake the plate in a N-S-E-W motion by using a back-and-forth motion in the N-S direction 2 times followed by the same motion E-W. Repeat this shaking protocol 2 more times for a total of 3 rounds.
NOTE: Perform shaking using moderate force to avoid splashing on the plate lid while still assisting in cell distribution. - Incubate at 37 °C/5% CO2 for 2-4 h. For the first 60 min of culture, shake the plate every 15 min in N-S-E-W motion as in step 3.15 above.
- Following incubation, remove the plate from the incubator and place it in BSC.
- Shake the plate and remove the complete plating medium by pipetting or vacuum aspiration.
NOTE: To ensure the viability of the culture, it is recommended to change no more than 3 wells at a time. - Immediately add 500 µL of pre-warmed complete culture medium to each well.
4. Maintenance
- Aliquot and pre-warm complete culture medium in a 37 °C water bath for 20-30 min. Approximately 13.5 mL of medium is needed for one 24-well plate.
- Feed cultures daily with 500 µL per well of fresh, pre-warmed complete culture medium.
NOTE: To ensure the viability of the culture, it is recommended to change no more than 3 wells at a time. - Prepare fresh complete culture medium every 7 days.
5. Collection of culture supernatant samples for measurement of albumin and urea
- At days 7, 10, and 14, collect 500 µL of medium from the desired sample well(s) into a microcentrifuge tube(s), as shown in Figure 1C.
- Spin the sample(s) at 320 x g for 10 min at 4 °C to pellet debris.
- Use a pipette to transfer sample supernatant(s) into new microcentrifuge tube(s), avoiding disruption of the pellet.
- Run the samples on the albumin and/or urea assay (see sections 10 and 11, respectively).
NOTE: Samples can be stored at -20 °C to -80 °C for 2 weeks.
6. Staining day I
CAUTION: Fixation buffer contains Paraformaldehyde. Paraformaldehyde can cause eye damage, skin irritation, and organ toxicity. Work in an area with good ventilation and wear appropriate personal protection equipment (PPE).
- Following the collection of medium samples on day 14, add 300 µL of fixation buffer (see Table of Materials) to each well to be stained, as shown in Figure 1C. Stain a minimum of 2 wells.
- Incubate at 4 °C for 20-60 min.
- Prepare 1x permeabilization buffer (see Table of Materials) by adding 5 mL of 10x stock solution to 45 mL of 1x PBS (see Table of Materials).
NOTE: The 1x permeabilization buffer can be stored at 4° C for 1 month. - Wash 2 times with 300 µL of 1x permeabilization buffer on ice.
- Add 300 µL of primary antibody cytokeratin 18 (see Table of Materials) using a 1:1000 dilution in 1x permeabilization buffer on ice.
NOTE: Minimally, incubate one well with 1x permeabilization buffer only for a secondary antibody-only control. - Incubate 16-24 h at 4 °C.
7. Staining day II
- The following day, remove the primary antibody by pipetting or vacuum aspiration.
- Wash 2 times with 300 µL per well of 1x permeabilization buffer on ice.
- Add 300 µL of fluorescent secondary antibody (see Table of Materials) using a 1:500 dilution in 1x permeabilization buffer (include secondary only control).
NOTE: Avoid light when using fluorescent antibodies. - Incubate for 30-45 min at 4 °C in dark.
- Remove the secondary antibody by pipetting or vacuum aspiration.
- Wash 2 times with 300 µL per well of 1x permeabilization buffer on ice.
- Wash 1 time with 300 µL per well of 1x PBS.
- Add 150 µL of 4′,6-diamidino-2-phenylindole (DAPI) mounting medium (see Table of Materials) to each well and incubate for 15 min at RT in the dark.
NOTE: Plate can be wrapped in parafilm and stored at 4 °C in the dark for 1 week. - View under a fluorescent microscope. Capture 5 images of each specific fluorescent channel for each well using the 10x objective lens (ensure one image has a scale bar).
NOTE: DAPI has an excitation/emission of 358 nm/461 nm. Use a fluorescent microscope equipped with the appropriate detection filters for both DAPI and the secondary antibody fluorophore.
8. ImageJ analysis (Figure 2)
NOTE: It is recommended to use ImageJ Version 1.52a or higher.
- Open an image containing a scale bar in ImageJ. Click the Straight Line icon and draw a line to the exact length of the scale bar [Figure 2 (1)]
NOTE: If needed, click the Magnify Glass icon to zoom in or out. - Click on the Analyze tab. Highlight and click Set Scale.
- Change Known Distance to the distance of the scale bar. Change Units of Length to the units of the scale bar. Globally apply the settings by checking Global. Click OK to set the scale.
NOTE: Once this setting is applied, every image opened will show the calculated area of the field of view in units input by the user. - Open a DAPI-only image in ImageJ. Click on the Process tab and highlight Subtract Background. Remove the background 50 pixels at a time until the unstained areas are black.
NOTE: If the image does not contain background, this step is not required. - Click Image tab and highlight Type. Click on 8-bit to make the image grayscale [Figure 2 (2)].
- Threshold the image manually or automatically to include all the DAPI particles (use caution not to manually over the threshold) [Figure 2 (3)]. Click the Image tab and highlight Adjust. Click Threshold. Click Apply when complete.
- Click the Process tab and highlight Binary. Click Watershed.
- Click the Analyze tab and highlight /click Analyze Particles [Figure 2 (4)]. Set the Size to 5-Infinity and Circularity to 0.00-1.00. In the Show drop-down tab, select Outlines. Ensure Display Results, Summarize, and Include Holes are checked. Click OK.
NOTE: The desired particle range can be adjusted if thresholding yields background pixels. - Record the count result as TOTAL DAPI.
- Open a merged Cytokeratin 18/DAPI image in ImageJ.
- Use the Multi-Point [Figure 2 (5)] icon to count all DAPI particles unstained for Cytokeratin 18 manually.
- Record result as FEEDER CELLS. Use the equation below to determine hepatocyte DAPI.
Hepatocyte DAPI = Total DAPI – Feeder Cell DAPI
9. Quantitation of total attached hepatocytes and percent attachment (Plateability)
- Create a scale factor for the 24-well culture area using the equation below. Field of view measurements can be found at the top of each image opened [Figure 2 (2), green box].

- Calculate the total attached hepatocytes using the equation below.
Attached Hepatocytes = Scale factor × Hepatocyte DAPI - Calculate the percent attachment of the hepatocytes using the equation below.

10. Albumin assay
- Measure the albumin production using a sandwich enzyme-linked immunosorbent assay (ELISA) (see Table of Materials) on samples diluted at 1:200.
NOTE: For accuracy, the user confirms that the samples fall within the standard curve linear range. The specified kit provides all materials and instructions to perform the assay. - Normalize sample concentrations to attached hepatocytes using the equation below.

11. Urea assay
CAUTION: Blood urea nitrogen (BUN) acid reagent contains sulfuric acid. The sulfuric acid concentration in the BUN acid reagent is considered corrosive. Do not ingest. Work in an area with good ventilation and wear appropriate PPE.
- Urea synthesis is measured using a modified diacetyl monoxime method (see Table of Materials).
- Dilute 53.3 µL of 75 mg/dL urea into 346.7 µL of complete culture medium to make Standard #1 (100 µg/mL)
- Label tubes 2-8 and use a 1:2 serial dilution to make the urea assay standards (Table 1).
- Add 10 µL of sample or standard to wells of a black-walled, clear bottom 96-well plate (see Table of Materials).
- Add 150 µL of BUN reagent to each well containing sample. Prepare BUN reagent by mixing 1/3 of BUN color reagent with 2/3 BUN acid reagent. Use the equation below to assist in calculations.

BUN color reagent (mL) = Total BUN Reagent Needed × 0.333
BUN acid reagent (mL) = Total BUN Reagent Needed × 0.667 - Incubate plate for 90 min in an oven or incubator at 60 °C.
- Read the plate absorbance immediately at 540 nm and 650 nm.
- Create a standard curve by subtracting blank and background absorbance (650 nm) from all samples and standards. Generate a best-fit line by linear regression analysis.
- Determine unknown sample concentration from the standard curve.
- Normalize the sample concentrations to attached hepatocytes using the equation below.

The overall method of plating, culturing, and basic functionality testing of the hepatic culture system involves common primary cell culture techniques and analysis, as illustrated in Figure 1. Hepatocyte attachment and percent plateability were calculated on day 14 using ImageJ analysis of at least five images of Cytokeratin 18 and DAPI staining per well (Figure 2). Representative images of PHHs cultured with feeder cells are shown in Figure 3. The various hepatic seeding densities showed visual differences of confluence based on seeding density and maintained typical hepatic, cuboidal morphology for 14 days of culture. Images of hepatocyte donor lots A and B were captured for each tested seeding density (Figure 4A). The average percent plateability for donor B (89.04% ± 3.99%, 198,552 ± 49,885 PHHs) was higher than donor A (66.08% ± 6.67%, 146,128 ± 33,063 PHHs) across all seeding densities used (Figure 4B). Donor A had significantly higher percent plateability using 150,000 PHHs/well (76.07% ± 12.87%) compared to 250,000-300,000 PHHs/well (62.75% ± 9.64%). Donor B showed no significant differences in hepatocyte percent plateability. Donor B had the lowest hepatocyte plateability (85.78% ± 13.25%) at the highest seeding density, 300,000 PHHs/well. Similar to donor A, seeding donor B at 150,000 PHHs/well had the highest percent plateability of hepatocytes (94.75% ± 15.07%).
Albumin production and urea synthesis were measured at three time points during the 14-day culture period and normalized to calculated attached hepatocytes. Overall, donor A had increased albumin production compared to donor B (41.32 ± 4.58 µg alb/day/106 PHHs vs. 34.66 ± 10.03 µg alb/day/106 PHHs) (Figure 5). Donors A and B had the highest albumin production seeding hepatocytes at 150,000 PHHs/well, 45.91 ± 5.96 µg alb/day/106 PHHs and 48.67 ± 20.44 µg alb/day/106 PHHs, respectively. No significant differences in albumin production were seen in the seeding densities used. As stated by Baudy et al.3, it is desirable that liver microphysiological systems maintain consistent albumin production and urea synthesis with less than 50% change over 14 days of culture. The coefficient of variation (CV) was calculated by dividing the mean by the standard deviation for days 7, 10, and 14. All samples were run in duplicates. The CV for albumin output over the 14-day culture period at 150,000 PHHs/well was 12.24% for donor A and 37.97% for donor B, less than the 50% criterion desired. A high variance in albumin production was seen in both donor A and donor B when seeded at 250,000 and 300,000 PHHs/well. At these seeding densities, both donors experience a steep decrease in albumin production between days 7, 10, and 14 of culture (CV donor A, 22.49%, and donor B, 45.07%).
Donor B urea synthesis (95.09 ± 18.91 µg urea/day/106) was increased compared to donor A (64.92 ± 4.66 µg urea/day/106 PHHs) when averaging days 7, 10, and 14 PHH lot specific data (Figure 6). Donor B (113.49 ± 37.34 µg urea/day/106 PHHs) and donor A (69.12 ± 17.06 µg urea/day/106 PHHs) had the greatest urea synthesis over a 14-day culture period seeding at a density of 150,000 PHHs/well and 200,000 PHHs/well, respectively. Both donor lots had the lowest urea output and highest CV at 300,000 PHHs/well. No significant differences in urea synthesis were seen in the seeding densities used. The lowest CV for urea synthesis for donor A was seen when cultured at 250,000 PPHs/well (23.11%) and 200,000 PHHs/well for donor B (28.26%). As highlighted by these results, optimal seeding density for a given lot of PHH depends on the level of confluency desired at the time of the assay and the nature of the outcomes that are being measured; higher seeding density may not always correlate with higher signal or dynamic range.
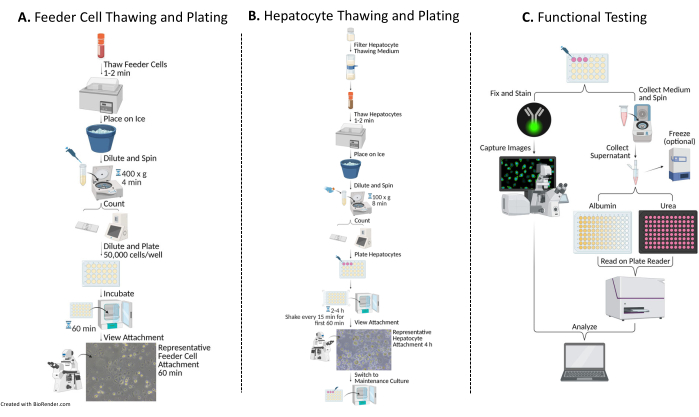
Figure 1: Flow chart of plating, culturing, and functional testing of hepatocytes with feeder cells. (A) Feeder cells are thawed in a specific thawing medium (see Table of Materials), resuspended in a complete plating medium (see Table of Materials), and the cells are counted. The cells are diluted, plated, and incubated for 60 min at 37 °C/5% CO2. (B) Hepatocytes are thawed in a specific thawing medium (see Table of Materials), resuspended in a complete plating medium, and the cells are counted. The hepatocytes are diluted and plated with feeder cells. The cells are incubated for 2-4 h at 37 °C/5% CO2, shaking in a N-S-E-W motion every 15 min for the first 60 min of culture. The plating medium is replaced with a pre-warmed complete culture medium for maintenance of culture (see Table of Materials). The cultures are fed daily. (C) On days 7, 10, and 14, medium samples are collected for albumin and urea testing. Following collection of samples on day 14, the cells are fixed and stained with Cytokeratin 18 (see Table of Materials) antibody 16-24 h at 4 °C. Further, they are incubated in an appropriate secondary antibody, washed, and mounted with DAPI (see Table of Materials) for capturing and image analysis. Please click here to view a larger version of this figure.
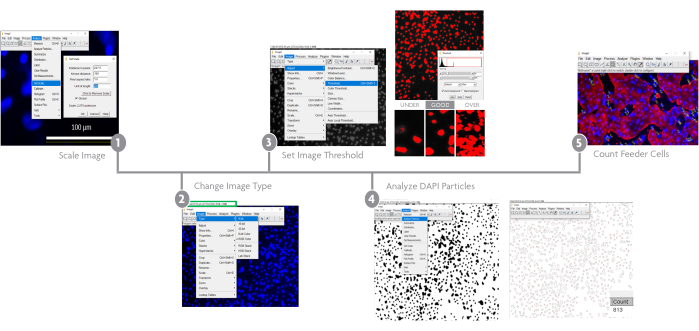
Figure 2: Image analysis using ImageJ software. ImageJ processing of captured images. Step 1: a scale is applied to all images based on the microscope-specific scale bar. Step 2: the image type is changed. Step 3: a threshold limit is applied to select DAPI particles. Step 4: a particle analysis is performed, and the count is recorded. Step 5: to determine the number of attached feeder cells, a merged image is counted using the multi-point tool. Please click here to view a larger version of this figure.
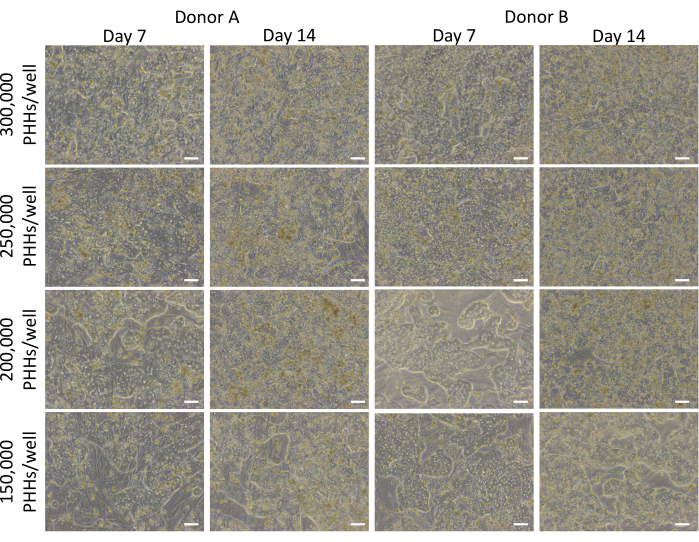
Figure 3: Morphology of various hepatic seeding densities cultured with feeder cells. Representative images on days 7 and 14 of PHHs cultured with feeder cells (50,000 cells/well) at hepatic seeding densities of 150,000, 200,000, 250,000, and 300,000 PHHs/wells. Images were taken using a 10x objective lens on an inverted phase contrast microscope. Scale bar = 100 µm. Please click here to view a larger version of this figure.
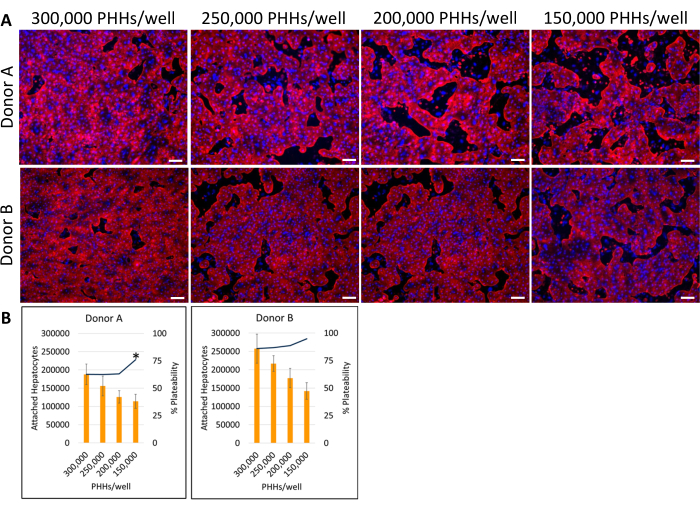
Figure 4: Fluorescent Immunocytochemistry of various hepatic seeding densities cultured with feeder cells. (A) Representative images of Cytokeratin 18 (red) staining on day 14 at hepatic seeding densities of 150,000, 200,000, 250,000, and 300,000 PHHs/wells. Two-wells for each seeding density were fixed for 30 min at 4 °C. Wells were incubated 16-24 h at 4° C with primary antibody at 1:1000. A secondary antibody was used at 1:500 for 30 min at 4 °C in dark. DAPI (blue) nuclear stain was added to wells for 15 min at room temperature. Images were taken using a 10X objective lens on an inverted fluorescent microscope. Scale bar = 100 µm. (B) Calculated attached hepatocytes and percent plateability of various hepatic seeding densities calculated using ImageJ. *p ≤ 0.05, to percent plateability for 200,000, 250,000, and 300,000 PHHs/well. Error bars represent standard deviation (n ≥ 5 images per condition). Please click here to view a larger version of this figure.
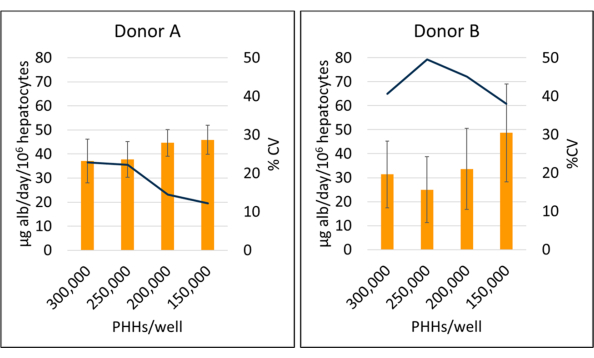
Figure 5: Albumin production of hepatocytes cultured with feeder cells. Albumin production from hepatic seeding densities at 150,000, 200,000, 250,000, and 300,000 PHHs/well. Columns represent the 14-day average of micrograms of albumin/day normalized to total attached hepatocytes. A line represents CV between days 7, 10, and 14. Error bars represent standard deviation (n ≥ 2 wells per condition with replicates). Please click here to view a larger version of this figure.
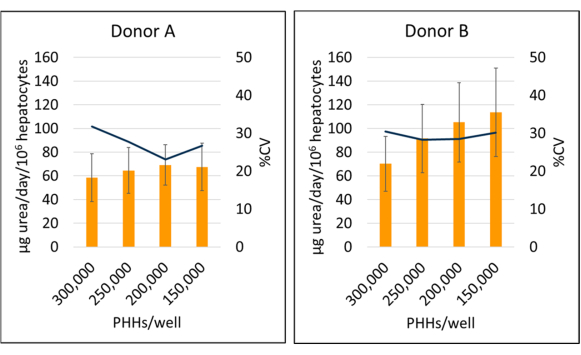
Figure 6: Urea synthesis of hepatocytes cultured with feeder cells. Urea synthesis from hepatic seeding densities at 150,000, 200,000, 250,000, and 300,000 PHHs/well. Columns represent 14-day average of µg urea/day normalized to total attached hepatocytes. A line represents %CV between days 7, 10 and 14. Error bars represent standard deviation (n ≥ 2 wells per condition with replicates). Please click here to view a larger version of this figure.
| Standard (S) # | Concentration (µg/mL) | Urea Solution (µL) | Complete Culture (µL) |
| 1 | 100 | 53.3 75 mg/dL stock |
346.7 |
| 2 | 50 | 100 (S1 solution) |
100 |
| 3 | 25 | 100 (S2 solution) |
100 |
| 4 | 12.5 | 100 (S3 solution) |
100 |
| 5 | 6.26 | 100 (S4 solution) |
100 |
| 6 | 3.125 | 100 (S5 Solution) |
100 |
| 7 | 1.5625 | 100 (S6 Solution) |
100 |
| Blank | 0 | 0 | 100 |
Table 1: Urea standard sample preparation. Using 75 mg/dL stock urea, prepare a 100 µg/mL urea solution. Aliquot the suggested volumes to reach the final concentration for the standard curve.