전사체는 샘플에 있는 모든 유전자의 발현으로 구성되며 마이크로어레이 및 RNA-seq1과 같은 고처리량 기술로 프로파일링할 수 있습니다. 데이터 세트에서 한 유전자의 발현 수준을 전사체 특징이라고 하며, 표현형과 대조군 간의 전사체 특징의 차등 표현은 이 유전자를 이 표현형 2,3의 바이오마커로 정의합니다. 전사체 바이오마커는 질병 진단4, 생물학적 메커니즘5, 생존 분석6,7 등의 연구에 광범위하게 활용되어 왔다.
건강한 조직의 유전자 활동 패턴은 생명에 대한 중요한 정보를 담고 있다 8,9. 이러한 패턴은 귀중한 통찰력을 제공하며, 양성 질환(benign disorders)10,11 및 치명적 질환(lethal diseases)12의 복잡한 발달 궤적을 이해하기 위한 이상적인 참고 자료 역할을 한다. 유전자는 서로 상호 작용하며, 전사체는 복잡한 상호 작용 후 최종 발현 수준을 나타냅니다. 이러한 패턴은 전사 조절 네트워크(transcriptional regulation network)13 및 대사 네트워크(metabolism network)14 등으로 공식화된다. 메신저 RNA(mRNA)의 발현은 전사 인자(TF) 및 긴 유전자 간 비코딩 RNA(lincRNA)에 의해 전사적으로 조절될 수 있습니다15,16,17. 종래의 차등 발현 분석은 특징간 독립성(inter-feature independence)을 가정한 이러한 복잡한 유전자 상호작용을 무시하였다18,19.
그래프 신경망(GNN)의 최근 발전은 암 연구(20)를 위한 OMIC 기반 데이터로부터 중요한 정보를 추출하는 데 있어 비범한 잠재력을 보여주는데, 예를 들어, 공발현 모듈(21)을 식별한다. GNN의 타고난 능력은 유전자22,23 사이의 복잡한 관계와 의존성을 모델링하는 데 이상적입니다.
생물의학 연구는 종종 대조군에 대한 표현형을 정확하게 예측하는 데 중점을 둡니다. 이러한 작업은 일반적으로 이진 분류(binary classifications)24,25,26으로 공식화된다. 여기서 두 클래스 레이블은 일반적으로 1과 0, true 및 false 또는 양수 및 음수27로 인코딩됩니다.
이 연구는 사전 훈련된 GAT(Graph-Attention Network) 참조 모델을 기반으로 전사체 데이터 세트의 전사 조절(mqTrans) 보기를 생성하기 위한 사용하기 쉬운 프로토콜을 제공하는 것을 목표로 했습니다. 이전에 공개된 작업(26 )으로부터의 멀티태스킹 GAT 프레임워크를 사용하여 전사체 특징을 mqTrans 특징들로 변환하였다. UCSC(University of California, Santa Cruz) Xena 플랫폼28 의 건강한 전사체에 대한 대규모 데이터 세트를 사용하여 조절 인자(TF 및 lincRNA)에서 표적 mRNA까지의 전사 조절을 정량적으로 측정한 참조 모델(HealthModel)을 사전 훈련했습니다. 생성된 mqTrans 뷰는 예측 모델을 구축하고 다크 바이오마커를 감지하는 데 사용할 수 있습니다. 이 프로토콜은 TCGA(The Cancer Genome Atlas) 데이터베이스(29 )의 결장 선암종(COAD) 환자 데이터 세트를 예시로 사용합니다. 이러한 맥락에서 I기 또는 II기의 환자는 음성 샘플로 분류되고 III 또는 IV기의 환자는 양성 샘플로 간주됩니다. 26개의 TCGA 암 유형에 대한 어두운 바이오마커와 전통적인 바이오마커의 분포도 비교됩니다.
HealthModel 파이프라인에 대한 설명
이 프로토콜에 사용된 방법론은 그림 1에 요약된 바와 같이 이전에 발표된 프레임워크26을 기반으로 합니다. 시작하려면 사용자가 입력 데이터 세트를 준비하고, 제안된 HealthModel 파이프라인에 공급하고, mqTrans 기능을 가져와야 합니다. 자세한 데이터 준비 지침은 프로토콜 섹션의 섹션 2에 나와 있습니다. 그 후, 사용자는 mqTrans 기능을 원래 전사체 기능과 결합하거나 생성된 mqTrans 기능만 진행할 수 있습니다. 생성된 데이터 세트는 기능 선택 프로세스를 거치며, 사용자는 분류를 위한 k-폴드 교차 검증에서 k에 대해 선호하는 값을 유연하게 선택할 수 있습니다. 이 프로토콜에서 사용되는 기본 평가 메트릭은 정확도입니다.
HealthModel26은 전사체 특징을 TF(전사 인자), lincRNA(긴 유전자 간 비코딩 RNA) 및 mRNA(메신저 RNA)의 세 가지 그룹으로 분류합니다. TF 특징은 Human Protein Atlas30,31에서 사용할 수 있는 주석을 기반으로 정의됩니다. 이 작업은 GTEx 데이터 세트32의 lincRNA 주석을 활용합니다. KEGG 데이터베이스(33)에서 3단계 경로에 속하는 유전자는 mRNA 특징으로서 고려된다. mRNA 특징이 TRRUST 데이터베이스(34)에 문서화된 바와 같이 표적 유전자에 대한 조절 역할을 나타내면, TF 클래스로 재분류된다는 점에 주목할 필요가 있다.
이 프로토콜은 또한 조절 인자(regulatory_geneIDs.csv)와 표적 mRNA(target_geneIDs.csv)의 유전자 ID에 대한 두 개의 예제 파일을 수동으로 생성합니다. 조절 특징(TF 및 lincRNA) 간의 쌍별 거리 매트릭스는 Pearson 상관 계수에 의해 계산되고 널리 사용되는 도구인 WGCNA(Weighted Gene Co-Expression Network Analysis)36 (adjacent_matrix.csv)에 의해 클러스터링됩니다. 사용자는 이러한 예제 구성 파일과 함께 HealthModel 파이프라인을 직접 활용하여 전사체 데이터 세트의 mqTrans 보기를 생성할 수 있습니다.
HealthModel의 기술적 세부 사항
HealthModel은 TF와 lincRNA 간의 복잡한 관계를 그래프로 나타내며, 입력 특징은 V로 표시된 꼭짓점과 E로 지정된 꼭짓점 간 가장자리 행렬 역할을 합니다. 각 샘플은 VK×1로 기호화된 K 조절 특징이 특징입니다. 특히, 데이터 세트에는 425개의 TF와 375개의 lincRNA가 포함되어 있어 K = 425 + 375 = 800의 샘플 차원을 얻을 수 있었습니다. 에지 매트릭스 E를 확립하기 위해 이 작업에서는 널리 사용되는 도구인 WGCNA35를 사용했습니다. 및  로 표시된
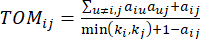
로 표시된  두 꼭짓점을 연결하는 쌍별 가중치는 Pearson 상관 계수에 의해 결정됩니다. 유전자 조절 네트워크(gene regulatory network)는 중추적인 기능적 역할을 하는 허브 유전자(hub gene)의 존재를 특징으로 하는 비늘 없는 토폴로지(scale-free topology)(36)를 나타낸다. 두 피처 또는 꼭짓점 간의 상관 관계를 계산하고, 다음과 같이 TOM(Topological Overlap Measure)을 사용합니다.
 (1)
(1)
 (2)
(2)
소프트 임계값 β는 WGCNA 패키지의 ‘pickSoft Threshold’ 함수를 사용하여 계산됩니다. 거듭제곱 지수 함수 a ij가 적용되며, 여기서  는 i와 j를 제외한 유전자를 나타내고
  꼭짓점 연결을 나타냅니다. WGCNA는 일반적으로 사용되는 비유사성 측정(dissimilarity measure)을 사용하여 전사체 특징의 발현 프로파일을 여러 모듈로 클러스터링합니다(
 37.
37.
HealthModel 프레임워크는 원래 멀티태스킹 학습 아키텍처(multitask learning architecture)로 설계되었다(26). 이 프로토콜은 트랜스크립토믹 mqTrans 보기의 구성을 위해 모델 사전 학습 작업만 사용합니다. 사용자는 추가 작업별 전사체 샘플을 사용하여 멀티태스킹 그래프 주의 네트워크 하에서 사전 훈련된 HealthModel을 더욱 구체화하도록 선택할 수 있습니다.
기능 선택 및 분류에 대한 기술적 세부 사항
기능 선택 풀은 11개의 FS(기능 선택) 알고리즘을 구현합니다. 그 중 SK_mic(Maximal Information Coefficient)를 사용하여 K 최상의 특징을 선택하고, MIC의 FPR을 기반으로 K 특징을 선택하고(SK_fpr), MIC의 오탐지율이 가장 높은 K 특징을 선택(SK_fdr)하는 세 가지 필터 기반 FS 알고리즘입니다. 또한 세 가지 트리 기반 FS 알고리즘은 지니 지수(DT_gini), 적응형 부스트 의사 결정 트리(AdaBoost) 및 랜덤 포레스트(RF_fs)가 있는 의사 결정 트리를 사용하여 개별 기능을 평가합니다. 또한 풀은 선형 서포트 벡터 분류자(RFE_SVC)를 사용한 재귀적 기능 제거와 로지스틱 회귀 분류자(RFE_LR)를 사용한 재귀적 기능 제거라는 두 가지 래퍼 방법을 통합합니다. 마지막으로, 최상위 L1 기능 중요도 값(lSVC_L1)이 있는 선형 SVC 분류자와 최상위 L1 기능 중요도 값(LR_L1)이 있는 로지스틱 회귀 분류자의 두 가지 임베딩 알고리즘이 포함됩니다.
분류자 풀은 7개의 서로 다른 분류자를 사용하여 분류 모델을 빌드합니다. 이러한 분류기는 선형 서포트 벡터 머신(SVC), 가우스 나이브 베이즈(GNB), 로지스틱 회귀 분류기(LR), k-최근접이웃(k가 기본적으로 5로 설정됨(KNN), XGBoost, 랜덤 포레스트(RF) 및 의사 결정 트리(DT)로 구성됩니다.
데이터셋을 train: test 서브셋으로 임의로 분할하는 것은 명령줄에서 설정할 수 있습니다. 시연된 예제에서는 train: test = 8:2의 비율을 사용합니다.
