Acquisition and Analysis of an ECG (electrocardiography) Signal

Source: Peiman Shahbeigi-Roodposhti and Sina Shahbazmohamadi, Biomedical Engineering Department, University of Connecticut, Storrs, Connecticut
An ele…
1. Acquiring an ECG Signal
- Adjust the voltage of the sources to +5 V and -5 V and connect them in series.
- Build the circuit shown in Figure 4. Calculate the values of the resistors and capacitors. For the high pass filter, the cut-off frequency should be 0.5 Hz. The capacitor value should be chosen from the table below (according to availability).
| Available Capacitor Values (µF ) | ||
| 0.001 | 1 | 100 |
| 0.022 | 2.2 | 220 |
| 0.047 | 4.7 | 470 |
| 0.01 | 10 | 1000 |
| 0.1 | 47 | 2200 |

- Place electrodes on the right arm, left arm and right leg (this is reference) of the patient, and connect them to the circuit.
- Use the oscilloscope to view the ECG signal (Vo). Press Auto Set and adjust the horizontal and vertical scales as needed. You should be able to see the R peaks despite of the noise in the signal.
2. Displaying the ECG signal using Instrumention Software
- In this demonstration we used LabVIEW. Write a program that displays the ECG signal using a graphical interface for configuring measurements and a waveform graph. Once an analog input has been selected, configure the program with the following settings:
- Signal input range >> Max = 0.5; Min = -0.5
- Terminal Configuration >> RSE
- Acquisition mode >> continuous
- Samples to read = 2000
- Sampling rate = 1000
- Acquire the ECG signal and observe the waveform. You will see a signal similar to Figure 1.
- Adjust the scale of the x-axis to show time in seconds.
- It is often necessary in instrumentation to amplify the signal of interest to a specific amplitude. Create a gain control and set it so that the amplitude of the ECG is 2 Vp.
3. Analyzing the ECG signal
In this section, an ECG signal will be filtered and analyzed to determine the heart rate. The following block diagram shows the components of the program.
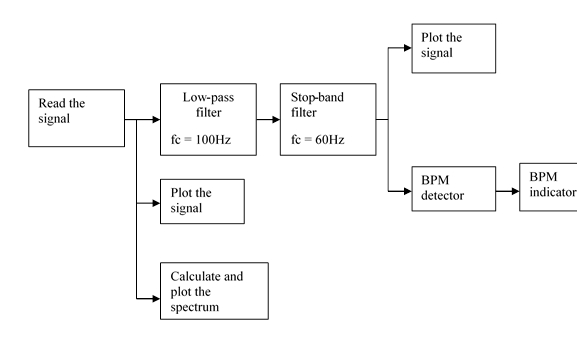
- Use a waveform graph to display the signal.
- Evaluate the spectrum of the signal using the Amplitude and phase spectrum subvi (in Signal processing → Spectral) and display its magnitude using a waveform graph. The horizontal axis corresponds to frequency. It is discrete because the computer uses a Fast Fourier Transform (FFT) algorithm to calculate the spectrum of the signal. The frequency goes from k = 0 to k = (N-1)/2, where N is the length of the sequence, in this case 4000. To calculate the corresponding analog frequency, use the following formula:
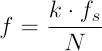
where fs is the sampling frequency. Note that most of the energy of the signal is in the low frequency range and also that there is a peak of high intensity in the medium frequency range. Calculate the frequency of that peak using the formula provided above. - Implement a low-pass filter using Butterworth of Chebyshev functions. Choose a cut-off frequency equal to 100 Hz. Make sure that the filter provides an attenuation of at least -60 dB/decade in the stopband.
- Connect the output signal of the read from spreadsheet subvi to the input of the low-pass filter.
- Implement a stop-band filter using Butterworth or Chebyshev functions. The objective is to reduce the 60 Hz interference without modifying the other frequencies. Try border frequencies close to 60 Hz.
- Connect the output of the lowpass filter to the input of the stopband filter.
- Find the peaks using the peak detector subvi (it is located in Signal processing → Sig Operation). For the threshold, look at the signal's amplitude and choose the most appropriate value.
- Extract the locations of the peaks using the index array subvi (in Programming → Array).
- Subtract the lower position from higher position, then, multiply by the sampling period T = 1/fs to obtain the RR interval.
- Calculate the reciprocal and adjust units and place an indicator to display the BPM.
Electrocardiographs record cardiac activity of the heart and are used to diagnose disease, detect abnormalities, and learn about overall heart function. Electrical signals are produced by contractions in the heart walls which drive electrical currents and create different potentials throughout the body. By placing electrodes on the skin, one can detect and record this electrical activity in an ECG. ECGs are non-invasive, making them a useful tool to assess how well a patients heart is performing, such as by measuring how well blood flows to the organ.
This video will illustrate the principals of ECGs and demonstrate how to acquire, process, and analyze a typical ECG signal using a biopotential amplifier. Other biomedical applications that utilize electrical signal processing to diagnose disease will also be discussed.
To understand the principles of an ECG, let's first understand how the heart produces electrical signals. For a normal, healthy heart, at rest, an ECG displays a series of waves that reflect the different phases of a heartbeat. The ECG starts in the sinoatrial node, also known as the SA node, which is located in the right atrium and acts as a pacemaker in the heart. The electrical signals cause atrial contraction forcing blood into the ventricles. This sequence is recorded as the P wave on the ECG. This signal then passes from the atria across the ventricles, causing them to contract and pump blood to the rest of the body. This is recorded as the QRS complex.
Finally, the ventricles relax and this is recorded as the T wave. The process then begins again and is repeated for every heartbeat. Notice that the QRS wave is much larger than the P wave, this is because the ventricles are larger than the atria. Meaning they mask the relaxation of the atria or the T wave. Other processes in the body, like respiration or muscle contractions, can interfere with the ECG measurement. As can currents from the circuitry used to obtain them. Often, the electrical signals that the ECG is attempting to record are quite weak. Therefor, a biopotential amplifier is used to increase their amplitude which allows them to be further processed and recorded.
There are three main components to the biopotential amplifier, the patient protection stage, the instrumentation amplifier, and the high pass filter. As the main suggests, the patient protection circuit uses a combination of resistors and diodes to protect, both, the patient and the machine and equipment. The resistors limit the current that flows through the patient, where as the diodes keep the current flowing in the correct direction.
The next stage is the instrumentation amplifier, which amplifies the difference between the inputs from each electrode. It is composed of three operational amplifiers. Two to increase the resistance from each input, and the third to amplify the difference between the input signals.
The last stage is the high pass filter, which reduces the noise and filters out low frequency signals arising from patient movement or respiration. Now that you know how an ECG is measured, let's see how to construct a biopotential amplifier and process the data to get a clean ECG signal.
Having reviewed the main principals of electrocardiography, let's see how to build a biopotential amplifier and acquire an ECG signal. To begin, first gather a proto-board, an AD-620 instrumentation amplifier, and all necessary circuit components. Then, calculate the values of all of the resistors and capacitors in the circuit using the following equation.
For the high pass filter, the cut off frequency should be 0.5 hertz.
Then, plug in the capacitor value to determine the resistance. Next, build a biopotential amplifier according to the provided diagram. Here is what the final circuit should look like. Attach three wires with alligator clips to the binding posts of a DC power supply, then turn on the power source. Adjust the voltage to plus five volts and minus five volts, and connect the the wires, in series, to the circuit.
Now, use an alcohol prep pad to wipe the patients right wrist, left wrist, and right ankle. Add conductive adhesive gel to the electrodes before placing them on the patient. Then, connect the electrodes to the circuit using wires with alligator clips. Turn on the oscilloscope and acquire the ECG signal. Adjust the horizontal and vertical scales as needed. With these adjustments, you should be able to see the R peak of the wave form.
Connect the circuit to the PXI chassis, then open the instrumentation software and, either, use or write a program that will display the ECG signal and a wave form graph.
Configure the data acquisition interface with the following settings. Label the scale of the x-axis to display time and seconds, then display the ECG signal as a waveform. If the signal needs to be amplified, create a gain control and set it so that the amplitude of the ECG is two VP.
Now that we have demonstrated how to acquire an ECG signal, let's see how to analyze the results. Here is a representative ECG signal. The P, QRS, and T waves are barely discernible because they are obscured by noise and fluctuations. This signal needs to be filtered. To transform this signal, first, select Signal Processing then Spectral on the menu. A Fast Fourier Transform algorithm calculates and plots the spectrum of the signal displaying the frequency as discreet values on the horizontal axis. Most of the energy in the signal is at low frequencies.
But, there is a high intensity peak in the medium frequency range, which is assumed to be noise. Frequency is plotted as k on the horizontal axis and goes from zero to N minus one over two, where N is the length of the sequence. For this experiment, N equals 2,000. Calculate the analog frequency for each k value using the following equation, where f s is the sampling frequency and determine the frequency of the high intensity peak based on the FFT graph.
Then, create a low pass filter with a cutoff frequency of 100 hertz. Use, either, the Butterworth or Chebyshev function to filter the signal, which should attenuate at least 60 decibels per decade in the stop band. Connect the output signal of the data sub VI to the input of the low pass filter. This filter removes the extraneous high frequency waves of the ECG. Now, create a Bandstop filter and set the cutoff frequencies at around 55 and 70 hertz.
To remove the noisy signal, around 60 hertz. Then, connect the output of the low pass filter to the input of the Bandstop filter. Try border frequencies that are close to 60 hertz. This will reduce interference without effecting other frequencies. The ECG signal should now be clear with distinct P, QRS, and T complexes.
Now, let's determine the heart rate using the filtered ECG signal. First, use the peak detector sub VI to find the peaks of the signal. Choose the most appropriate value based on the signals amplitude of the R wave for the threshold. Then, use the Index Array sub VI to determine the location of the peaks.
Subtract the lower peak position from the higher position, then multiply this value by the sampling period, T, which is equal to one over f s. This value is the length of time between two R waves. Adjust the units to determine the beats per minute.
In this demonstration, the measured heart rate was approximately 60 beats per minute.
ECG and signal processing have important applications in, both, medicine and research. In addition to being non-invasive, ECGs are relatively inexpensive. Making it a useful and accessible tool in hospitals. ECGs can even be adapted to more complex and longterm monitoring of patients who are being treated for Acute Coronary Syndrome.
For this, 12 ECG leads are used, which can identify transient myocardial ischemia in asymptomatic patients. Signal sampling and processing is also used in electroencephalography to measure electrical signals from the brain. EEGs are commonly used in conjunction with functional MRI as a multimodal imaging technique.
The method noninvasively generates cortical maps of brain activity for many neuroimaging applications, such as after visual or motor activation.
You've just watched Jove's introduction to acquiring and analyzing ECG signals. You should now understand how an ECG signal is produced and how to create a biopotential amplifier to detect weak electrical signals. You have also seen some biomedical applications of signal processing for medical diagnosis.
Thanks for watching.
Q1: How does the heart produce electrical signals that an ECG records?
The sinoatrial node in the right atrium acts as the heart's pacemaker, initiating electrical signals that cause atrial contraction, recorded as the P wave. These signals then pass across the ventricles, causing them to contract and pump blood, recorded as the QRS complex. Finally, ventricular relaxation is recorded as the T wave. This cycle repeats with each heartbeat.
Q2: What are the three main components of a biopotential amplifier?
A biopotential amplifier contains three stages: the patient protection stage using resistors and diodes to limit current and ensure safe direction of flow; the instrumentation amplifier with three operational amplifiers to amplify the difference between electrode inputs; and the high pass filter to reduce noise from patient movement or respiration by filtering out low frequency signals.
Q3: Why is the QRS complex larger than the P wave on an ECG?
The QRS complex is much larger than the P wave because the ventricles have significantly greater muscle mass than the atria. The larger ventricles generate stronger electrical signals during contraction. This size difference also causes the ventricles' electrical activity to mask the relaxation of the atria on the ECG recording.
Q4: How do you calculate heart rate from a filtered ECG signal?
Use a peak detector to identify the R wave peaks in the filtered ECG signal. Determine the positions of two consecutive R peaks using an index array function. Subtract the lower peak position from the higher position and multiply by the sampling period to find the time between heartbeats. Convert this interval to beats per minute by dividing 60 seconds by the interval duration.
Q5: What filtering techniques remove noise from a raw ECG signal?
A low pass filter with a cutoff frequency of 100 hertz removes high frequency noise using Butterworth or Chebyshev functions. A bandstop filter with cutoff frequencies around 55 and 70 hertz eliminates 60 hertz interference from electrical equipment. Together, these filters attenuate at least 60 decibels per decade in the stop band, revealing distinct P, QRS, and T wave complexes.
Q6: What does a Fast Fourier Transform reveal about an ECG signal?
A Fast Fourier Transform algorithm calculates and plots the frequency spectrum of an ECG signal, displaying frequency as discrete values on the horizontal axis. This analysis reveals that most signal energy is at low frequencies, while high intensity peaks in the medium frequency range typically represent noise. This information guides filter design to remove unwanted frequencies while preserving cardiac signal components.
Q7: What are the clinical advantages of using ECG for cardiac assessment?
ECGs are non-invasive, relatively inexpensive, and accessible tools for assessing heart function and blood flow to the organ. They can diagnose disease, detect abnormalities, and monitor patients with conditions like Acute Coronary Syndrome using 12 leads to identify transient myocardial ischemia in asymptomatic patients. Signal processing methods used in ECGs also extend to other biomedical applications like combined SPECT and CT imaging to visualize cardiac functionality.