1. Loading cells with calcium indicators
- Plate cells in 35mm glass bottom MatTek dishes (or any other glass bottom viewing chambers).
- If using primary myocytes coat the chambers 1 day before with 10μg/ml laminin. Plate cardiac myocytes (isolated from adult dogs, neonatal rats, or other organism) in KB buffer (K-reversal Tyrode buffer 35 mmol/L of HEPES, 140 mmol/L of KCl, 8 mmol/L of KHCO3, 2 mmol/L of MgCl2, and 0.4 mmol/L of KH2PO4, pH 7.5) and change it gradually to M199 medium supplemented with 15% fetal bovine serum and 1% streptamycin and 0.5% gentamicin and incubate at 37 °C in 5% CO2.
- Incubate cells with calcium green AM (1-5 μM; Molecular Probes) or any desired calcium indicator for 30-45 min at room temperature. Cover the dish with aluminum foil to avoid photobleaching of the dye.
- Wash the cells three times with Leibovitz15 medium with 14mM EGTA (if performing experiments in low calcium) or any appropriate viewing media.
- Incubate for another 30-45 minutes in Leibovitz15 medium containing14mM EGTA.
- If testing effects of inhibitors (i.e. 10μM U73122 PLC inhibitor) add them during the second incubation.
2. Microinjecting cells
- Culture cardiomyocytes in glass bottom MatTek dishes (or other viewing chambers) for 24h.
- Change the medium to phenol-free Leibovitz-15 with 14 mM EGTA (cardiomyocytes have to be injected in calcium free medium, other cells can be injected in medium containing calcium).
- Prepare microinjection solution – our studies used a peptide that eliminates Gαq – caveolae interactions. Keep in mind that only a small amount of volume is injected into the cell (˜fL) and so reasonably concentrated stocks must be used. We used 2 μM of this peptide, Cav3-scaffold, with DAPI in calcium-free medium. DAPI is a blue dye that stains the nucleus and allows the identification of cells that have been microinjected. DAPI does not interfere with the fluorescence of many calcium indicators. The amount of DAPI is variable and we generally use enough to visualize the nucleus (0.5 and 2 μM)
- Prepare control solution containing DAPI – the dye tracer alone.
- For microinjections use self-pulled or commercially available needles. Practice with dye injection to determine proper needle parameters. We note that different cells might require different needle diameters and microinjection pressures.
- Use automated microinjection system, for example an InjectMan NI2 with a FemtoJet pump from Eppendorf. Set the injection pressure Pi to 90 hPa, and the compensation pressure Pc to 45 hPa. Set the injection time t to 0.7 s. Readjust parameters of injection as need.
- Perform microinjections on an inverted microscope (e.g. Zeiss Axiovert 200M) equipped with long working distance phase contrast objective (for example air 40x phase 2 objective).
- Inject as many cells as possible in a rapid fashion. Examine injected cells using the phase contrast to select viable cells.
3. Co-immunofluorescence studies
- Wash cells twice with PBS and fix with 3.7% paraformaldehyde for 30 minutes. If required, cells can be stimulated before fixation.
- Wash fixed cells three times with PBS, and incubate with 0.2% NP40 in PBS for 5minutes.
- Block using PBS containing 4% goat serum (or other appropriate serum) for 1hour.
- Incubate cells with primary antibody at appropriate dilution with 1% goat serum in PBS for 1hour.
- Wash cells three times for 10 minutes with 150 mM NaCl, 25 mM Tris, pH 7.6 followed by addition of fluorescent-labeled secondary antibody, such as Alexa-Fluor-488 anti-rabbit or Alexa-Fluor-647 anti-mouse secondary antibody diluted to 1:1000 1% goat serum in PBS (note that when probing for two different proteins the primary antibodies must be raised in different species and the secondary must be against corresponding species).
- Incubate at 37°C for 1hour, wash three times with TBS.
- View cells in TBS buffer or another appropriate viewing medium.
4. Fast calcium imaging
- Use laser scanning confocal microscope (for example Fluoview 1000 Olympus).
- Use high numerical aperture objective.
- Set the acquisition parameters. For calcium green use 488 nm excitation and long pass 515 emission filters.
- Adjust the pixel time – for fast calcium measurements set it to 2 μs/pixel.
- Set the image zoom to achieve pixel size of 0.05 – 0.3 μm.
- Select a line from a cell of choice in a particular region.
- In the time controller window select time acquisition for at least 1500 scans (to get desired time frame of the response – 1.3 ms/line would yield 2 seconds).
- Record background reading prior to the stimulation.
- Stimulate cells with 5 μM carbachol and immediately start recording data. Keep cells in 1 mL of Leibovitz15 medium, prepare 10 μM carbachol in Leibovitz15 and add gently 1 mL into the dish
5. Data analysis
- Extract the intensities for each pixel from recorded image. Save the intensity data as a table using Fluoview 1000 software.
- Import intensity data into Sigmaplot or a similar data analysis program and bin the data into ˜9-40 bins. Compare to control experiments and electronic noise.
6. Representative Results:
We imaged cells on laser scanning confocal microscope LSM510 (Zeiss, Jena, Germany) equipped with multi-line laser excitation and a 40x/1.2 NA apochromat water immersion objective. In Fig. 1 (red) we show the distribution of caveolae in canine adult ventricular cardiomyocytes that have been fixed and stained with an antibody to caveolin-3 which is the major structural caveolar protein in these cells 9. Caveolin-3 was immunolabelled with Alexa-647 and excited with the 633-nm line from a He:Ne laser. Images were recorded using LP650 nm emission filter. The distribution of caveolin-3 was compared to Gαq that was immunolabeled with Alexa-488 (green). Alexa-488 was excited with 488nm Argon-ion laser line and the image was recorded using BP505-530nm emission filter. In these colocalization measurements, the two fluorophores were excited in a sequential manner using Multi Track acquisition. This procedure minimizes channel cross-talk. Data analysis for colocalization was performed using AIM software provided with Zeiss LSM510-Meta. As can be seen, the two proteins are colocalized.
To determine how the coupling between caveolin-3 and Gαq affect calcium signals, we carried out calcium imaging studies on a confocal scanning laser microscope system (Fluoview, Olympus, Tokyo, Japan) coupled to an inverted microscope (IX70, Olympus) with a 40x objective (UPlanApo, Olympus, numerical aperture 1.3) although these measurements could also be performed on the Zeis systems described above. For these measurements, cells were loaded with Ca2+ Green. We excited the dye with a 488nm Argon ion laser and collected images through an LP515 emission filter. Image frames were collected at 500 ms intervals. Intensity values for each pixel were extracted using Olympus software and ImageJ. The line scan mode was used for quantitative analysis of faster Ca2+ transients and Ca2+ sparks. The pixel size used in the present study was 0.1-0.3 μm. The line-scan rate was about several hundred of μs per line. In Fig. 2 we show a line scan of a Ca2+ Green-loaded cardiomyocyte where the pixel dwell time was 2 μs, the line time was 142 μs. The image is composed of 1200 lines.
Each line of the scan corresponds to the intensity fluctuation of Ca2+ Green consisting of 71 points taken over a 142 μs range, and can be used as a rapid read-out for calcium responses. For example, in Fig. 3 we show the Ca2+ activity of a single line of an individual cardiomyocyte, as measured by Ca2+ Green fluorescence intensity as a function of time in seconds before (top) and after (bottom) the addition of 5 μM carbachol which enhances the level of intracellular Ca2+ through Gαq-PLCβ activity. When many lines are averaged, carbachol stimulation produces an ˜1.8 fold increase in Ca2+ Green intensity. Due to variations in experimental conditions (room temperature, laser power, detector response, dye distributions, etc), this increase may not be seen in individual line scans. Even though the intensity values (y axis values) are similar, it is clear that the carbachol-stimulated plot on the bottom has much broader peaks, corresponding to more sustained calcium levels, than the narrow fluctuation peaks seen before stimulation. This broadening and relative rise in intensity obscures small, slower oscillations. Our goal is to better discriminate between these different apparent types of calcium fluctuations.
Another example of these fast calcium fluctuations is shown in Fig. 4. The top graph shows raw line data for stimulated ventricular cardiomyocytes (red) and an average of 3 line traces is shown in black. To determine the extent that these calcium fluctuations were mediated by Gαq – caveoline3 interactions, we microinjected a peptide that destabilizes caveolin-3 – Gαq interactions (i.e. Cav3 peptide) which eliminates the longer Ca2+ current and these data are shown in blue (we note that we subtracted 500 from the Cav3 peptide intensities so that the two traces can be better discerned).
We imported the columns of raw data from our excel files into Sigmaplot (Jandel, Inc.) and carried out a histogram analysis. In this analysis, the number of events is grouped into an equal number of boxes (bins) to produce a histogram. The width of bin represents an equal interval of time. The intensities are inserted into the different time binds so that the height of a particular bin represents the number of times that intensity occurs in the particular time window. Since this type of analysis only depends on collecting data at the same scan rate, many traces can be analyzed simultaneously. Additionally, this analysis is not sensitive to differences in dye levels, laser power, etc., and electronic and background noise occurs at time scales very fast and are only seen in the first 1-2 bins.
The corresponding histograms of the raw data in Fig. 4 are shown on the bottom of the page. The histogram for the control cells are spread over a large number of bins corresponding to a broad time distribution, as depicted by the red line (the line is for guiding the eye and no model is assumed). In contrast, the bins for the response of cells where the Gαq -Cav3 interaction was disrupted by peptide are confined to a narrow bin distribution suggesting that the presence of peptide eliminates longer duration fluxes. Microinjection of a control peptide that does not disrupt Gαq-Cav3 produces a histogram similar to un-injected cells8.
In Fig. 5 we compare the fast intensity fluctuations of Ca2+Green in adult canine ventricular cardiomyocytes (left) and fresh, unstimulated rat neonatal cardiomyocytes that lack caveolae (right). Here, the corresponding histograms of the intensities over a 3 minute period were binned at 35 to view slower calcium events. Note that the neonatal cardiomyocytes display fast fluctuations on a flat baseline showing the lack of slower Ca2+ activity while a more structured baseline is seen for the adult cells. These differences are most easily seen in the histograms.
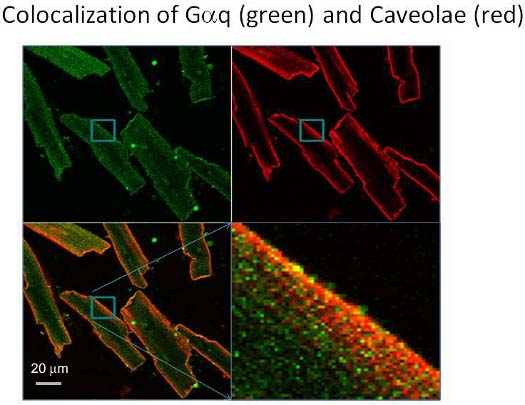
Figure 1. Images of canine adult ventricular cardiomyocytes showing the distribution of Gαq immunolabeled with Alexa-488 where Alexa-488 was excited with 488nm Argon-ion laser line and the image was recorded using BP505-530nm emission filter. The top right is the same image viewing the localization of caveolin-3 immunolabeled with Alexa-647, excited with the 633-nm line from a He:Ne laser and recorded using LP650 nm emission filter. The merged image where colocalization is seen in orange is on the bottom left with an expanded image to the right.
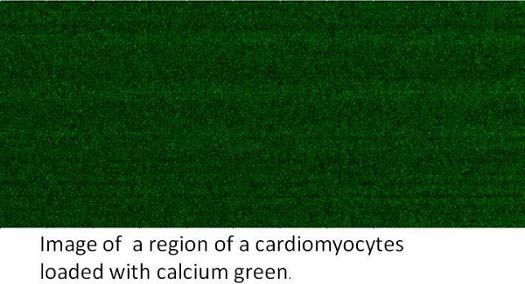
Figure 2. Calcium imaging of a living canine adult ventricular cardiomyocyte loaded with Ca2+ Green. The image was taken on a confocal scanning laser microscope system with a 40x objective using a 488nm Argon ion laser and an LP515 emission filter. The image is composed of 1200 lines, the pixel dwell time was 2 μs, and the pixel size was 0.1 μm.
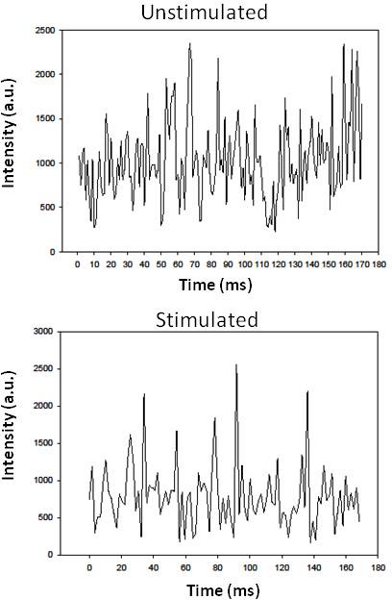
Figure 3. TOP Intensity fluctuations of a line trace from a living canine adult ventricular cardiomyocyte loaded with Ca2+ Green and imaged as described, and BOTTOM the same cell stimulated by the addition of 5 μM carbachol.
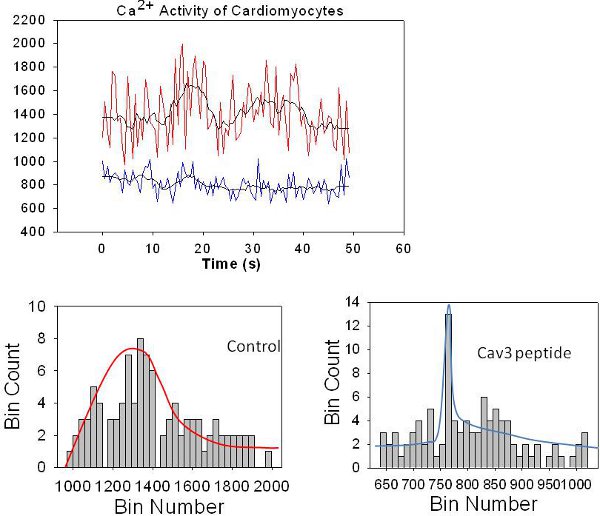
Figure 4. TOP An example of line traces from a living canine adult ventricular cardiomyocyte loaded with Ca2+ Green (red) taken over 180 ms where the average of 3 traces is shown as a black line, and compared to a cell that was microinjected with a peptide that disrupts Gαq-caveolin 3 association (red) where an average of three traces is in black. We note that we subtracted 400 intensity counts from the lower set of data for viewing purposes. The lower panels are the corresponding histograms of the binned data as described in the text, and where the bin number is arbitrary and the bin count (or simply count) corresponds to the total amount of intensity in that particular bin. We note that the line red and blue lines drawn in the control (left) and peptide (right) histograms are to allow for easier identification and comparisons of the data and no model is assumed.
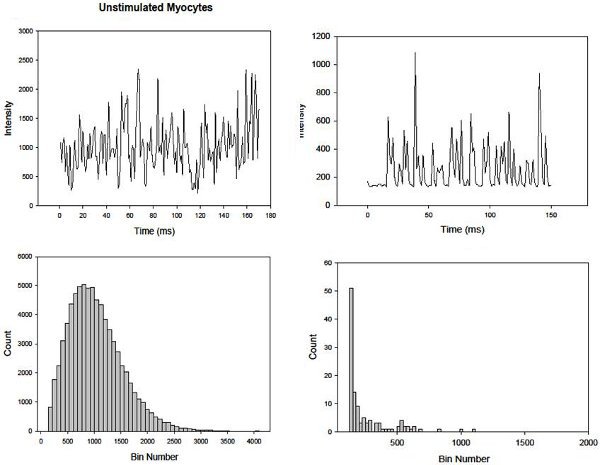
Figure 5. Intensity fluctuations of Ca2+Green in adult canine ventricular cardiomyocytes (left) and fresh, unstimulated rat neonatal cardiomyocytes that lack caveolae (right) and their corresponding histograms are shown below.