Science Education
>

Screening for Melanoma Modifiers using a Zebrafish Autochthonous Tumor Model

Instructor Prep
concepts
Student Protocol
JoVE Journal
Medicine
A subscription to JoVE is required to view this content.  Sign in or start your free trial.
JoVE Journal Medicine
Screening for Melanoma Modifiers using a Zebrafish Autochthonous Tumor Model

1. Screening for Melanoma Onset Modifiers

  1. Create Gateway middle entry clones by PCR amplifying the full-length open reading frame of genes of interest (GOI) and recombining into pDONR 221 using BP clonase II (Invitrogen). Use Multisite Gateway technology (Invitrogen) to recombine p5E_mitfa, pME_GOI, Tol2kit #302 p3E_SV40polyA6 and miniCoopR5 to place genes of interest under the mitfa promoter in the miniCoopR vector (Figure 1A).
  2. Inject 25 picograms of each clone along with 25 picograms Tol2 transposase mRNA into one-cell Tg(mitfa:BRAFV600E);p53(lf);mitfa(lf)triply homozygous zebrafish embryos as previously described7. Incubate the injected embryos at 28.5 °C. Remove any dead embryos at 24 hpf.
  3. Select transgenic animals with rescued melanocytes at 72 hpf by placing the Petri dish containing injected embryos on a dissecting microscope under incident light against a white background (Figure 1A).
  4. Transfer animals to 3 L tanks in the nursery of the zebrafish facility at 4 dpf as previously described8.
  5. At 2 months, select the animals with at least one area of melanocyte rescue greater than 4 mm2 (Figure 1A). There is a strong correlation between the degree of melanocyte rescue at 72 hpf and the degree of melanocyte rescue at 2 months. When embryos with melanocyte rescue are picked at 72 hpf, the majority of them (~80%) will have at least one area of melanocyte rescue greater than 4 mm2 at 2 months.
  6. Screen the selected animals weekly for the presence of tumors (Figure 1B). There is a strong correlation between histopathologic and morphologic changes. Transition from benign to malignant is recognized as a morphologic change when lesions become raised off the surface of the animal. Isolate tumor bearing animals for study.
  7. Draw melanoma-free survival curves with age in weeks on the abscissa and percent melanoma-free survival on the ordinate. Animals with melanocytes that express a gene of interest are compared to control animals that express EGFP (enhanced green fluorescent protein) in melanocytes (Figure 1C). The median tumor onset for animals injected with miniCoopR-EGFP is approximately 18 weeks. Determine whether the two curves are statistically different using a log rank test.

2. Tumor Invasion Assay

  1. Select isolated zebrafish that develop tumors dorsally, in a region between the posterior boundary of the hindbrain and anterior border of the dorsal fin (Figure 2A).
  2. Two weeks after melanoma onset euthanize the fish according to guidelines specified by the American Veterinary Medical Association Panel on Euthanasia and approved by the University of Massachusetts Medical School Institutional Animal Care and Use Committee (IACUC). Specifically, a fish is placed into a dish with 0.6 mg/ml tricaine until gill movement stops.
  3. Make an incision in the peritoneal cavity of the fish with a scalpel and then place the fish in 4% paraformaldehyde (PFA) overnight at 4 °C for fixation.
  4. Treat with 0.5 M EDTA overnight at 4 °C to decalcify.
  5. Fix with formalin in cassette overnight, dehydrate for 1 hr, clear with xylene 3 times for 1 hr and then treat with paraffin 2 times for 2 hr each at 60 °C.
  6. Embed the tissue in paraffin in a mould and allow it to solidify for 30 min to 1 hr.
  7. Make 5 μm sections, one every 50 μm. The sections should be transverse and through the entire lesion so that the point of deepest invasion can be identified. Follow by hematoxylin and eosin staining.
  8. Assess tumor invasion by measuring whether tumor cells remain outside the collagenous stratum compactum, invade into the dorsal musculature or invade further into the spinal column (Figure 2B,C). Determine statistical difference between the two sets of samples.

3. Antibody Staining of Scale Melanocytes

  1. Make up PO4 buffer with 80 ml 0.1 M Na2HPO4 and 20 ml 0.1M NaH2PO4. Make sure the pH is 7.3. Make up 2x fix buffer containing 8.0 g sucrose, 0.15 ml 0.2M CaCl2 and 90 ml 0.2M PO4 buffer, pH 7.3. If necessary adjust the pH to 7.3 with NaOH or HCl then make up to 100 ml with PO4 buffer.
  2. Weigh up to 300 mg solid PFA and add to a microcentrifuge tube. Add 5 mM NaOH to a volume equal to 4.5 x mass, in mg, of PFA (e.g. 450 ul 5 mM NaOH to 100 mg PFA). Heat at 60-70 °C with occasional shaking until the PFA is dissolved. Spin down remaining particulates and recover 20% PFA supernatant. Make fresh every time.
  3. Prepare fixation solution containing 1x fix buffer and 4% PFA.
  4. Anesthetize the fish in 0.17 mg/ml tricaine.
  5. Using incident light under a dissecting microscope pluck dorsal scales using sharp fine-tipped forceps, taking care not to damage the melanocyte-containing half of the scale (Figure 3A). Place scales directly from the forceps into 1 ml fixation solution and incubate at room temperature, while turning, for ≥ 2 hr. Transfer the fish into fish water and monitor the fish to confirm successful recovery.
  6. To bleach pigmented melanocytes wash fixed scales in PBST (1x PBS pH 7.4, 0.1% Triton X-100) 2 times for 5 min at room temperature. Add 1 ml freshly made bleach solution containing 0.4 ml 10% KOH and 0.15 ml 30% H2O2 in 5 ml with dH2O. Put on parafilm or cap locks to prevent gas from bursting the tubes open. Continue bleaching until pigment is gone (10 min is typical) (Figure 3B,C). Wash in PBST four times for 5 min at room temperature.
  7. Block for at least 30 min in block solution made up of 1x PBS pH 7.4, 0.2% Triton X-100, 2 mg/ml BSA, 1% DMSO, 0.02% NaN3 and 2% lamb serum. Leave out NaN3 if developing with HRP reaction.
  8. Incubate with primary antibody in block solution overnight at room temperature. You need to have at least 400 μl of solution over the samples to keep them submerged.
  9. Wash the scales 3 times for 30 min in PBST at room temperature.
  10. Incubate with secondary antibody from 2 hr to overnight in block solution at room temperature.
  11. Stain for 10 min with PBST+ 0.1 μM DAPI.
  12. Wash 3 times for 5 min with PBST.
  13. Mount the scales on a glass slide in a drop of vectashield so that the concave side of the scales faces down towards the slide and place a glass cover slip over them. Seal the edges of the slide with clear nail polish and observe the slides under a fluorescence microscope (Figure 3D,E,F,G).

4. Transplantation Assay

  1. Prepare recipient 2-3 month old casper9 fish by irradiating with 25 Gy of gamma irradiation one day prior to transplantation10. Allow the fish to recover in fish water.
  2. Euthanize a tumor-bearing fish as previously described (Section 2.2).
  3. Cut off the tumor and put it in a Petri dish with approximately 5 ml filter sterilized 0.9x PBS with 5% FBS. Dice the tumor with a razor while in solution.
  4. Working at room temperature, triturate with a P1000 pipette to get single cells. Make up the volume to 25 ml with filter sterilized 0.9x PBS with 5% FBS.
  5. Filter through 40 μM mesh filter.
  6. Spin in an Eppendorf 5810R tabletop centrifuge at 1,500 rpm (453 rcf) for 10 min.
  7. Remove the supernatant and make cell suspension to roughly desired concentration (assume 107 cells for a 100 mm3 tumor).
  8. Calculate the exact cell number using a hemocytometer and dilute the cell suspension so that the final injection volume is approximately 5 μl. For example, if 50,000 cells are to be injected, the cell suspension should be diluted to a final concentration of 10,000 cells/μl. Flick the tube containing the cell suspension every few min to prevent clumping of the cells.
  9. Wash a 26s gauge (bevel tip) 701 N 10 μl Hamilton syringe 2-3 times with 100% ethanol and 0.9x PBS. Load the syringe with 5 μl of the cell suspension.
  10. Anesthetize the irradiated recipient fish in 0.17 mg/ml tricaine. Place fish on its side on a damp Kimwipe (Figure 4A).
  11. Stabilize the fish with one hand and insert the needle with the bevel facing up at a 45° angle into the flank of the fish above the peritoneal cavity about halfway between the posterior boundary of the hindbrain and anterior border of the dorsal fin. Gently depress the plunger (Figure 4B).
  12. Allow the fish to recover in fresh fish water and observe the fish daily for tumor engraftment (Figure 4C). If engraftment has occurred, continued growth and disease development can also be observed.

Screening for Melanoma Modifiers using a Zebrafish Autochthonous Tumor Model

Learning Objectives

One-cell Tg(mitfa:BRAFV600E);p53(lf);mitfa(lf)zebrafish embryos were injected with the miniCoopR vector containing the melanoma oncogene SETDB15 or EGFP, each under the control of the mitfa promoter. Embryos with melanocyte rescue were selected and allowed to mature. At 2 months of age animals with melanocyte rescue greater than 4 mm2 were selected. The animals were screened weekly for melanomas. Tumor incidence curves for the adults showed that the SETDB1 oncogene significantly accelerated melanoma onsetas compared to the EGFP control (Figure 1). Animals which developed tumors between the posterior boundary of the hindbrain and the anterior border of the dorsal fin (Figure 2A) were isolated. Two weeks after melanoma onset they were fixed in 4% paraformaldehyde, sectioned and stained with hematoxylin and eosin to assess melanoma invasion into underlying tissues. Melanomas expressing SETDB1 were more locally invasive than EGFPcontrol melanomas (Figure 2C). In order to look for expression of a candidate gene, dorsal scales were plucked from a wild-type zebrafish and stained using a 1:100 dilution of a primary antibody that recognizes the Mitfa transcription factor followed by a 1:1,000 dilution of FITC goat anti-rabbit IgG antibody (Figure 3). To assess transplantability of the tumor, melanoma cells were isolated from a Tg(mitfa:BRAFV600E);p53(lf); mitfa(lf)fish injected with miniCoopR-EGFP. 50,000 cells were subcutaneously injected into a recipient casper mutant that had been irradiated the day before with 25 Gy. By 2 weeks of age, pigmented donor-derived cells were easily recognized (Figure 4).

Figure 1
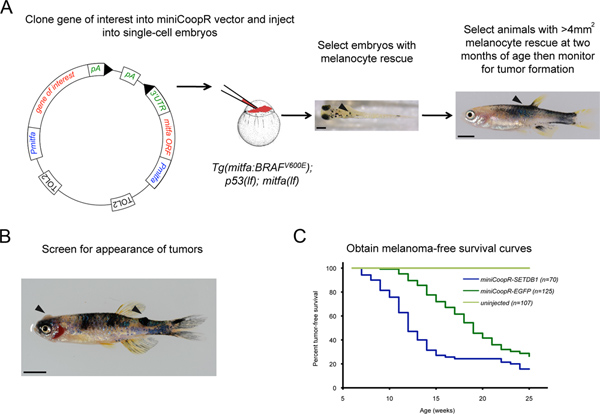
Figure 1. Screening for melanoma onset modifiers using the miniCoopR assay. A) Schematic of the miniCoopR assay. Embryo with rescued melanocytes (arrowhead) containing the miniCoopR vector and the gene of interest. Scale bar = 250 μM. Adult with greater than 4 mm2 melanocyte rescue (arrowhead). Scale bar = 500 μM B) MiniCoopR-EGFP rescued zebrafish with an amelanotic and a pigmented tumor (arrowheads). C) Representative melanoma-free survival curve comparing tumors expressing oncogene SETDB1 and a control EGFP gene (p = 9.4×10⁻⁷, logrank χ2). Click here to view larger figure.

Figure 2
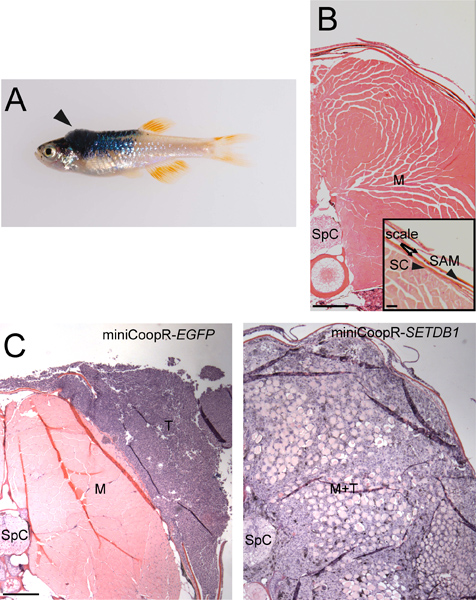
Figure 2. Tumor invasion assay. A) MiniCoopR-rescued zebrafish with a dorsal tumor (arrowhead) between the posterior boundary of the hindbrain and the anterior border of the dorsal fin. B) Transverse section showing stratum compactum (SC), scales, scale-associated melanocyte (SAM) (inset, scale bar = 50 μM), muscle (M) and spinal column (SpC). Scale bar = 200 μM. C) Transverse sections showing a non-invasive miniCoopR-EGFP tumor (T) (left) and a miniCoopR-SETDB1 tumor (right) that has invaded through the stratum compactuminto muscle (M) and the spinal column. Scale bar = 200 μM.

Figure 3
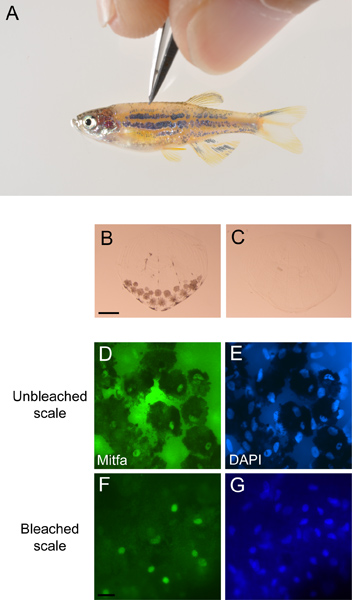
Figure 3. Antibody staining of scale melanocytes. A) Scales being plucked from an anesthetized miniCoopR-EGFP zebrafish. B) Unbleached scale with pigmented melanocytes and C) bleached scale from miniCoopR-EGFP zebrafish. Scale bar = 100 μM. Unbleached scale stained with a D) Mitfa antibody and E) DAPI. Bleached scale stained with a F) Mitfa antibody and G) DAPI. Scale bar = 40 μM.

Figure 4
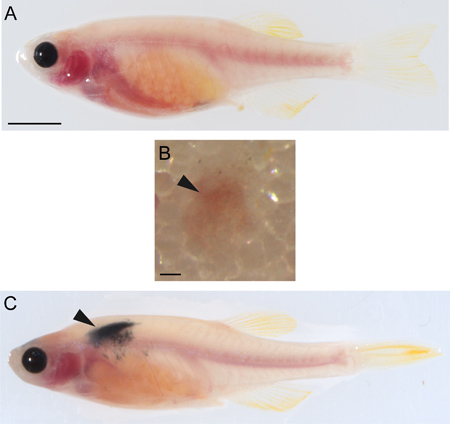
Figure 4. Transplantation of melanoma cells. A) Uninjected casper zebrafish. Scale bar = 500 μM. B) Subcutaneous transplantation site (arrowhead) on an irradiatedcasperrecipient immediately after injection with 50,000 melanoma cells. Scale bar = 200 μM. C) Irradiatedcasperrecipient showing tumor engraftment (arrowhead) two weeks after injection with 50,000 melanoma cells.

List of Materials

Name of the reagent Company Catalogue number Comments
Gateway recombination reagents Invitrogen    
miniCoopR     Reference5
Mitfa antibody     Reference5
FITC goat anti-rabbit IgG antibody Invitrogen    
Vectashield Vector Labs H-1000  
casper Zebrafish     Reference9
701N 10 μl Syringe Hamilton/Fisher 14-824  
40 μM filter BD Falcon/Fisher 352340  
FBS Invitrogen 26140079  

Lab Prep

Genomic studies of human cancers have yielded a wealth of information about genes that are altered in tumors1,2,3. A challenge arising from these studies is that many genes are altered, and it can be difficult to distinguish genetic alterations that drove tumorigenesis from that those arose incidentally during transformation. To draw this distinction it is beneficial to have an assay that can quantitatively measure the effect of an altered gene on tumor initiation and other processes that enable tumors to persist and disseminate. Here we present a rapid means to screen large numbers of candidate melanoma modifiers in zebrafish using an autochthonous tumor model4 that encompasses steps required for melanoma initiation and maintenance. A key reagent in this assay is the miniCoopR vector, which couples a wild-type copy of the mitfa melanocyte specification factor to a Gateway recombination cassette into which candidate melanoma genes can be recombined5. The miniCoopR vector has a mitfa rescuing minigene which contains the promoter, open reading frame and 3′-untranslated region of the wild-type mitfa gene. It allows us to make constructs using full-length open reading frames of candidate melanoma modifiers. These individual clones can then be injected into single cell Tg(mitfa:BRAFV600E);p53(lf);mitfa(lf)zebrafish embryos. The miniCoopR vector gets integrated by Tol2-mediated transgenesis6 and rescues melanocytes. Because they are physically coupled to the mitfa rescuing minigene, candidate genes are expressed in rescued melanocytes, some of which will transform and develop into tumors. The effect of a candidate gene on melanoma initiation and melanoma cell properties can be measured using melanoma-free survival curves, invasion assays, antibody staining and transplantation assays.

Genomic studies of human cancers have yielded a wealth of information about genes that are altered in tumors1,2,3. A challenge arising from these studies is that many genes are altered, and it can be difficult to distinguish genetic alterations that drove tumorigenesis from that those arose incidentally during transformation. To draw this distinction it is beneficial to have an assay that can quantitatively measure the effect of an altered gene on tumor initiation and other processes that enable tumors to persist and disseminate. Here we present a rapid means to screen large numbers of candidate melanoma modifiers in zebrafish using an autochthonous tumor model4 that encompasses steps required for melanoma initiation and maintenance. A key reagent in this assay is the miniCoopR vector, which couples a wild-type copy of the mitfa melanocyte specification factor to a Gateway recombination cassette into which candidate melanoma genes can be recombined5. The miniCoopR vector has a mitfa rescuing minigene which contains the promoter, open reading frame and 3′-untranslated region of the wild-type mitfa gene. It allows us to make constructs using full-length open reading frames of candidate melanoma modifiers. These individual clones can then be injected into single cell Tg(mitfa:BRAFV600E);p53(lf);mitfa(lf)zebrafish embryos. The miniCoopR vector gets integrated by Tol2-mediated transgenesis6 and rescues melanocytes. Because they are physically coupled to the mitfa rescuing minigene, candidate genes are expressed in rescued melanocytes, some of which will transform and develop into tumors. The effect of a candidate gene on melanoma initiation and melanoma cell properties can be measured using melanoma-free survival curves, invasion assays, antibody staining and transplantation assays.

Procedure

Genomic studies of human cancers have yielded a wealth of information about genes that are altered in tumors1,2,3. A challenge arising from these studies is that many genes are altered, and it can be difficult to distinguish genetic alterations that drove tumorigenesis from that those arose incidentally during transformation. To draw this distinction it is beneficial to have an assay that can quantitatively measure the effect of an altered gene on tumor initiation and other processes that enable tumors to persist and disseminate. Here we present a rapid means to screen large numbers of candidate melanoma modifiers in zebrafish using an autochthonous tumor model4 that encompasses steps required for melanoma initiation and maintenance. A key reagent in this assay is the miniCoopR vector, which couples a wild-type copy of the mitfa melanocyte specification factor to a Gateway recombination cassette into which candidate melanoma genes can be recombined5. The miniCoopR vector has a mitfa rescuing minigene which contains the promoter, open reading frame and 3′-untranslated region of the wild-type mitfa gene. It allows us to make constructs using full-length open reading frames of candidate melanoma modifiers. These individual clones can then be injected into single cell Tg(mitfa:BRAFV600E);p53(lf);mitfa(lf)zebrafish embryos. The miniCoopR vector gets integrated by Tol2-mediated transgenesis6 and rescues melanocytes. Because they are physically coupled to the mitfa rescuing minigene, candidate genes are expressed in rescued melanocytes, some of which will transform and develop into tumors. The effect of a candidate gene on melanoma initiation and melanoma cell properties can be measured using melanoma-free survival curves, invasion assays, antibody staining and transplantation assays.

Tags