Science Education
>

Anticancer Metal Complexes: Synthesis and Cytotoxicity Evaluation by the MTT Assay

Instructor Prep
concepts
Student Protocol
JoVE Journal
Chemistry
A subscription to JoVE is required to view this content.  Sign in or start your free trial.
JoVE Journal Chemistry
Anticancer Metal Complexes: Synthesis and Cytotoxicity Evaluation by the MTT Assay
  1. Preparation of the V (V) complex (Figure 2);18 conduct steps 1.1-1.4 in a glove-box; if a glove-box is not available, skip to the alternative steps 2 (2.1-2.6).
    1. Dissolve 0.42 mmol of the ligands H2L in dry THF and add it to a stirring solution of equivalent amounts of VO(OiPr)3 in THF.
    2. Stir the reaction mixture at room temperature for 15 min, and remove the volatiles under vacuum.
    3. Add cold hexane and remove it under vacuum. A dark purple powder should be obtained in a quantitative yield.
    4. Weigh 8 mg of the obtained compound in an Eppendorf vial. Skip to step 3.
  2. Prepare the V (V) complex using a Schlenk line.
    1. Dissolve 0.42 mmol of the ligand H2L in dry THF in a dry Schlenk flask with a septum cap, attach to a Schlenk line and apply alternating vacuum/inert gas (N2 or Ar) environments; it is recommended to apply three such rounds and wait 2-5 min on the vacuum stages.
    2. Add dry THF via syringe through the septum cap.
    3. Add equivalent amounts of VO(OiPr)3 in a THF solution, which had been prepared similarly by hooking a proper dry Schlenk flask to the line, applying an inert environment and adding the reagents through a syringe from the vanadium solution to that of the ligand.
    4. Stir the reaction mixture at room temperature for 15 min and remove the volatiles under vacuum; if there is a concern of unstable products, perform Schlenk type distillation of the volatiles under inert atmosphere; use inert gas flow to attach the required glassware that had been predried.
    5. Add cold hexane and remove it under vacuum. A dark purple powder should be obtained in a quantitative yield.
    6. Weigh 8 mg of the obtained compound in an Eppendorf vial.
  3. Preparation of the Ti (IV) complex (Figure 2);28 conduct steps 3.1-3.3 in a glove-box; if a glove-box is not available, adjust the alternative steps discussed for the vanadium analogue (step 2) that employ a Schlenk line instead.
    1. Dissolve 0.35 mmol of the ligand H2L in dry THF and add it to a stirring solution of equivalent amounts of Ti(OiPr)4 in THF.
    2. Stir the reaction mixture at room temperature for 2 hr. Remove the volatiles under vacuum to give a yellow product in a quantitative yield.
    3. Weigh 8 mg of the obtained compound in Eppendorf vial.
  4. Preparation of HT-29 cells 96-well plate
    1. Culture HT-29 cells in a 75 cm2 flask with RPMI-1640 medium that contains 1% penicillin/streptomycin antibiotics, 1% L-glutamine, and 10% fetal bovine serum (FBS), at 37 °C with 5% CO2.
    2. Remove the medium when the HT-29 cells reach maximal confluency (90-100%, every 3-4 days without subculture). Wash with 1 ml of trypsin (0.25%)/EDTA (0.05%) solution and remove it.
    3. Add 1 ml of trypsin (0.25%)/EDTA (0.05%) solution and incubate for 5 min.
    4. Detach the HT-29 cells from the flask and add 10 ml of the medium to disable the trypsin activity. Transfer 5 ml of the cells mixture to a tube.
    5. Use pipette to transfer a few drops of the cells mixture into counter chamber. The counter chamber includes 5 x 5 squares.
    6. Count the cells in 5 representative squares using a microscope: the 4 squares in the corners and the one that is in the middle.
    7. Calculate the estimated amount of cells present. Sum the cells in the 5 representative squares and divide by 20.
    8. Divide 0.6 by the result of step 4.7. The received number is the amount of cell mixture required per plate. This calculation refers to a plate that contains 0.6 x 106 cells (9,000 cells per well).
    9. Use pipette to transfer the amount of cell mixture required per plate (as calculated in section 4.8) and add 13.2 ml of the medium (200 μl per well × 66 wells).
    10. Add the mixture to 96-well plate by 11-channel pipette (200 μl per well, 6 lines, 66 wells in total). One well of each line should remain empty for blank control.
    11. Incubate the plate at 37 °C with 5% CO2 for 24 hr to allow the cells to attach to the plate.
  5. Insertion of the compounds
    1. Add 200 μl (or different amount according to the desired concentration range) of dry THF to 8 mg of each compound weighed as described in step 1.4 (or 2.6) or 3.3. Weigh 8 mg of the ligand H2L, too.
    2. Dilute each compound solution further by adding 60 μl of THF in 9 different Eppendorf vials.
    3. Transfer with a pipette 60 μl from the mixture in section 5.1 to the first Eppendorf vial, resuspend and transfer 60 μl to the next vial, and so on until 10 different concentrations are obtained (including the parent mixture in section 5.1).
    4. Dilute 20 μl of each concentration in THF with 180 μl of medium.
    5. Prepare a control solution with THF only; 20 μl of THF with 180 μl of medium in each measurement.
    6. Add 10 μl from the resulting solution (including the THF control), to each well that already contains 200 μl of the aforementioned solution of cells in the medium to give final concentrations of the compound of up to 200 mg/L (the concentration range can be changed according to the compound activity).
    7. You may observe some precipitation at the highest concentration applied depending on the compound solubility.
    8. Repeat each measurement of the compound 3x (3 lines in the plate of the same compound); each line contains: cells treated with the compound in 10 different concentrations, 1 well containing cells treated with solvent only for control and 1 well without cells for blank control.
    9. Incubate the loaded plate for 3 days at 37 °C in 5% CO2 atmosphere.
  6. Cytotoxicity measurement using the MTT assay
    1. Prepare the MTT solution by adding 1 g of MTT powder to a 200 ml solution of RPMI-1640 medium without phenol red. The stock solution can be divided to 15 ml tubes and stored in -20 °C.
    2. Add 20 μl of MTT solution to each well using 11-channel pipette (except to the blank control wells without the cells from step 4.10), and incubate the plate for additional 3 hr.
    3. Remove the medium solution from each well.
    4. Add 200 μl of isopropanol to each well to dissolve formazan. Stir the plate for 0.5 hr until homogeneousness is reached.
    5. Measure the absorbance at 550 nm for 200 μl of the aforementioned solution by a microplate reader spectrophotometer.
    6. Repeat each measurement (that includes 3 repetitions, see step 5.8) on 3 different days.
    7. Calculate the percentage of cell viability by deducting the blank control absorbance value from the measured value, dividing the result by the absorbance of the THF solvent control value and multiplying by 100%.
    8. Calculate IC50 values using GraphPad Prism software (or equivalent).
    9. The reported IC50 is the average of all IC50 values collected on at least three different days, and the error value is the standard deviation.

Anticancer Metal Complexes: Synthesis and Cytotoxicity Evaluation by the MTT Assay

Learning Objectives

The complexes were prepared based on established procedures18,28 and their purity may be evaluated by NMR and elemental analysis.

The data received from the MTT assay is analyzed to evaluate the cytotoxicity of the compound18,21. First, subtraction of the blank control absorbance value from all the other values is performed. Second, the THF solvent control value is set to 100% viability, as no growth inhibiting compound was added. All other values are transformed into percentage of viability according to the control. The concentrations applied and the relative viability percentage calculated are then inserted into the GraphPad Prism software (or equivalent) to determine the IC50 values based on a nonlinear regression of a variable slope (four parameters) model (Figure 4, Table 1)29.

The measurements should be performed on a range of concentrations that will produce a graph displaying an even point distribution: at least three points on each plateau and three points to define the slope (Figure 3, graph A). Insufficient measurements at high concentrations or low concentrations (Figure 3, graph B) will impair the nonlinear regression fit of the curve required for determination of IC50 values, and as a result, diminish their accuracy.

Relative IC50 values, as determined by the nonlinear regression fit29, correspond to the concentrations leading to 50% of the cell growth inhibition possible by the compound tested, which is calculated as the middle point between the maximal and minimal cell viability measured (not necessarily 100% and 0%, respectively, see Figure 3, graph C, a). For instance, if a compound inhibits only 60% of cell growth relative to the control (and 0% at low concentrations), its relative IC50 is the concentration leading to 30% inhibition relative to the control. The error values should reflect the deviation of the results obtained for different repetitions from the average IC50 value reported, taken as the STDs. In addition, maximal cell growth inhibition (%) values should be reported, as calculated by subtracting from 100% the minimal viability measured.

An alternative analysis may include determination of absolute IC50 values. These correspond to the concentrations leading to 50% cell growth inhibition relative to the 100% control, regardless of the maximal and minimal cell viability measured. Such values can also be derived by a non-linear regression model. As these values are absolute, reporting the maximal cell growth inhibition values is optional. As depicted in Figure 3, graph C, a compound may have a relatively low activity in terms of maximal cell growth inhibition properties (curve a), and still exhibit a relative IC50 value that is lower not only than its absolute one, but also than that of a compound that reaches close to 100% growth inhibition (curve b). It is thus extremely valuable to present the curve along with the reported IC50 values of any kind.

When inspecting the results of the experiments described in the protocol (Figure 4, Table 1), it is clear that cisplatin and complexes LTi(OiPr)2 and VO(OiPr) are highly active. It is also noticeable that the closer the maximal inhibition value of a given compound is to 100%, the closer the relative IC50 value is to the absolute one. When comparing the IC50 values among the different compounds, the Ti (IV) complex has the highest cytotoxicity and its IC50 values are lower than those of cisplatin and the V (V) complex. However, the free ligand exhibits markedly reduced activity, since following addition of the ligand at different concentrations, the cell viability does not drop as significantly as it does for its complexes. This assures that the high anticancer activity of the complexes relies on the metal centers. Since the free ligand barely reaches 50% cell growth inhibition, an absolute IC50 value cannot be accurately derived. In fact, a relative value also could not have been adequately calculated by the software due to the minor activity and corresponding high error values. Nevertheless, it is clear that even if a relative IC50 value could have been derived for H2L, it would not have reflected an appreciable activity, thus rendering the report of the maximal inhibition value along with relative IC50 values (and the depiction of the curve) essential.

Relative IC50 (μM) Absolute IC50 (μM) Maximal inhibition (%)
LVO(OiPr) 13±3 19±8 81%
LTi(OiPr)2 3±1 5±3 87%
H2L 47%
Cisplatin 14±5 13±6 91%

Table 1. Cytotoxicity results for the compounds tested: Relative and absolute IC50 (μM) and maximum cell growth inhibition values toward HT-29 cells following an incubation period of three days with the V (V) complex LVO(OiPr), Ti (IV) complex LTi(OiPr)2, the free ligand H2L and cisplatin;18,21 IC50 values are given as average of at least three times three repetitions with error values as the STDs.

Figure 1
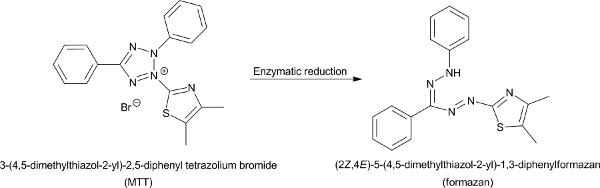
Figure 1. The reduction of MTT by mitochondrial and cytosolic enzymes to formazan. Click here to view larger figure.

Figure 2
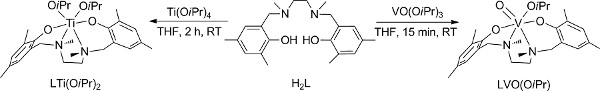
Figure 2. Preparation of V (V) and Ti (IV) complexes18,28. Click here to view larger figure.

Figure 3
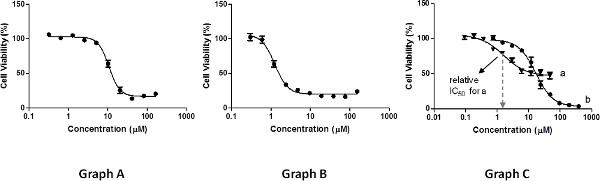
Figure 3. Examples of results of cell viability measurements. Click here to view larger figure.

Figure 4
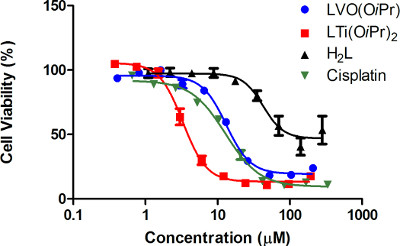
Figure 4. Dose dependent cytotoxicity curves for the compounds tested: Dependence of HT-29 cell viability on administered concentration of the V (V) complex LVO(OiPr) (blue), the Ti (IV) complex LTi(OiPr)2 (red), free ligand H2L (black) and cisplatin (green), following an incubation period of three days, as obtained from at least three times three repetitions as reflected by the error values18,21.

List of Materials

Reagent/Material
Fetal bovine serum (FBS) Biological Industries 04-007-1A
Hexane AR Gadot 830122313 Dried using a solvent drying system
HT-29 cell line ATCC HTB-38
Isopropanol AR Gadot 830111370
L-glutamine Biological Industries 03-020-1B
MTT Sigma-Aldrich M5655-1G
Penicillin/streptomycin antibiotics Biological Industries 03-031-1B
RPMI-1640 with phenol red with L-glutamine Sigma-Aldrich R8758
RPMI without phenol red Biological Industries 01-103-1A
Tetrahydrofuran (THF) AR Gadot 830156391 dried using a solvent drying system
Ti(OiPr)4 Sigma-Aldrich 205273-500ML moisture sensitive
Trypsin/EDTA Biological Industries 03-052-1B
VO(OiPr)3 Sigma-Aldrich 404926-10G moisture sensitive
Equipment
12-channel pipette 30-300 μl Thermo Scientific
12-channel pipette 5-50 μl Finnpipette
75 cm2 flask NUNC 156472
96-well plate with lid (flat bottom) NUNC 167008
CO2 Incubator Binder APT.line C150
Counter chamber Marienfeld-Superior 650030
Eppendorf vial KARTELL
Glove box M. Braun
Laminar flow hood ADS LAMINAIRE OPTIMALE 12
Microplate reader spectrophotometer Bio-Tek El-800
Microscope Nikon Eclipse TS100
Pipette 20-200 μl Finnpipette
Pipette 5-50 μl Finnpipette

Lab Prep

Titanium (IV) and vanadium (V) complexes are highly potent anticancer agents. A challenge in their synthesis refers to their hydrolytic instability; therefore their preparation should be conducted under an inert atmosphere. Evaluation of the anticancer activity of these complexes can be achieved by the MTT assay.

The MTT assay is a colorimetric viability assay based on enzymatic reduction of the MTT molecule to formazan when it is exposed to viable cells. The outcome of the reduction is a color change of the MTT molecule. Absorbance measurements relative to a control determine the percentage of remaining viable cancer cells following their treatment with varying concentrations of a tested compound, which is translated to the compound anticancer activity and its IC50 values. The MTT assay is widely common in cytotoxicity studies due to its accuracy, rapidity, and relative simplicity.

Herein we present a detailed protocol for the synthesis of air sensitive metal based drugs and cell viability measurements, including preparation of the cell plates, incubation of the compounds with the cells, viability measurements using the MTT assay, and determination of IC50 values.

Procedure

Titanium (IV) and vanadium (V) complexes are highly potent anticancer agents. A challenge in their synthesis refers to their hydrolytic instability; therefore their preparation should be conducted under an inert atmosphere. Evaluation of the anticancer activity of these complexes can be achieved by the MTT assay.

The MTT assay is a colorimetric viability assay based on enzymatic reduction of the MTT molecule to formazan when it is exposed to viable cells. The outcome of the reduction is a color change of the MTT molecule. Absorbance measurements relative to a control determine the percentage of remaining viable cancer cells following their treatment with varying concentrations of a tested compound, which is translated to the compound anticancer activity and its IC50 values. The MTT assay is widely common in cytotoxicity studies due to its accuracy, rapidity, and relative simplicity.

Herein we present a detailed protocol for the synthesis of air sensitive metal based drugs and cell viability measurements, including preparation of the cell plates, incubation of the compounds with the cells, viability measurements using the MTT assay, and determination of IC50 values.

Tags