Science Education
>

Extracting Visual Evoked Potentials from EEG Data Recorded During fMRI-guided Transcranial Magnetic Stimulation

Instructor Prep
concepts
Student Protocol
JoVE Journal
Neuroscience
A subscription to JoVE is required to view this content.  Sign in or start your free trial.
JoVE Journal Neuroscience
Extracting Visual Evoked Potentials from EEG Data Recorded During fMRI-guided Transcranial Magnetic Stimulation

The experiment is conducted in two separate sessions. During the first session a functional MRI experiment (e.g. a functional localizer) is carried out in order to define the desired TMS target areas on an individual subject basis. The fMRI results are then fed into a stereotactic navigation system for an accurate TMS targeting. The second session is held following the analysis of the fMRI data, during which EEG is recorded concurrently with TMS. The protocol described here was approved by the ethics committee of the Tel-Aviv Sourasky Medical Center.

In the example given in this paper, data were analyzed with MATLAB version 7.7 (R2008b).  The Statistical Parametric Mapping (SPM 5) software for MATLAB and MarsBar toolbox for SPM 23 were used for fMRI data processing.

1. fMRI Session and fMRI Data Analysis

  1. Run a functional MRI task using an echo planar imaging (EPI) sequence to determine the desired foci of activation to be targeted with TMS. For a better dissociation between adjacent areas, such as the OFA and EBA in the example below, high-resolution scanning is recommended. Voxels of 3 mm3 or smaller, obtained with an MRI head-coil of 8 channels or more, are sufficient for delineating adjacent regions.
  2. Run a T1-weighted structural scan to obtain neuroanatomical data. Make sure that the face of the participant is entirely included in the field of view of this scan, since external markers on the image (e.g. the tip of the nose) will be later used to coregister the subject's head with its scan.
  3. After data collection, use the MarsBar toolbox for SPM to define the desired brain regions of interest based on contrasts between the experimental conditions. Use the contrasts face>objects to define the Occipital Face Area (OFA), and bodies>objects to define the Extrastirate Body Area (EBA). To further ensure that the two cortical targets are functionally distinct, use "conjunction" (in MarsBar) to mask from each ROI any voxels responding to the other experimental condition (exclude face-voxels from the EBA, and body-voxels from the OFA).
  4. Corregister the structural T1 images with the functional scans, using SPM.
  5. Copy the files of the structural scan, as well as the relevant functional contrast files, to a portable drive in order to upload to the navigation system.

2. Preparing a Paradigm for the EEG-TMS Experiment that will allow ERP Extraction

Described in the section below is a method for collecting EEG data during TMS application in a way that allows extraction of reliable and replicable ERPs19. The advantage of this technique is that it easily handles the secondary, long lasting, TMS artifact, and is robust enough even to allow restoration of data at electrodes located right under the TMS coil, where the artifact is of the highest voltage and longest duration.

  1. Organization of the paradigm
    1. Run the different TMS conditions (the different target brain areas, as well as a no-TMS condition) in separate blocks.
    2. Within each block present the participant with all stimulus conditions (e.g. faces, objects, scenes and so forth) randomly in an event-related design.
    3. For better quality of ERP and TMS-noise template (below) make sure to have at least 50 trials per condition.
  2. Set the timing of the TMS pulse/pulses to the desired latency after image onset. This is done via writing to a parallel port, from which a cable goes to the TMS stimulator. This function is available in most software for psychological experiments, such as Psychtoolbox (versions 2 or 3) for MATLAB 24 or E-Prime (see Materials Table). Jitter the inter stimulus interval (ISI) to reduce stimulus (and pulse) predictability (e.g. add a random value between 0 to 500 msec at each ISI).
  3. Prepare an additional blank-screen condition:
    1. Prepare trials during which TMS will be applied at the same intensity, but with no stimulus presentation on the screen. These blank-screen TMS trials will be served to calculate a TMS artifact template in the absence of visual stimulation.
    2. Set the number of repetitions of the blank trials to be identical to the number of repetitions of any one of the experimental conditions within the block.
    3. For an accurate representation of the shape of the TMS residual artifact, randomize the blank trials throughout the whole block rather than presenting them all at the beginning or at the end.

3. Setting up the EEG and the Neuronavigation System, and Conducting the Experiment

Accurate TMS targeting of individually defined ROIs is possible with the use of a stereotactic navigation system, comprised of an infrared camera, infrared sensors mounted on the participant's head, and a specialized software.

  1. Screen participants based on TMS safety criteria. Exclude from participation subjects with a self or family history of epilepsy, subjects with other neurological conditions or with frequent migraines, and subjects on psychoactive drugs. Although not typically screened for, subjects with suspicion for autonomic disorders such as vasovagal syncopes (mostly manifested as a tendency to faint easily) may also be excluded. Instruct participants to avoid alcoholic drinks starting the prior evening, and caffeinated drinks at least 2 hr before the experiment.  For further instructions and discussion of safety see Rossi et al25, and the Magstim safety review (http://joedevlin.psychol.ucl.ac.uk/tms/docs/magstim_safety.pdf).
  2. Prepare the neuronavigation system:
    1. Before the session starts, feed the structural scan files into the navigation system's software.
    2. Overlay the functional MRI results (the contrasts) on the structural images.
    3. Using the Neuronavigation software, mark the desired targets on the images, as well as the external anatomical markers that will serve for coregistration: the tip of the nose, the deepest part of the nose bridge often referred to as nasion, and the tragus of each ear.
  3. Mount the EEG cap on the participant's head and connect the electrodes:
    1. Try to keep electrode impedance not higher than 5 kΩ.
    2. To avoid TMS-related heating of the electrodes, use as little gel as possible. To achieve good impedance with little amount of gel perform a thorough skin preparation. Optionally, ask participants to wash their hair before coming to the experiment.
    3. Make sure that the electrode wires do not cross each other and are oriented away from the coil's location. Avoid loops in the wires.
    4. Use a high sampling rate for a better representation of the noise artifact. It is recommended to use 1 kHz or above, as most previous studies using this method have done7,26-28.
    5. Place the reference and ground electrodes as far from the coil as possible. In this example, areas in the occipital cortex were targeted using a nose reference and an Fz ground7. For other examples see3,4,27,29,30. Note that data can be re-referenced offline to a new reference as needed, such as the common average.
      Note: For a review about optimization of TMS-EEG setup, see Veniero et al31.
  4. Coregister the subject's head with the scan, as follows:
    1. Mount the infrared detectors on the participant's head.
    2. Coregister the head location with the navigation system using the predefined markers (tip of the nose, etc. See Figure 3). It is advised to repeat the coregistration between blocks to ensure accurate coil placement at all stages.
  5. Locate the target areas:
    1. Have the subject seated with the chin resting on a chinrest at the desired distance from the screen.
    2. Make sure the participants are comfortable at their chair, as they are asked to refrain from movements during the experimental blocks (important for an accurate noise-template measurement).
    3. Choose a TMS target from the navigation system Figure 3.
    4. Using the pointer tool (see Materials Table), let the navigation system guide the user to the optimal coil location and mark it with a small sticker on the electrode cap. It is important to hold the pointer perpendicular to the head. Repeat this stage prior to each block. Note that it is not recommended to use online navigation during the block (navigating the coil itself while holding it) since any coil movement should be avoided for a best measurement of the TMS artifact template. It was found that predefining and marking the TMS location is the optimal way to achieve stable stimulation.
    5. Guide the coil's precise center to the marker, while being held by a holder. Make sure it is tangential to the head.
  6. Set the TMS intensity to the desired value. Administer one test pulse for the participant's approval.
  7. Run the experimental block.
  8. No-TMS condition: if a specialized sham TMS coil is not available, place the TMS coil next to the subject's head and tilt it in 90°. Run the block as usual, including the blank trials.
    The reader may also refer to the JoVE video paper by Andon and Zatorre32 for further demonstration of the navigation system.

4. Analyzing the EEG Data and Computing ERP

  1. Remove the immediate pulse artifact, as follows:
    1. If a clipping device is not available (see above), the first step in the EEG data processing would be to cut out the immediate TMS pulse artifact itself from the data. Note that this step can be skipped if filters are not desired. But if filters are applied, the sharp-edge shape of the artifact will create distortions in the data. A narrow time-window of 10 to 15 msec after pulse onset should suffice, but be sure to verify this by visual inspection of the data.
    2. Connect the two cut ends created after pulse removal. Two main methods for accomplishing this have been suggested in previous reports: 1. simply join together the two ends remaining after pulse removal (see Fuggetta et al.26 and Figure 1); 2. interpolate a line between the two cut ends by generating equally spaced values between them7. The equation used for this interpolation is as follows: for each missing data point y at sample x, compute y=y0+((y1-y0)*(x-x0))/(x1-x0) where x0 and y0 are the coordinates for the last data point before the cut segment, and x1 and y1 are the coordinates for the first data point after the cut segment. Both techniques assure that filters can be applied on the data without producing ripples due to sharp voltage steps, as demonstrated in Figure 1. Refer to the work by Reichenbach and colleagues27 for a more complex 3rd order polynomial interpolation.
  2. Apply the subtraction method:
    1. For each experimental block, including a no-TMS control condition if present, calculate an averaged ERP to the blank screen trials by time-locking them to trial start (as if an image had been presented).
    2. Subtract this averaged template from each trial of all other stimulus conditions. If several blocks were run for the same stimulation site, do this separately for each block, as the template will be slightly different between the blocks.
  3. All other preprocessing and processing steps are carried out as in any other ERP experiment.

Extracting Visual Evoked Potentials from EEG Data Recorded During fMRI-guided Transcranial Magnetic Stimulation

Learning Objectives

A concurrent EEG-TMS investigation was used to reveal whether the ERP responses to faces and bodies recorded over the occipito-temporal scalp are dissociated. When visual stimuli are presented, a prominent N1 component is recorded at posterior-lateral electrode sites. In particular, the N1 component is typically larger for faces and bodies than to other stimulus categories8,33. By assessing the effect of stimulation on face and body-selective brain areas defined with fMRI on their respective face and body N1 component, we attempted to reveal whether the face and body N1 responses reflect (at least partially) non-overlapping sources, or rather the same network activity with quantitatively different activation levels.

We applied a double-pulse stimulation at 60 msec and 100 msec after image onset (see for example Pitcher et al.34,35), to the face-selective and body-selective areas in the lateral occipital cortex – the Occipital-Face Area (OFA) and the Extrastriate Body Area (EBA) (Figure 4A, see section 1.3 above for definition of the relevant fMRI contrasts). The two areas were stimulated in separate blocks, while subjects viewed images of faces and headless bodies. Results show that stimulation to the OFA enhance the N1 amplitude to faces but not to bodies, whereas stimulation to the EBA enhance the N1 to bodies but not to faces. Figure 2B depicts the face N1 before and after TMS residual artifact subtraction, and Figure 4B shows the specific effect of TMS on the N1 component as a function of stimulated area.

These findings show how fMRI-guided TMS during concurrent EEG recording can be applied to assess whether two (or more) neural networks are dissociated, as well as to establish a causal link between a functionally defined brain area and an electrophysiological signal.

Figure 1
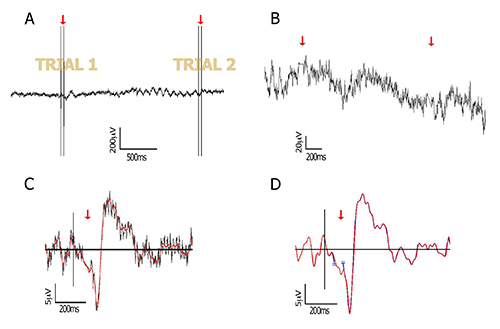
Figure 1. Data processing.  Raw and processed data of a representative subject, at the lateral-occipital electrode PO8. (A) Raw EEG data including two trials, each containing two TMS pulses separated by 40 msec (red arrows); (B) Zoom into the data after pulse removal. The two pulses at each trial are removed from the data by cutting a window around the double-pulse (2 msec before first pulse to 16 msec after second pulse). The cut edges are then connected by interpolation (red arrows) as explained in 4.1.2; (C)  The interpolated segment allows filtering without creating edge artifacts. In this figure, a 40 Hz low-pass filtered ERP (red) is plotted against its non-filtered version (grey); (D) As an alternative to interpolation, the free ends that are remained after pulse removal can be joined together (see for example Fugetta et al26, and point 4.1.2 in the text). Here, both methods are compared and show highly similar waveforms (blue and red traces mostly overlap), after low-pass filtering at 40 Hz. Red trace: linear interpolation method; blue trace: no interpolation (connected edges are taken apart for plotting purpose only, to keep consistency of time axis). Please click here to view a larger version of this figure.

Figure 2
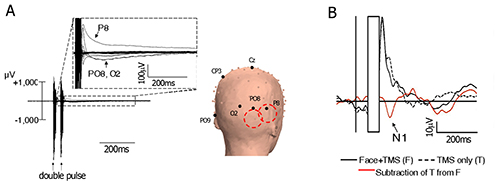
Figure 2. TMS artifacts and the subtraction technique. (A) Left – ERP time-locked to the presentation of an image of a face, with a double-pulse TMS at 60 msec and 100 msec after image onset. Each line represents an electrode. Note that for some electrodes the immediate TMS artifact is followed by a longer residual artifact. Right – Approximate coil location is symbolized by the two red circles, and a few electrodes are labeled for orientation; (B) Artifact-subtraction procedure. The immediate pulse artifact is removed (concealed), a template of the residual noise is measured based on "TMS only" trials and subtracted from full trials. Adapted with permission from Sadeh et al7. Please click here to view a larger version of this figure.

Figure 3
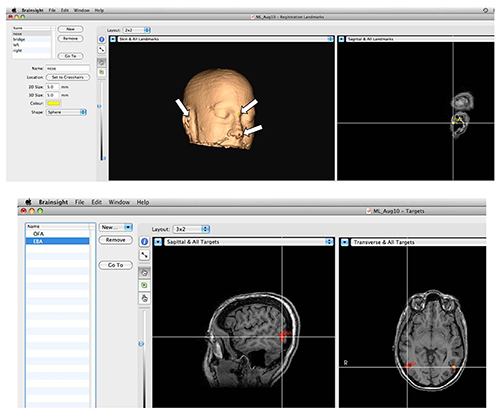
Figure 3. Stereotactic Navigation System. Top: Setting landmarks for corregistration. In order to corregister the structural scan of the head with the actual head position during the experiment, anatomical landmarks are marked on the image as shown by arrows. Then, the locations in space of the same landmarks on the subject's head are provided to the system with the aid of a specialized tracker that is detected by the camera. Bottom: Functional brain areas can be precisely targeted. Activations are overlaid on the anatomical image, and desired areas are marked and saved. During the session the experimenter can load a pre-defined area to target with TMS. Please click here to view a larger version of this figure.

Figure 4
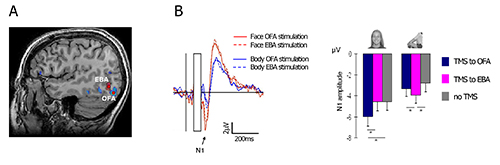
Figure 4. Representative results. Double-pulse TMS was applied either to the right OFA or to the right EBA, at 60 msec and 100 msec after the onset of a face or a headless-body image. A dissociation between the face-N1 and the body-N1 responses was made. (A) The two target areas in a representative subject; (B) Left – double dissociation between the face and the body networks. TMS to the OFA enhanced the N1 response to faces, but not to bodies, relatively to TMS to the EBA. The opposite pattern is shown for headless-body stimuli. Right – N1 peak amplitude for faces and bodies, following OFA stimulation, EBA stimulation, and without TMS stimulation. Error bars denote the SEM. This figures was adapted with permission from Sadeh et al7. Please click here to view a larger version of this figure.

List of Materials

3.0T Signa MRI scanner General Electric
BrainAmp  amplifier  Brain Products GmbH BP-01300
Electrode input box Brain Products GmbH Optional
PowerPack – battery for amplifier Brain Products GmbH BP-02615
BrainCap – 32 flat electrodes on a flexible cap  Brain Products GmbH BP-0300MR Flat electrodes should be used to assure a shorter distance beween coil and scalp. If larger (e.g. pin type) electrodes are used, remove the ones under the coil
TMS Super Rapid2 stimulator Magstim
50mm double coil Magstim
Coil holder  Any mechanical arm or tripod that can hold the coil, be adjusted to the right angle and location, and keep the coil steady during stimulation
Chinrest
Polaris infrared camera Rogue Research Inc
Polaris trackers and pointer tool Rogue Research Inc
BrainSight workstation and software Rogue Research Inc
BrainVision Recorder software Brain Products GmbH BP-00010
MATLAB software The MathWorks Icn.
SPM for Matlab Wellcome Department of Imaging Neuroscience, London, UK 
MarsBar region of interest toolbox for SPM
Psychtoolbox for MATLAB This toolbox and the E-prime software (below) are examples for stimulus presentation software capable of delivering commands to the TMS stimulator and to the EEG recorder with reliable timing
E-Prime software Psychology Software Tools, Inc.

Lab Prep

Transcranial Magnetic Stimulation (TMS) is an effective method for establishing a causal link between a cortical area and cognitive/neurophysiological effects. Specifically, by creating a transient interference with the normal activity of a target region and measuring changes in an electrophysiological signal, we can establish a causal link between the stimulated brain area or network and the electrophysiological signal that we record. If target brain areas are functionally defined with prior fMRI scan, TMS could be used to link the fMRI activations with evoked potentials recorded. However, conducting such experiments presents significant technical challenges given the high amplitude artifacts introduced into the EEG signal by the magnetic pulse, and the difficulty to successfully target areas that were functionally defined by fMRI. Here we describe a methodology for combining these three common tools: TMS, EEG, and fMRI. We explain how to guide the stimulator's coil to the desired target area using anatomical or functional MRI data, how to record EEG during concurrent TMS, how to design an ERP study suitable for EEG-TMS combination and how to extract reliable ERP from the recorded data. We will provide representative results from a previously published study, in which fMRI-guided TMS was used concurrently with EEG to show that the face-selective N1 and the body-selective N1 component of the ERP are associated with distinct neural networks in extrastriate cortex. This method allows us to combine the high spatial resolution of fMRI with the high temporal resolution of TMS and EEG and therefore obtain a comprehensive understanding of the neural basis of various cognitive processes.

Transcranial Magnetic Stimulation (TMS) is an effective method for establishing a causal link between a cortical area and cognitive/neurophysiological effects. Specifically, by creating a transient interference with the normal activity of a target region and measuring changes in an electrophysiological signal, we can establish a causal link between the stimulated brain area or network and the electrophysiological signal that we record. If target brain areas are functionally defined with prior fMRI scan, TMS could be used to link the fMRI activations with evoked potentials recorded. However, conducting such experiments presents significant technical challenges given the high amplitude artifacts introduced into the EEG signal by the magnetic pulse, and the difficulty to successfully target areas that were functionally defined by fMRI. Here we describe a methodology for combining these three common tools: TMS, EEG, and fMRI. We explain how to guide the stimulator's coil to the desired target area using anatomical or functional MRI data, how to record EEG during concurrent TMS, how to design an ERP study suitable for EEG-TMS combination and how to extract reliable ERP from the recorded data. We will provide representative results from a previously published study, in which fMRI-guided TMS was used concurrently with EEG to show that the face-selective N1 and the body-selective N1 component of the ERP are associated with distinct neural networks in extrastriate cortex. This method allows us to combine the high spatial resolution of fMRI with the high temporal resolution of TMS and EEG and therefore obtain a comprehensive understanding of the neural basis of various cognitive processes.

Procedure

Transcranial Magnetic Stimulation (TMS) is an effective method for establishing a causal link between a cortical area and cognitive/neurophysiological effects. Specifically, by creating a transient interference with the normal activity of a target region and measuring changes in an electrophysiological signal, we can establish a causal link between the stimulated brain area or network and the electrophysiological signal that we record. If target brain areas are functionally defined with prior fMRI scan, TMS could be used to link the fMRI activations with evoked potentials recorded. However, conducting such experiments presents significant technical challenges given the high amplitude artifacts introduced into the EEG signal by the magnetic pulse, and the difficulty to successfully target areas that were functionally defined by fMRI. Here we describe a methodology for combining these three common tools: TMS, EEG, and fMRI. We explain how to guide the stimulator's coil to the desired target area using anatomical or functional MRI data, how to record EEG during concurrent TMS, how to design an ERP study suitable for EEG-TMS combination and how to extract reliable ERP from the recorded data. We will provide representative results from a previously published study, in which fMRI-guided TMS was used concurrently with EEG to show that the face-selective N1 and the body-selective N1 component of the ERP are associated with distinct neural networks in extrastriate cortex. This method allows us to combine the high spatial resolution of fMRI with the high temporal resolution of TMS and EEG and therefore obtain a comprehensive understanding of the neural basis of various cognitive processes.

Tags