Science Education
>

Macrophage Cholesterol Depletion and Its Effect on the Phagocytosis of Cryptococcus neoformans

Instructor Prep
concepts
Student Protocol
JoVE Journal
Immunology and Infection
A subscription to JoVE is required to view this content.  Sign in or start your free trial.
JoVE Journal Immunology and Infection
Macrophage Cholesterol Depletion and Its Effect on the Phagocytosis of Cryptococcus neoformans

1. Cholesterol Depletion of J774A.1 Cells with MβCD

  1. In a sterile biosafety cabinet, seed 105 J774A.1 macrophage-like cells per well on a 96-well cell culture plate in 200 μl of Dulbecco’s Modified Eagle Medium (DMEM) supplemented with 10% fetal bovine serum (FBS) and 1% penicillin/streptomycin (P/S). Incubate at 37 °C and 5% CO2 O/N.
  2. Remove media from the cell monolayer and wash the cells twice with 1x phosphate buffered saline (PBS) that has been filtered or autoclaved.
  3. Add 200 μl of MβCD solution at the desired concentration (10 mM or 30 mM in PBS) or 1x PBS as a control and incubate for 30 min at 37 °C with shaking. Remove supernatant and reserve at RT for quantitative analysis with commercially available kit immediately following the procedure.
  4. Wash the cells two to three times with 1x PBS or serum free DMEM and continue with infection or lyse cells by pipetting two to three times with deionized H2O for analysis with thin layer chromatography or with a kit.
    NOTE: Following cholesterol depletion a commercially available cholesterol quantification kit can be used. See materials section for details. Follow manufacturer’s instructions as written.

2. Observation of Cholesterol Content by Thin Layer Chromatography (TLC)

  1. Wash a TLC tank twice with acetone and once with a solution of petroleum ether:diethyl ether:acetic acid (65:30:1 by volume). Saturate the tank with the petroleum ether:diethyl ether:acetic acid (65:30:1 by volume) solution and leave O/N.
    NOTE: Organic solvents should always be used under a fume hood to prevent inhalation of vapor. Gloves and lab coat should be worn at all times. Acetic acid is a strong acid and should be used with caution.
  2. In a sterile biosafety cabinet, seed 106 J774A.1 macrophage-like cells per well on a 6-well cell culture plate in a volume of 5 ml of warm DMEM supplemented with 10% FBS and 1% P/S. Incubate at 37 °C, 5% CO2 O/N.
  3. Deplete macrophages of cholesterol by following steps 1.2 – 1.4, substituting 1 ml for 200 μl where applicable to account for the larger well size.
  4. Add 500 μl of Trypsin-EDTA to each well, incubate for 3 min at 37 °C, and gently scrape cells with a cell scraper.
  5. Transfer into a microfuge tube and add an additional 500 μl of warm DMEM supplemented with 10% FBS and 1% P/S.
  6. Spin the cells for 5 min at 300 x g and remove the supernatant.
  7. Add an additional 500 μl of warm DMEM supplemented with 10% FBS and 1% P/S to the cell pellet and resuspend carefully by pipetting up and down.
  8. Remove 10 μl of cells and count cells on a hemocytometer. Normalize the cell concentrations from each sample and add an equal number of cells to glass tubes.
    NOTE: At this step, one may choose to combine cells from the same treatment groups to obtain a more concentrated final lipid extract.
  9. Centrifuge cells at 300 x g for 5 min at RT and remove media.
  10. Add 2 ml of methanol and vortex. Then, add 1 ml of chloroform and vortex. Check the phase status to make sure the solution in monophasic.
    NOTE: Tubes can be stored at 4 °C O/N.
  11. Centrifuge at 1,700 x g for 10 min at RT and transfer the supernatant to a new tube
  12. Add an additional 1 ml of chloroform followed by 1 ml of dH2O. Vortex twice for 30 sec. Centrifuge at 1,700 x g for 5 min at RT.
  13. Weigh a glass tube on a sensitive balance and use a glass Pasteur pipette to transfer the lower phase into the glass tube of known weight.
  14. Dry down lipids in a centrifugal evaporator until dry (approximately 2 hr). Weigh tube with dried lipids and calculate the dry lipid weight.
    NOTE: Dry lipids can be stored in -20 °C until ready to perform TLC.
  15. Dilute dried lipids in enough chloroform to normalize the concentration of lipid (usually 20 – 50 µl) and load 20 µl of the diluted lipid on a silica TLC plate. Load 20 μg of cholesterol diluted in 20 μl of chloroform as a standard.
  16. Add dried TLC plate to the saturated TLC tank and allow solvent to migrate up to 1 cm before plate edge. Remove TLC plate from tank and allow it to dry about 5 min.
  17. Visualize lipids by placing in an iodine vapor tank to check migration. Remove and allow spots to fade for about 10 – 15 min under the hood.
    NOTE: Iodine is an inhalation hazard. Always use under a fume hood.
  18. Prepare a solution for neutral lipid staining by combining 60 ml of methanol with 60 ml of deionized H2O, 4 ml of sulfuric acid, and 630 mg of manganese chloride.
  19. Carefully and slowly dip the TLC plate into the neutral lipid staining solution in a tray and remove without sloughing off the silica layer.
    NOTE: The neutral lipid staining solution can be reused several times and so it can be retrieved from the tray and placed back in a bottle for later use.
  20. Allow plate to dry under the hood at RT until all bubbles has disappeared. Heat the TLC plate on a heat block set to 160 °C and char to the desired color.
    NOTE: A densitometry program such as Vision Works LS can be used to quantify the charred bands to compare lipid samples.

3. Infection of Macrophages with C. neoformans (H99)

  1. In a sterile biosafety cabinet, seed 105 macrophage-like cells per well on a 96-well cell culture plate in 200 μl of DMEM supplemented with 10% FBS and 1% P/S. Incubate at 37 °C, 5% CO2, 5% CO2 O/N.
    NOTE: Infection can also be done in glass bottomed confocal dishes for easier imaging; all amounts remain the same.
  2. Grow a culture of C. neoformans (H99) by inoculating 10 ml of YNB with one colony obtained from a struck plate and incubating it O/N at 30 °C with shaking.
  3. Wash and count C. neoformans (H99) cells.
    1. Centrifuge C. neoformans O/N culture at 1,700 x g for 10 min at 4 °C.
    2. Remove media and discard. Wash cells with 5 ml of 1x PBS. Centrifuge at 1,700 x g for 10 min at 4 °C.
    3. Remove PBS and wash with 5 ml of filtered 1x PBS. Centrifuge at 1,700 x g for 10 min at 4 °C. Repeat this step 2 more times.
    4. Remove PBS and resuspend in 5 ml of 1x PBS.
    5. Make a serial dilution in PBS to obtain a 1:500 dilution of the washed culture.
      1. Add 100 μl of the original sample to 900 μl of 1x PBS to obtain a 1:10 dilution.
      2. Add 100 μl of 1:10 diluted sample to 900 μl of 1x PBS to obtain a 1:100 dilution.
      3. Add 200 μl of the 1:100 diluted sample to 800 μl of 1x PBS to obtain a 1:500 dilution
    6. Take 10 μl of 1:500 dilution and count on hemocytometer to calculate the number of cells.
  4. Prepare working solution for activating macrophages and opsonizing C. neoformans.
    1. Dilute LPS and IFNγ 100x from stock solutions by adding 10 μl to 990 μl.
      NOTE: LPS and IFNγ are used to enhance phagocytic uptake but are not required for phagocytosis. If there is an interest in fungicidal activity of macrophages, perform activation O/N at 37 °C with shaking prior to infection.
    2. Per sample combine 7.5 μl of diluted LPS, 1.25 μl of diluted IFNγ, 1.25 μl of GXM antibody and the volume of the C. neoformans culture that gives 1.25 x 10⁵ cells. Bring volume up to 250 μl multiplied by number of samples with DMEM supplemented with 10% FBS and 1% P/S.
    3. Vortex and incubate solution for 20 min at 37 °C with shaking.
      NOTE: Cholesterol depletion (steps 1.2 – 1.4) can be done concurrently with the opsonization step. Be sure to treat macrophages prior to combining the working solution, as the opsonized cells should optimally be used no longer than 20 min following the step 3.4.3 incubation.
  5. Infect Macrophages
    1. Wash macrophages twice with serum free DMEM and add 200 μl of opsonized C. neoformans working solution to each well.
    2. Incubate for 2 hr at 37 °C.
  6. Fix and Stain Cells
    1. Remove media and wash cells 2 times with DMEM.
    2. Air dry the cell monolayer for 10 min and add 200 μl of ice cold methanol to fix the cells.
    3. Incubate for 15 min at RT and remove any remaining methanol.
    4. Add 200 μl of 10x Giemsa and incubate for 5 min at RT.
    5. Wash 2 – 3 times with deionized water and dry O/N with cap off.
      NOTE: Imaging can be done the next day or up to a week following staining.
  7. Visualize and Count
    1. Using a microscope, count 300 cells per data point (if there are 2 of the same treatment count 150 per well) and note the number of infected macrophages and number of engulfed Cryptococcus cells.
      NOTE: To ensure even sampling per data point use 2 plates per condition, choose 3 non-overlapping areas per plate and count 50 cells per area.
    2. Calculate phagocytic index by multiplying the percentage of infected macrophages by the mean number of C. neoformans per macrophage. Normalize phagocytic index by expressing values as a percentage of the 1x PBS treated control. After several trials calculate the mean value and the standard deviation of the mean to determine trends in phagocytic index. Use student t-test to determine significance.
    3. Take micrographs of cells at 1,000X or 400X magnification.

4. Trypan Blue Assay

  1. In a sterile biosafety cabinet, seed 106 macrophage-like cells per well on a 6-well cell culture plate in a volume of 5 ml of Dulbecco’s minimal essential medium (DMEM) supplemented with 10% fetal bovine serum and 1% penicillin/streptomycin. Incubate at 37 °C, 5% CO2 O/N.
  2. Deplete macrophages of cholesterol by following steps 1.2 – 1.4 substituting 2 ml for 200 μl where applicable to account for the larger well size.
    NOTE: Be sure to include a control treated with 1x PBS as well as a control that is scraped prior to any treatment.
  3. Add 500 μl of 1x PBS to each well and gently scrape cells with a cell scraper. Transfer into a microfuge tube and suspend the cells by gently pipetting up and down.
  4. Remove 10 μl of cells and stain with 1 μl of 4% Trypan blue.
  5. Count cells on a hemocytometer and calculate viability using the following equation: % viability = [1 – (Blue cells / total cells)] x 100. Normalize values to the control that was untreated. After several trials calculate the mean value and the standard deviation to determine trends in viability. Use student t-test to determine significance.

Macrophage Cholesterol Depletion and Its Effect on the Phagocytosis of Cryptococcus neoformans

Learning Objectives

Cholesterol Depletion

Analysis of the supernatant reserved in step 1.3 of the protocol by following the manufacturer’s instructions in the Amplex Red Cholesterol Assay kit yields an elevated concentration of cholesterol in MβCD treated sample as compared to the 1x PBS control. Depending on cell type and MβCD concentration used cholesterol depletion may vary. For J774 treated with 10 mM MβCD, a depletion of approximately 50% was observed. Depletion can be calculated using values obtained from the supernatant and cell lysate collected in step 1.4 (Figure 1).

Cell lysate analyzed using TLC shows a marked decrease in staining of cholesterol in cells treated with increasing concentration of MβCD (Figure 2A). Densitometry analysis of the TLC shows a similar trend to the quantitative assay (Figure 2B). The Bligh-Dyer method gives a crude extract of total lipids and it is essential to allow for adequate separation of lipids in order to identify the correct band utilizing the cholesterol standard.

Infection

After following the infection procedure, cells remain adhered and intact. Cell morphology remains unchanged between treatment groups. A control group that has not been exposed to C. neoformans serves as a checkpoint (Figure 3). It is possible to obtain suboptimal results and may manifest as lysis of cells and other abnormal morphologies. The most likely cause is contamination of the cell line or reagents used in the procedure. Micrographs of optimally infected cells clearly show C. neoformans engulfed within the mammalian cells. Differences in number of phagocytized yeast may be noted by observation between treatment groups (Figure 4). After calculating phagocytic index from 300 macrophage cells per treatment group a reduction in phagocytic index is found in cholesterol depleted cells (Figure 5). The reduction in the phagocytic index does not appear to be dependent on potential differences in macrophage activation, although they may occur. Performing the infection in the absence of macrophage activators, but after treatment with MCD results in a similar reduction of phagocytic index (data not shown).

Trypan Blue

Trypan Blue staining is used to assess the viability of cells after cholesterol depletion. No change in viability is observed between PBS treated and 10mM MCD treated cells. Viability appears to drop off slightly after treatment with 30 mM MCD, which may be expected due to the approximately 75% depletion in cholesterol (an essential lipid) observed in the densitometry analysis (Figure 6 and Figure 2B).

Figure 1
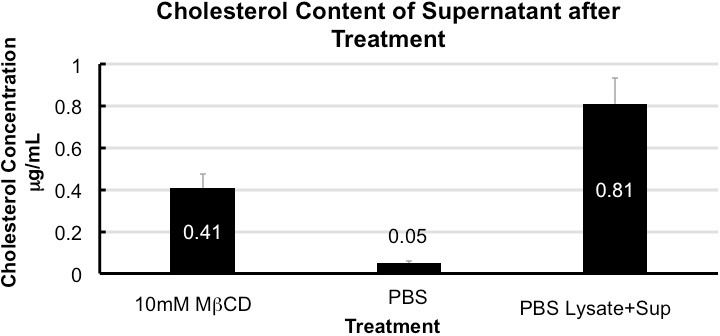
Figure 1. Cholesterol content of supernatant after treatment. Quantification of cholesterol in the supernatant collected from treated cells shows enrichment in MCD when compared to 1x PBS. Cholesterol depletion is 50 ± 5% calculated from total cholesterol in 1x PBS (supernatant + cell lysate). Error bars show standard deviation (n = 5).

Figure 2
Figure 2. TLC of cholesterol in cell lysate and densitometry. Image of developed TLC plate visualized with MnCl2 charring. A marked decrease in cholesterol is seen after MβCD treatment (A). Densitometry analysis of bands as compared to the PBS treated control (shown as 100%) confirms trend found in Cholesterol quantification assay (B). Please click here to view a larger version of this figure.

Figure 3
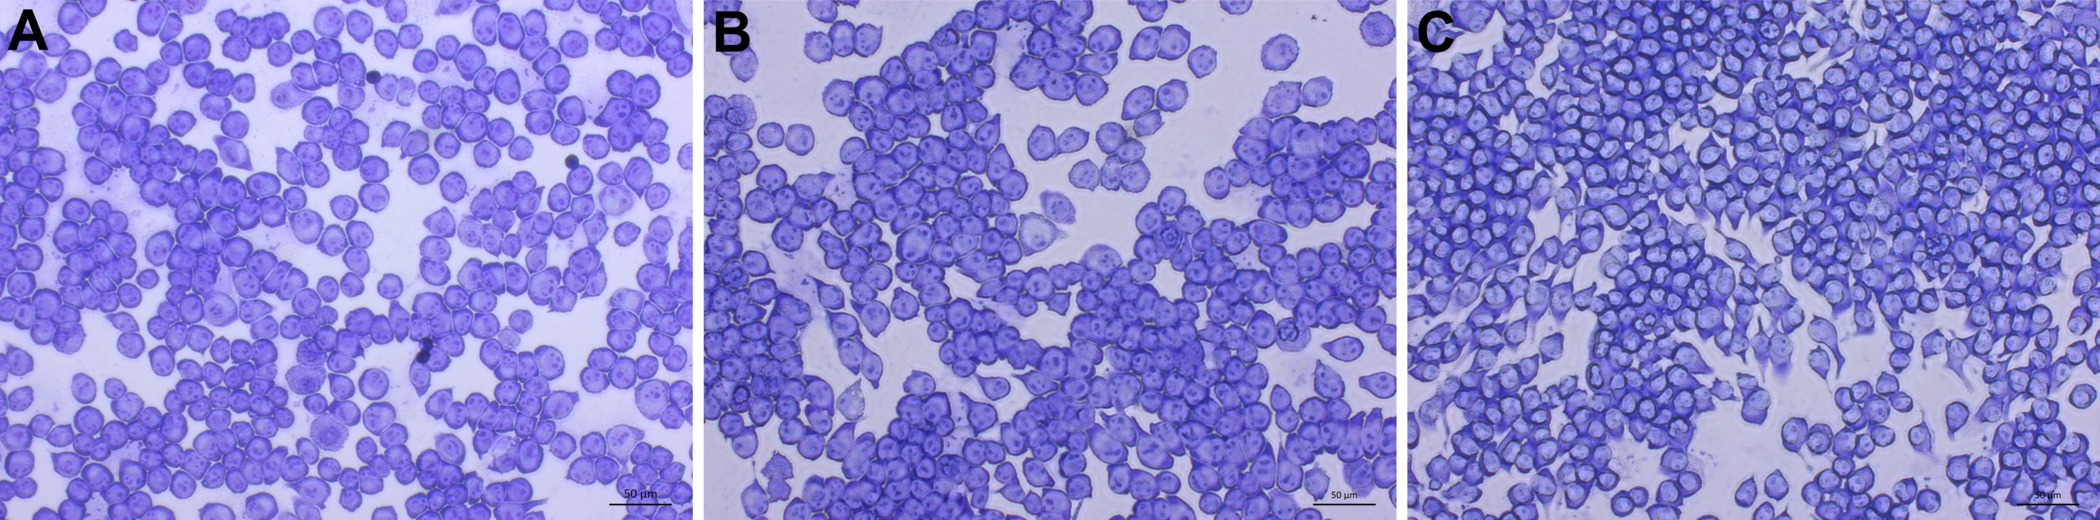
Figure 3. Uninfected control micrographs of treated J774 macrophages. Images of uninfected J774 cells taken at 200X magnification. Scale bar is 50 μm. 1x PBS (A), 10 mM MβCD (B), and 30 mM MβCD (C) treated cells show no change. Please click here to view a larger version of this figure.

Figure 4
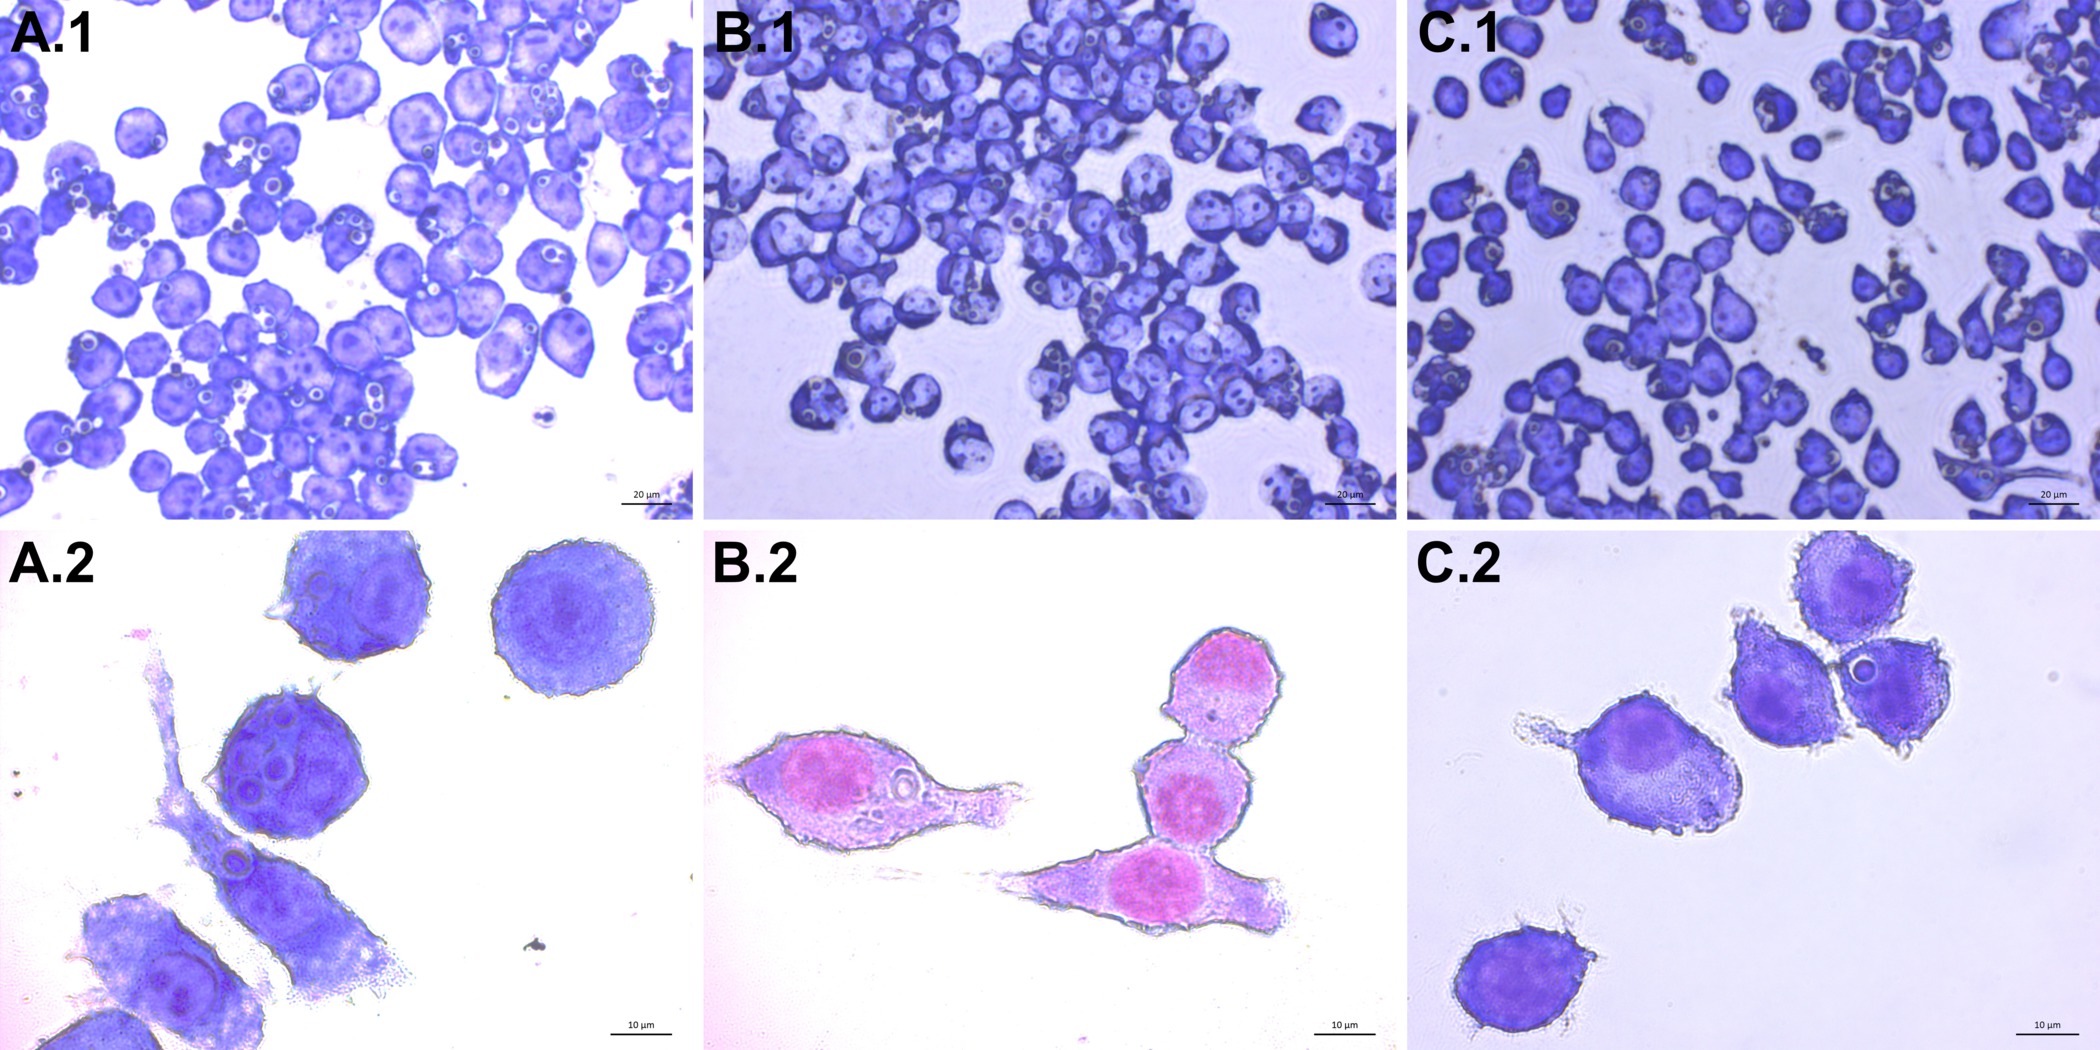
Figure 4. Infection of J774 macrophages with C. neoformans. Images of infected J774 cells taken at 400X (top row A.1 – C.1) and 1,000X (bottom row A.2 – C.2) magnification are shown. Internalized C. neoformans cells appear as blue-violet spheres with a lighter ring surrounding them. Cells treated with 1x PBS (A), 10 mM MβCD (B), and 30 mM MβCD (C) show differences in C. neoformans uptake. Please click here to view a larger version of this figure.

Figure 5
Figure 5. Phagocytic index. Phagocytic index is shown with respect to the control group that was treated with PBS (Marked at 100 for comparison). Phagocytic index was reduced by 25% by 10 mM MβCD treatment and by almost 55% by 30 mM treatment. Error bars show standard deviation of the mean (n = 4).

Figure 6
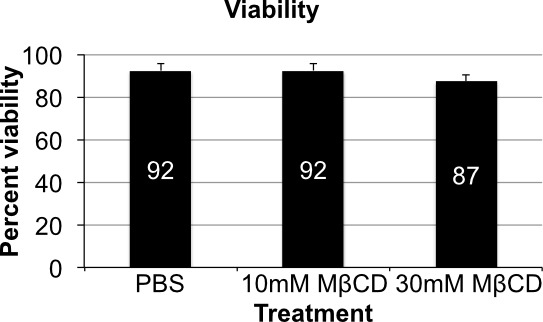
Figure 6. Cell viability. Variations in cell viability by trypan blue assay show little variation when comparing all three treatment groups. There is a slight drop off in viability in the 30 mM MβCD treatment group, which can be expected from depletion of such a major component of the membrane. Error bars show standard deviation (n = 4).

List of Materials

Name of Reagent/ Equipment Company Catalog Number Comments/Description
Class II type A2 Biosafety Cabinet Labconco 3460009
J774A.1 cell line ATCC TIB-67 Arrives Frozen. See ATCC instructions for culturing.
Dulbecco’s Modified Eagle Medium Gibco 11995-065 Store at 4 °C and warm to 37 °C prior to use
HI Fetal Bovine Serum Performance Plus Gibco 10082-147 Keep frozen at -20 °C and thaw before adding to DMEM
Penicillin-Streptomycin (10,000 U/mL) Gibco 15140-122 Used to suplement DMEM
Isotemp Cell culture incubator Fisher Scientific Model # 3530
96-Well culture dish Corning Inc. Costar 3595
10x Phosphate Buffered Saline Fisher Scientific BioReagents BP3994 Dilute to 1x and filter or autoclave prior to use.
Methyl-β-Cyclodextrin Sigma Life Science C4555-10G Dissolve in 1x PBS to make solutions of 10mM and 30mM concentrations
Orbital Shaker Labline
Amplex Red Cholesterol Assay Kit Life Technologies Molecular Probes A12216 All reagents for Cholesterol Assay are contained within the kit. Follow Manufacturer instructions.
96-Well Black Assay plate Corning Inc. Costar 3603
FilterMax microplate reader Molecular Devices Model F5
TLC Chamber Sigma-Aldrich Z126195-1EA
Chloroform Sigma-Aldrich 650498-4L
Methanol Sigma-Aldrich 34860-2L-R
TLC Paper Whatman 3030917 Cut down to size needed for TLC tank
Fume Hood Any fume hood that complies with AIHA/ANSI Standards 
6-Well Plate Corning Inc. Costar 3506
Trypsin-EDTA Gibco 25300-054
Cell Scraper Corning Inc. Costar 3010
Hemocytometer  Hausser Scientific 1490
Centrifuge Beckman Coulter Model Alegra x-30R
Votex Mixer Fisher Scientific 12-812
Balance Mettler Toledo Model # MS104S Meaures down to .1 mg
Glass Pasteur Pipette Fisherbrand 13-678-20A
Cholesterol Avanti Polar Lipids 700000
SpeedVac Concentrator Thermo Scientific Model # SPD2010 
Petroleum Ether Fisher Scientific E139-1 
Diethyl Ether Sigma-Aldrich 309966 
Acetic Acid Sigma-Aldrich 320099
TLC Silica Gel 60 with concentrating zone Analytical Chromatograhy Millipore 1.11845.0001
Iodine Chips Sigma-Aldrich 376558-50G
Sulfuric Acid Sigma-Aldrich 320501 
Manganese Chloride Sigma-Aldrich 244589
UVP EC3 Imaging System Ultra-Violet Products Ltd. Use the Vision Works LS software for densitometry analysis
Glass Bottom Confocal Dish MatTek P35G-1.5-10C www.glassbottomdishes.com
Cryptococcus neoformans (H99) Obtained from Duke University Medical Center
YNB BD 239210 See manufacturer for preparation instructions. Use a Glucose concentration of 20 g/L.
Lipopolysaccharide Sigma L4391-1MG Dissolve in 1x PBS to make 1mg/mL stock. Store at -20 °C.
Interferon gamma Sigma I4777 Dissolve in 1x PBS to make .1 mg/mL stock solution
Glucuronoxylomannan antibody (anti-GXM) Gift from Arturo Casadevall's Lab concentration is 1.98 mg/mL
Giemsa MP Biomedicals 194591 Dissolve .8 g of Giemsa in 25 mL of Glycerol and heat to 60 °C for 1 hour. Add 25 mL of methanol to the solution and allow to age at room temperature for at least 1 month.
Microscope Zeiss Observer.D1 microscope with AxioCam MRm for taking images

Lab Prep

Cryptococcosis is a life-threatening infection caused by pathogenic fungi of the genus Cryptococcus. Infection occurs upon inhalation of spores, which are able to replicate in the deep lung. Phagocytosis of Cryptococcus by macrophages is one of the ways that the disease is able to spread into the central nervous system to cause lethal meningoencephalitis. Therefore, study of the association between Cryptococcus and macrophages is important to understanding the progression of the infection. The present study describes a step-by-step protocol to study macrophage infectivity by C. neoformansin vitro. Using this protocol, the role of host sterols on host-pathogen interactions is studied. Different concentrations of methyl–cyclodextrin (MCD) were used to deplete cholesterol from murine reticulum sarcoma macrophage-like cell line J774A.1. Cholesterol depletion was confirmed and quantified using both a commercially available cholesterol quantification kit and thin layer chromatography. Cholesterol depleted cells were activated using Lipopolysacharide (LPS) and Interferon gamma (IFNγ) and infected with antibody-opsonized Cryptococcus neoformans wild-type H99 cells at an effector-to-target ratio of 1:1. Infected cells were monitored after 2 hr of incubation with C. neoformans and their phagocytic index was calculated. Cholesterol depletion resulted in a significant reduction in the phagocytic index. The presented protocols offer a convenient method to mimic the initiation of the infection process in a laboratory environment and study the role of host lipid composition on infectivity.

Cryptococcosis is a life-threatening infection caused by pathogenic fungi of the genus Cryptococcus. Infection occurs upon inhalation of spores, which are able to replicate in the deep lung. Phagocytosis of Cryptococcus by macrophages is one of the ways that the disease is able to spread into the central nervous system to cause lethal meningoencephalitis. Therefore, study of the association between Cryptococcus and macrophages is important to understanding the progression of the infection. The present study describes a step-by-step protocol to study macrophage infectivity by C. neoformansin vitro. Using this protocol, the role of host sterols on host-pathogen interactions is studied. Different concentrations of methyl–cyclodextrin (MCD) were used to deplete cholesterol from murine reticulum sarcoma macrophage-like cell line J774A.1. Cholesterol depletion was confirmed and quantified using both a commercially available cholesterol quantification kit and thin layer chromatography. Cholesterol depleted cells were activated using Lipopolysacharide (LPS) and Interferon gamma (IFNγ) and infected with antibody-opsonized Cryptococcus neoformans wild-type H99 cells at an effector-to-target ratio of 1:1. Infected cells were monitored after 2 hr of incubation with C. neoformans and their phagocytic index was calculated. Cholesterol depletion resulted in a significant reduction in the phagocytic index. The presented protocols offer a convenient method to mimic the initiation of the infection process in a laboratory environment and study the role of host lipid composition on infectivity.

Procedure

Cryptococcosis is a life-threatening infection caused by pathogenic fungi of the genus Cryptococcus. Infection occurs upon inhalation of spores, which are able to replicate in the deep lung. Phagocytosis of Cryptococcus by macrophages is one of the ways that the disease is able to spread into the central nervous system to cause lethal meningoencephalitis. Therefore, study of the association between Cryptococcus and macrophages is important to understanding the progression of the infection. The present study describes a step-by-step protocol to study macrophage infectivity by C. neoformansin vitro. Using this protocol, the role of host sterols on host-pathogen interactions is studied. Different concentrations of methyl–cyclodextrin (MCD) were used to deplete cholesterol from murine reticulum sarcoma macrophage-like cell line J774A.1. Cholesterol depletion was confirmed and quantified using both a commercially available cholesterol quantification kit and thin layer chromatography. Cholesterol depleted cells were activated using Lipopolysacharide (LPS) and Interferon gamma (IFNγ) and infected with antibody-opsonized Cryptococcus neoformans wild-type H99 cells at an effector-to-target ratio of 1:1. Infected cells were monitored after 2 hr of incubation with C. neoformans and their phagocytic index was calculated. Cholesterol depletion resulted in a significant reduction in the phagocytic index. The presented protocols offer a convenient method to mimic the initiation of the infection process in a laboratory environment and study the role of host lipid composition on infectivity.

Tags