Science Education
>

Imaging the Intracellular Trafficking of APP with Photoactivatable GFP

Instructor Prep
concepts
Student Protocol
JoVE Journal
Biology
A subscription to JoVE is required to view this content.  Sign in or start your free trial.
JoVE Journal Biology
Imaging the Intracellular Trafficking of APP with Photoactivatable GFP

1. Cell Plating and Transfection

  1. In a cell culture hood, plate ~300,000 to ~500,000 SN56 cells (a kind gift of Dr. Jane Rylett) on a 35 mm glass-bottom confocal dish and cover with pre-transfection media (Dulbecco’s Modified Eagle Medium, DMEM, supplemented with 10% FBS).
  2. Incubate cells overnight at 37 °C in a 5% CO2 incubator to proliferate.
    Note: Cells should be approximately 50%-70% confluent before transfection.
  3. In a cell culture hood, transfect cells with plasmids expressing a fluorescent protein tagged TGN marker (Galactosyl transferase coupled to Cyan Fluorescent Protein, GalT-CFP), a fluorescent protein tagged compartment marker (here, lysosome associated membrane protein 1, LAMP1, tagged with mRFP), and the protein of interest tagged with paGFP (βAPP-paGFP). (These constructs have previously been described 30)
  4. Incubate cells with transfection reagent and plasmid DNA for 24 hr at 37 °C in a 5% CO2 incubator. Use a ratio of ~2 µg of DNA to 5 µl of transfection agent (e.g. Lipofectamine 2000) to best balance cytotoxicity and transfection efficiency. Actual concentrations may need to be optimized for different plasmids. In the experiments described here, use 1 µg/confocal dish of βAPP-paGFP, 0.3 µg/confocal dish of LAMP1-mRFP, and 0.2 µg/confocal dish of GalT-CFP.
    Note: The amount of plasmid used will depend on transfection efficiency.
  5. For neuronal cell lines: After step 1.4, in a cell culture hood, remove pre-transfection media and differentiate SN56 cells in 2 ml DMEM supplemented with 0.1% penicillin/streptomycin with 1 mM dibutyryl cyclic AMP (dbcAMP) for 24 hr.

2. Microscope Stage Preparation

  1. Pre-warm phosphate-buffered saline (PBS) and Hank’s Balanced Salt Solution (HBSS) to 37 °C. Warm-up microscope stage before imaging to 37 °C.
  2. Wash cells twice with PBS, to remove differentiation media and replace with 2 ml of HBSS at 37 °C. Place cells on microscope stage warmed to 37 °C.
    Note: Cells are viable for approximately 1.5-2 hr in HBSS.
  3. Allow 5-10 min for the confocal plate temperature to equilibrate with the microscope stage.

3. Photo-activation of ROIs over the Golgi

  1. With the microscope eyepiece, find cells transfected with GalT-CFP, LAMP1-mRFP, and βAPP-paGFP.
    1. Use an oil-immersion lens with high magnification (i.e. 63X or 100X). For visual conformation of fluorescence, use a filter set capable of visualizing FITC (for CFP and GFP fluorescence) and rhodamine (for mRFP fluorescence).
  2. Set the confocal slice for each channel to 1 µm. Take a low-resolution image.
  3. Crop to image only the cell of interest.
  4. Using the adjustment knob, manually set the focal plane to the middle of the cell. This is typically the part of the cell where the nucleus is the largest.
  5. Draw 3-5 circular Regions of Interests (ROIs) within the TGN (GalT-CFP fluorescence).
    1. To draw ROIs (i.e. in the Zeiss LSM program), select the ‘Edit ROI’ button in the command console.
    2. Select the circular ROI button.
    3. Click and drag over GalT-CFP positive regions of the cell.
      Note: The photo-bleaching packages for many microscopes have this capability.
  6. Take an image of the cell with the overlaid ROIs. Save a copy of the ROIs for later reference.
    1. To save the ROIs to the image, select the ‘Macro’ button.
    2. Press the ‘Load’ button to start the ‘CopyRoisToOverlay’ (file path: c:/AIM/Macros/AdvancedTimeSeries/Utility.lvb).
      Note: A confocal microscope equipped with 475-525 nm (CFP) band pass (BP), a 500-530 nm BP (GFP), and a 560 nm long pass (LP) filter sets are required. An argon laser for 458 nm and 488 nm emission and a HeNe laser for 540 nm emission is also required.
  7. Set-up the microscope for a bleach time course.
    1. Set the laser diode (25 mW 405 nm laser) to maximum power.
      Caution: Excessive photo-activation could lead to photo-toxicity or damage to cellular membranes. Use eye protection to avoid retinal damage.
    2. Set-up the microscope for 120 cycles of imaging.
      Note: One imaging cycle consists of bleaching within the ROIs and imaging of the entire cell. This is a bleach time course.
    3. Set the microscope to bleach (photo-activate) only the ROIs for 20-30 iterations after every image. The time to image and bleach an image will vary. Set a time delay between images so each cycle is approximately 30 sec.
      Note: The imaging portion of each cycle takes approximately 15-30 sec depending on image size. The bleaching for each ROI is about 50 msec. Bleaching of all 4 ROIs for 20 iterations will take 4 sec at the end of each bleach/image cycle.
  8. Start the bleach time course.
  9. Turn off the bleaching after 15 min (30 cycles of imaging and bleaching), but continue capturing images of the cell.
    Note: Time 0 to 15 min is the ‘pulse’ period.
  10. Continue capturing images for 45 min (without bleaching), to follow the clearance of βAPP-paGFP.
    Note: Time 15 to 45 min is the ‘chase’ period.
  11. Using the analysis method described in step 6, co-localize the protein of interest (here, βAPP-paGFP) with the compartment of interest (here, LAMP1-mRFP) by making surfaces to each channel.

4. Determine the Downstream Compartment

  1. To determine if lysosomes (in these experiments) are the final compartment, add membrane-permeable protease inhibitors to cause proteins to accumulate in the lysosome.
    1. For βAPP, use 0.5 µM L685, 458 (specific γ-secretase inhibitor) overnight or 100 µM chloroquine (deacidifies lysosomes) for 30 min before imaging.
  2. Find cells and photoactivate as in step 3.1 – 3.8.
  3. Image the cell for an additional 45-min (without photo-activation) to determine where βAPP-paGFP accumulates in absence of cleavage.
  4. Analyze the delivery of protein to lysosomes (or other downstream compartment) and subsequent clearance according to the method described in step 6.

5. Ensure Accuracy of Photo-activation within the Golgi

  1. Warm-up HBSS to 37 °C.
  2. Prepare a 2 ml solution, for every confocal plate to be imaged, of 66 µM nocodazole (treatment) or DMSO (control) in HBSS.
    1. For one confocal plate, pipette 2 ml of 37 °C HBSS and add 7.96 µl of nocodazole from a 16.60 mM nocodazole stock.
    2. As a control solution, pipette 2 ml of 37 °C HBSS into a 2 ml tube and add 7.96 µl of DMSO.
  3. Incubate cells in HBSS with nocodazole or DMSO for 5 min before imaging.
  4. Find cells as in step 3.1.
  5. Before photoactivation, prepare the microscope to take a Z-stack after the photo-activation period.
    1. Click on the ‘Z Stack’ button. Start scanning using Fast XY.
    2. Adjust the focal plane with the microscope adjustment knob to the top of the cell. Press ‘Mark First’ to set the first position in the stack.
    3. Adjust the focal plane with the microscope adjustment knob to the bottom (closest to the glass) of the cell. Press ‘Mark Last’ to set the last position in the stack.
    4. In the Z stack panel, press the ‘Z sectioning’ button. Set the ‘Interval’ to 1 µm.
      Note: For a higher spatial resolution stack a smaller stack interval, but more images will need to be taken lengthening the imaging period for the stack.
  6. Bleach the cells, as described in step 3.7-3.8. Photo-activate and image from 0 min to 15 min (30 frames).
  7. Stop imaging after 30 frames. Immediately save an image of the video.
    Caution: Some microscopes may overwrite first video if it is not saved before starting a second imaging sequence.
  8. After saving the video, immediately acquire a Z-stack, using the parameters from step 5.5.
  9. Co-localize βAPP-paGFP with GalT-CFP (or other Golgi marker), as described in step 6.
    Note: CFP photobleaches rapidly and may not be visible by the end of the imaging period. Colocalization may not be possible with GalT-CFP. If colocalization is required, use mRFP to tag GalT.

6. Vesicle Filtering and Colocalization

  1. Use an analysis program (e.g. Imaris) to make surfaces of the compartment (e.g. LAMP1-mRFP) and a protein of interest (e.g. βAPP-paGFP).
  2. Enter the ‘Surpass’ section of the analysis program by clicking on the Surpass button on the top menu bar.
  3. Select the Surface wizard button at the top of the left most panel (5th button from the left).
  4. Select a channel to filter vesicles (i.e. βAPP-paGFP fluorescence, protein of interest).
  5. Perform background subtraction by submitting the diameter of the largest vesicle in the field to the wizard and press next. The analysis program automatically selects — based on a threshold derived from the largest vesicle in the field — an area in the channel of interest.
    1. Manually adjust the threshold background to refine the selection if needed.
  6. At the bottom of the Threshold selection screen, check the ‘Split touching objects’ option to separate the combined Surfaces.
    Note: If many vesicles are closely grouped together, the analysis program will group these objects under one surface.
    1. Choose 10-15 representative vesicles and calculate the average vesicle diameter and enter the result into the wizard.
  7. Refine the selected seed points by increasing or decreasing the threshold on ‘Quality’ (intensity of the channel in the middle of each spot).
    Note: Surfaces of the channel of interest will be created. Further refinement of the selected surfaces can be performed at this point. Threshold vesicles based on the number of pixels in each vesicle.
  8. Mask the original channel with this surface. To mask, select the 4th tab from the left in the surface creation wizard (pencil).
  9. Select ‘Mask All’. A new channel with the vesicles of interest will be created.
    Note: During the mask process, an option to duplicate the original channel is offered. Select this option if the original data needs to be saved.
  10. Repeat steps 6.1 through 6.7 for the unfiltered channel (i.e. LAMP1 mRFP, compartment).
  11. At the top tool bar, select the colocalization tool.
    1. In the top panel, as the histograms of the channels to be colocalized appear, select the recently created masked channels.
    2. Select all of available data. There are dark pixels that are sometimes present after analysis. Do not select these pixels in the histogram, they will skew the results.
    3. In the far right panel, select ‘Build Coloc Channel’. This creates a new channel containing only the colocalized pixels. The data will be in the same panel under the ‘Channel Statistics’ button. The data can be exported as a .CSV file.
    4. Use the ‘Percent of Material colocalized’ statistic. This option takes into account the intensity of the pixels and size of the object.

Imaging the Intracellular Trafficking of APP with Photoactivatable GFP

Learning Objectives

Typical results show βAPP leaving the TGN and appears to traffic rapidly to LAMP1 (Figure 1a and b). During the photo-activation period, vesicles can be seen departing the Golgi destined for lysosomes (Figure 1b). Without inhibitor treatment, paGFP fluorescence will be visible in lysosomes while there is photo-activation in the TGN. After stopping photoactivation, the βAPP-paGFP is rapidly cleared from the lysosome (compare Figure 1a to 1b). Treatment with nocodazole leads to the accumulation of APP within the GalT-CFP labeled compartments and prevents trafficking to lysosomes (Figure 1c).

The Swedish mutation of APP (APPsw) increases the rate of β-cleavage by 10-fold 34. With rapid cleavage of βAPPsw-paGFP, the paGFP fluorescence appears as a diffuse fluorescence signal in the cytosol. Presumably this is the result of rapid βAPP cleavage by γ-secretase liberating the C-terminal paGFP in to the cytoplasm (Figure 2). In the presence of γ-secretase inhibitor, βAPP accumulates within lysosomes.

After delivery of βAPP to the lysosome, the paGFP fluorescence is cleared rapidly. The short residence time could be the result of trafficking from the lysosome to another compartment. Conversely, cleavage of βAPP by γ-secretase would be expected to lead to diffusion of paGFP fluorescence from the lysosomal membrane (Figure 3a). The diffuse fluorescence is more difficult to detect by confocal microscopy. To determine whether βAPP is delivered to another compartment or cleared, SN56 cells were treated with a specific inhibitor against γ-secretase (L685, 458) or an alkalinizing agent (chloroquine). The addition of either L685, 458 or chloroquine resulted in APP accumulation in the lysosome (Figure 3b and c).

It is commonly accepted that APP is delivered to the cell-surface before being endocytosed and processed in endosomes and lysosomes 35. However, in our untreated cells, cell-surface βAPP could not be detected by confocal microscopy. Photo-activated βAPP may not be concentrated in a specific region of plasma membrane. Instead, there may be a diffuse fluorescence across the large surface area of the plasma membrane. Interestingly, γ-secretase inhibitor treatment leads to detectable βAPP-paGFP at the cell surface (Figure 3b). γ-secretase inhibitor treatment may route more βAPP to the cell surface, in addition to inhibiting enzyme function. Therefore, the large surface area of the plasma membrane spreads paGFP over a larger area and makes detection difficult, although the protein is trafficked to the compartment.

Figure 1
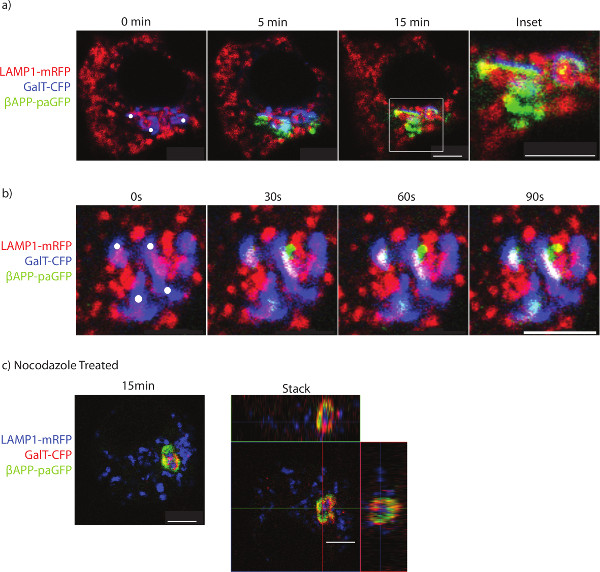
Figure 1. Imaging the trafficking of APP to lysosomes. SN56 cells were transfected with LAMP1-mRFP, GalT-CFP, and βAPP-paGFP. a) The cell was accurately photo-activated within ROIs placed over the Golgi (ROIs denoted by white circles). The cell was alternatively photo-activated and imaged for 15 min to determine βAPP-paGFP trafficking. Inset shows trafficking within the perinuclear area from Golgi to lysosomes. Co-localized pixels appear yellow. b) The trafficking of a vesicle containing βAPP-paGFP to the lysosome. Yellow pixels denote LAMP1 and βAPP-paGFP colocalization. c) SN56 cells were treated with nocodazole before imaging to prevent βAPP-paGFP egress from the TGN. A representative image taken from the end of the photo-activation period. In the right panel, a Z-stack of the same cell taken immediately after photo-activation. The GalT-CFP has been false colored red to improve visualization of colocalized GalT-CFP and βAPP-paGFP. Yellow pixels denote colocalization between GalT-CFP and βAPP-paGFP. Scale bars represent 5 µm. Please click here to view a larger version of this figure.

Figure 2
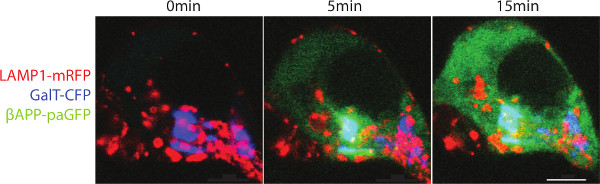
Figure 2. Trafficking of βAPPsw-paGFP. SN56 cells were transfected with LAMP1-mRFP, GalT-CFp and βAPPsw-paGFP (βAPP with the familial Swedish mutation). The Swedish mutation increases the rate that APP is cleaved. Cells were alternatively within the Golgi photo-activated and imaged. A diffuse fluorescence can be seen after paGFP is detached from the lysosomal membrane to diffuse into the cytoplasm. Scale bar represents 5 µm. Please click here to view a larger version of this figure.

Figure 3
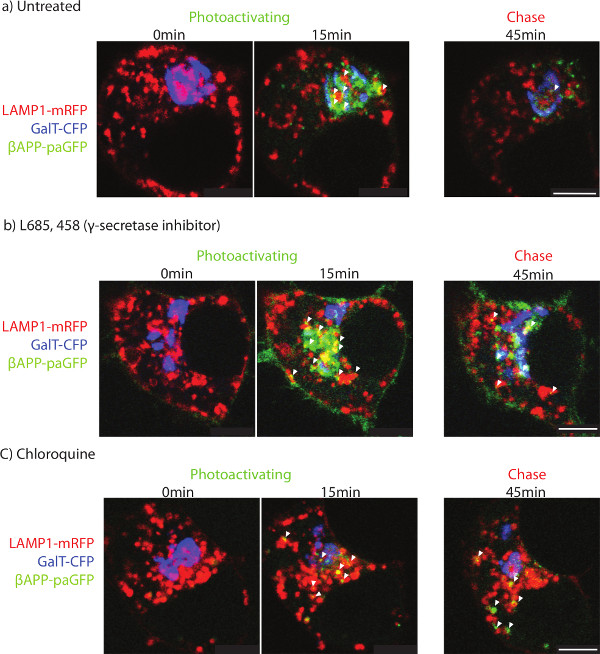
Figure 3. Determining the terminal organelle. SN56 cells were transfected with LAMP1-mRFP, GalT-CFP and βAPP-paGFP. After photo-activation, cells were followed for an additional 45 min. The two left-most panels show the cells before photoactivation (left-most) and 15 min after photoactivation (middle). The panel on the far right shows APP fluorescence after 45 min of total imaging in a) untreated, b) γ-secretase inhibitor treated, or c) chloroquine treated. Arrowheads point to APP co-localized with LAMP1 after 45 min of imaging. Scale bars represent 5 µm. Please click here to view a larger version of this figure.

List of Materials

35-mm glass bottom culture dishes  Matek P-35G-1.5-20-C
Dulbecco's Phosphate Buffered Saline Life Technologies 14190-144
Hanks Balanced Salt Solution Life Technologies 14025-092
Lipofectamine 2000 Life Technologies 11668019
Dulbecco's Modified Eagle Medium Life Technologies 11995-092
Penicilin/Streptomycin Life Technologies 15140-122
dibutyrl cyclic AMP Sigma  D0627
Heat in activated Fetal Bovine Serum Life Technologies 10082147
Heated Microscopy stage insert P PeCon GmbH
Tempcontrol 37–2 digital 2-channel PeCon GmbH
Zeiss LSM-510 META laser- scanning microscope  Carl Zeiss with laser diode, argon laser, and HeNe1 laser
Zeiss 63× 1.4 numerical aperture oil immersion lens  Carl Zeiss
L685, 458  EMD Millipore 565771 dissolved in DMSO
cholorquine  Sigma C6628  dissolved in water
Nocodazole Sigma M1404 dissolved in DMSO
Dimethyl sulphoxide  Sigma 472301
Imaris  Bitplane with colocalization package 

Lab Prep

Beta-amyloid (Aβ) is the major constituent of senile plaques found in the brains of Alzheimer’s disease patients. Aβ is derived from the sequential cleavage of Amyloid Precursor Protein (APP) by β and γ-secretases. Despite the importance of Aβ to AD pathology, the subcellular localization of these cleavages is not well established. Work in our laboratory and others implicate the endosomal/lysosomal system in APP processing after internalization from the cell surface. However, the intracellular trafficking of APP is relatively understudied.

While cell-surface proteins are amendable to many labeling techniques, there are no simple methods for following the trafficking of membrane proteins from the Golgi. To this end, we created APP constructs that were tagged with photo-activatable GFP (paGFP) at the C-terminus. After synthesis, paGFP has low basal fluorescence, but it can be stimulated with 413 nm light to produce a strong, stable green fluorescence. By using the Golgi marker Galactosyl transferase coupled to Cyan Fluorescent Protein (GalT-CFP) as a target, we are able to accurately photoactivate APP in the trans-Golgi network. Photo-activated APP-paGFP can then be followed as it traffics to downstream compartments identified with fluorescently tagged compartment marker proteins for the early endosome (Rab5), the late endosome (Rab9) and the lysosome (LAMP1). Furthermore, using inhibitors to APP processing including chloroquine or the γ-secretase inhibitor L685, 458, we are able to perform pulse-chase experiments to examine the processing of APP in single cells.

We find that a large fraction of APP moves rapidly to the lysosome without appearing at the cell surface, and is then cleared from the lysosome by secretase-like cleavages. This technique demonstrates the utility of paGFP for following the trafficking and processing of intracellular proteins from the Golgi to downstream compartments.

Procedure

Beta-amyloid (Aβ) is the major constituent of senile plaques found in the brains of Alzheimer’s disease patients. Aβ is derived from the sequential cleavage of Amyloid Precursor Protein (APP) by β and γ-secretases. Despite the importance of Aβ to AD pathology, the subcellular localization of these cleavages is not well established. Work in our laboratory and others implicate the endosomal/lysosomal system in APP processing after internalization from the cell surface. However, the intracellular trafficking of APP is relatively understudied.

While cell-surface proteins are amendable to many labeling techniques, there are no simple methods for following the trafficking of membrane proteins from the Golgi. To this end, we created APP constructs that were tagged with photo-activatable GFP (paGFP) at the C-terminus. After synthesis, paGFP has low basal fluorescence, but it can be stimulated with 413 nm light to produce a strong, stable green fluorescence. By using the Golgi marker Galactosyl transferase coupled to Cyan Fluorescent Protein (GalT-CFP) as a target, we are able to accurately photoactivate APP in the trans-Golgi network. Photo-activated APP-paGFP can then be followed as it traffics to downstream compartments identified with fluorescently tagged compartment marker proteins for the early endosome (Rab5), the late endosome (Rab9) and the lysosome (LAMP1). Furthermore, using inhibitors to APP processing including chloroquine or the γ-secretase inhibitor L685, 458, we are able to perform pulse-chase experiments to examine the processing of APP in single cells.

We find that a large fraction of APP moves rapidly to the lysosome without appearing at the cell surface, and is then cleared from the lysosome by secretase-like cleavages. This technique demonstrates the utility of paGFP for following the trafficking and processing of intracellular proteins from the Golgi to downstream compartments.

Tags