Science Education
>

Through the Looking Glass: Time-lapse Microscopy and Longitudinal Tracking of Single Cells to Study Anti-cancer Therapeutics

Instructor Prep
concepts
Student Protocol
JoVE Journal
Medicine
A subscription to JoVE is required to view this content.  Sign in or start your free trial.
JoVE Journal Medicine
Through the Looking Glass: Time-lapse Microscopy and Longitudinal Tracking of Single Cells to Study Anti-cancer Therapeutics

 The following protocol uses parameters defined by the experiments in Figures 4 and 6 regarding acquisition settings and experimental conditions. Many of these parameters can be modified to fit other experiments (i.e., exposure times, binning, fluorescent channels, etc.). All procedures must adhere to institutional guidelines and regulations and be approved by the institutional biosafety committee. Microscope manufacturer websites contain excellent information for live cell imaging.

1. Microscopes and Imaging Software

  1. Perform live cell imaging on a wide variety of inverted microscopes. The most common microscopes are widefield epifluorescence and spinning-disc confocal. Here, use an automated and motorized widefield epifluorescence microscope with 200 watt metal halide light source.
  2. Obtain a stage-top or microscope environmental chamber. Here, use a stage-top environmental chamber.
  3. Use commercial software to operate microscopes with utilities to execute time-lapse microscopy.
  4. Use commercially available software or ImageJ for image analysis. Many other analysis tools are available commercially, and there are custom-made programs many of which have been published8,18.

2. Visualizing Cellular Processes and Phenotypic Responses

  1. Visualize cells with brightfield microscopy. Differential interference contrast and phase contrast alone can be very informative to study responses to anti-cancer drug responses. These processes can include mitosis, cell motility and apoptosis.
  2. Visualize cell structures, organelles and processes with fluorescent biosensors. Fluorescent probes are informative in tracking specific subcellular processes. These can include microtubule dynamics, mitochondrial and endoplasmic reticulum dynamics, protein accumulation and localization, and molecular signaling (e.g., phosphorylation, calcium).

3. Preparation of Samples

  1. Grow cells in cell culture certified dishes in a standard, humidified cell culture incubator (e.g., 37 oC, 5% CO2, 80% relative humidity).
    1. Grow HT1080 cells in MEM with EBSS. Supplement the media with 10% v/v FBS, 1% v/v Pen/Strep, 1% v/v sodium pyruvate and 1% v/v non-essential amino acids.
  2. Two days prior to imaging, plate 50,000 HT1080 FUCCI cells into 3 wells of a 12-well #1.5 glass bottom dish in a certified sterile laminar-flow hood. Adjust the number of cells plated to achieve ~60% confluence for the start of the experiment. Depending on the cell line and nature of experiment the cell density may be less.
    Note: Cell density may have profound influence on the growth of the cell line and on the experimental results. Count cells to minimize experiment-to-experiment variability due to density.
    1. Depending on the environmental chamber and the necessary conditions for the experiment, plate cells in single well dishes (typically 35- or 60-mm), 4 well 35-mm dishes, 6-, 12- or 24-well cell culture plates, or coverslip slides in various formats. Use glass-bottom plates with #1.5 glass as most objective lenses are optimized for this thickness of glass, and imaging through cell culture plastic is very poor.
      Note: Some cell lines do not grow and survive on glass. In these cases, the glass can be coated in order to enhance cell adherence (e.g., poly-lysine or collagen). Some companies manufacture optical cell culture plastic, it must be determined empirically if this is a viable option.

4. Environmental Chamber Set-up

  1. Prior to any experimentation, set-up the environmental chamber so that it operates at ~80% humidity and so the temperature at the sample position is 37 oC. Most cultured cells grow in 5% CO2/balance air atmosphere due to sodium bicarbonate buffer in the medium. Depending on the set-up, either set the environmental controller to 5% CO2 and it will mix 100% CO2 with air, or use pre-mixed, certified 5% CO2/balance air gas. Follow manufacturer directions for gas flow-rates.
    Note: Some cell lines grow in CO2-independent medium in which case they can be maintained without CO2. Specifically designed imaging media is also available that limits the addition of autofluorescent compounds. Growth in theses mediums for the desired cell type must be determined empirically beforehand.
  2. Prior to imaging, ensure the water reservoir is filled (following manufacturer's directions) with sterile distilled water. Turn on the environmental chamber to the desired temperature setting and place it into the microscope stage inset. To save gas, do not start the flow at this point.
    Note: If there is any free space between the stage-top chamber and stage inset and/or any tension on connection cords to the chamber it may introduce motion artifacts into the experiment.
    1. Lay pieces of paraffin film over the edges of the stage inset opening prior to inserting the chamber into it to couple the chamber to the stage, and make sure that no connections are pulling on the chamber.
  3. Allow the chamber to equilibrate to 37 oC. Maintain a stable temperature to prevent temperature fluctuations during imaging which can affect cell physiology and introduce drift. Reaching temperature equilibration typically requires 30 min to 1 hr, depending on the environment.
    1. Insert a 'dummy' dish with water in the wells into the chamber while warming. An imaging dish filled with water mimics the sample, helping ensure the chamber is sufficiently warmed and stabilized. Filling the chamber with pre-warmed sterile water reduces the time required to temperature stabilization and minimizes the temperature decrease upon addition of the experimental sample.

5. Microscope Set-up

  1. Turn on the microscope, associated computer, and any required peripherals.
    1. Depending on the light source, wait to turn it on until needed (e.g., LED).
  2. With the objective turret in a low position, select the 20X 0.7 NA objective to be used.
  3. Position the sample over the objective – this will make it easier to find the cells when the sample is in the chamber.
  4. Define imaging parameters at this time if they are known from previous experiments.

6. Transporting Cells to Microscope and into the Chamber

  1. Transport the cells to be imaged from the incubator to the environmental chamber. Ensure that this is done quickly to limit the effects of a comparatively low CO2 atmosphere and decreased temperature on the cells. Follow all institutional biosafety guidelines for sample transport and clean-up in case of a spill.
    1. Place the cells in a sealed Styrofoam container or insulated bag to avoid large environmental changes.
  2. Insert the sample imaging dish into the chamber following manufacturer's directions.
  3. After the cells have been secured within the environmental chamber, seal the chamber to maintain a stable environment and immediately turn on the source(s) of atmospheric gas.
    1. As some environmental chambers do not utilize a tight, sealed lid, to retard evaporation, layer sterile, embryo-certified mineral oil on top of the growth medium. Wrap gas-permeant paraffin film around the perimeter-edges of the sample dish being careful not to obstruct the glass imaging area. Localized, secondary humidification methods can be employed. Condensation on the lid of the sample dish can diminish performance of brightfield microscopy.
  4. In order to minimize the effects of thermal drift early during the experiment, wait 30 min before starting the time-lapse. The required time varies based on imaging dish size and other factors. Determine empirically.

7. Setting up the Imaging

  1. Select imaging conditions that will best represent the data. Take precautions to avoid phototoxicity by limiting exposure times, using lower intensity light and selecting probes that are excited by longer wavelengths of light.
  2. Define x, y and z-plane and desired wavelength(s) for each position to be imaged. The time resolution is limited by the number of positions and wavelengths. For long-term time-lapse of most cellular processes, acquire one image every 10 – 20 min; higher time resolution (short intervals, e.g.,1 min) provides more data points and therefore more robust cell tracking, but also results in more integrated light exposure and larger data sets.
    1. As HT1080 FUCCI have dynamic green and red fluorescent proteins (see Representative Results), use the following exposure times: FITC/GFP – 50 msec, Texas Red/TRITC – 40 msec, Brightfield – 20 msec. Use a 2 x 2 bin.
  3. Enable software controlled autofocusing using the default parameters under advanced settings. Define an autofocus range of 10 µm with the recommended step size. Be sure to do this before starting the time-lapse. Autofocus with brightfield images and never with fluorescence to reduce phototoxicity and photobleaching.
    1. Use software controlled autofocusing systems on any microscope with a motorized stage, and directly focus on the sample. However, they can limit the acquisition speed of the experiment. Hardware controlled continuous focusing systems work well for time-lapse microscopy and improve speed, allowing for more positions to be imaged or a higher rate of acquisition. However, they rely on detection of the air-glass interface and may lose focus of the sample with variations in glass thickness across the well.
  4. Replace half of the media with media containing the desired drug concentration that has been warmed to 37 oC. Partial media replacement helps to reduce thermal drift. The conditions in this experiment are Vehicle (DMSO), 1 µM selinexor and 10 µM PD0332991.
    Note: This step can also be done after starting the acquisition by pausing and restarting the experiment. This allows for longitudinal tracking of pre- and post-drug responses of single cells. If drug stability or metabolism is a concern, pausing and replacing the media can be done with the same method. To test for drug degradation or metabolism, media from treated cells can also be placed on naïve cells to test drug action.
  5. Start the time-lapse.
  6. As the time-lapse runs, ensure that the imaged fields remain in focus and the chamber maintains a humid 37 oC.
    1. Adjust focus as needed by pausing the acquisition during the time gap between time points.
  7. If necessary, add water to the chamber during longer experiments. Avoid cooling the chamber by adding pre-warmed, sterile distilled water at 37 oC.

8. Ending the Time-lapse

  1. When the experiment has run to completion, stop the acquisition if it was not set to stop automatically.
  2. Ensure that the time-lapse has been saved properly onto the hard drive, although most software packages automatically save during the acquisition if not finished properly data can be lost.
  3. Remove the chamber from the microscope and dispose of the cells into biohazardous waste following approved institutional biosafety procedures.

9. Longitudinal Tracking and Analysis of Time-lapse Data

  1. Choose the methodology for analysis that is appropriate for the biological processes of interest. Many plugins for ImageJ, programs using MatLab, and custom platforms have been produced for specific applications. The following methodology covers tracking of nuclei and analysis of nuclear fluorescent probes as demonstrated in Figures 4 and 5.
  2. Open the .tif image stacks for the utilized channels in ImageJ. Alternatively, open native files from the acquisition program directly in ImageJ using the Bioformats plugin.
  3. Draw a region of interest (ROI) within the nucleus of one cell using the brightfield image or the nuclear label channel (if used) and add it to the ROI manager. Note: If the imaged cells have a nuclear label (e.g., histone H2B-EGFP), then automatic cell tracking may be utilized to create regions of interest (ROIs) representing individual nuclei through time.
  4. Proceed to the next time point and position the ROI within the same nucleus. Add the ROI to the ROI manager.
  5. Continue to track and make ROIs for the individual cell until there is a cellular event (mitosis, apoptosis, etc.) or the cell can no longer be tracked (i.e., moves out of frame or the experiment ends).
  6. When ROIs have been established for cells through the time they are in the field, superimpose them onto the fluorescent channels of interest. Measure the mean intensity of the fluorescence in each channel for every time point. Save the ROI list for later use.
    1. Various measurements can be made within the ROI for applications in different experiments. Click Analysis → Set Measurements… to bring up a menu to choose the analytical method (e.g., mean intensity within the ROI, integrated intensity, etc.).
  7. Note cell fates for individual cells (e.g., apoptosis, division, survival) while tracking. This allows for creation of survival curves and further population analysis.
  8. With the mean intensity for both channels, create a scatter plot to display cell cycle dynamics in response to therapeutics (Figure 5B, C).
    Note: Plots can be created for individual cells over time or averaged over a population of tracked cells. Quantitative imaging can be critical for establishing complex responses and cell relationships in response to cancer therapeutics. Long-term time-lapse microscopy, longitudinal tracking and data analysis is a multi-step process, with many options for the type of microscopy and analysis tools, and follows the general outline provided in Figure 1.

Through the Looking Glass: Time-lapse Microscopy and Longitudinal Tracking of Single Cells to Study Anti-cancer Therapeutics

Learning Objectives

Long-term time-lapse microscopy and direct longitudinal tracking allows for the study of many anti-cancer effects during drug response. Following the general outline in Figure 1, multiple examples of cells are shown expressing validated fluorescent reporters that treated with anti-cancer drugs, tracked, and analyzed using different approaches.

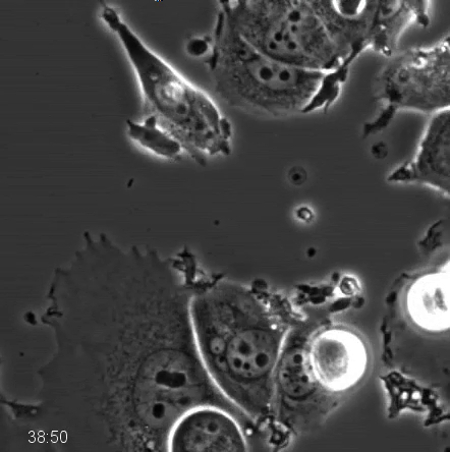
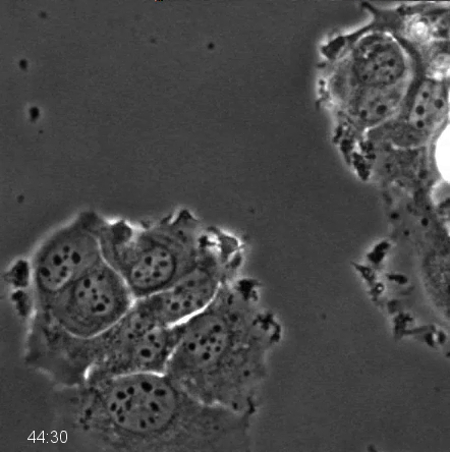
Phase contrast microscopy alone is very informative and robustly reports on interphase versus mitosis, mitotic duration and arrest, abnormal cell division, and cell death21,23,24. Drugs that target cell division, often termed anti-mitotic drugs, continue to be developed. Figure 2 and Movies 1 and 2 show examples of a pair of matched breast cancer-derived MCF7 cell lines that differ only in their p53 status, treated with 500 nM of a type of anti-cancer drug that targets and inhibits the mitotic motor protein, Kinesin-5 (KSP1, Kif11, Eg5), resulting in protracted mitosis20. Wild type MCF7 cells (Figure 2A) are a paradigm to study p53-dependent cell cycle arrest25-27. Wild type cells enter mitosis, remain for several hours, eventually leave and largely arrest with induction of p5325. When p53 is removed by stable p53 knockdown (MCF7 sh p53), instead of arresting after they leave mitosis, the cells go through repeated cycles (Figure 2B). Cells were tracked manually and the mitotic index and the percentage of cells that enter a second mitosis were scored (Figure 2C, D). We observe that the sh p53 cell tracked divides when it enters a second round of mitosis rather than arresting and leaving mitosis without division. While not shown here the duration of mitotic events, time between successive mitoses, percent of cell divisions, and associated cell death events can also be scored20,21.

The taxanes, for example paclitaxel and docetaxel, are common chemotherapy for many cancers, including those that are difficult to treat like pancreatic and advanced breast. Paclitaxel binds to the dynamic plus-end of microtubules and stabilizes them, preventing their normal function. Paclitaxel has noted dose-dependent effects, and even at low concentrations can perturb normal mitotic progression and chromosome segregation16. Faithful segregation of chromosomes is essential to normal cell proliferation and when abnormal can result in aneuploidy that may trigger cell cycle arrest, but also act as a driver of cancer progression. Figure 3 and Movie 3 show cervical carcinoma-derived HeLa cells stably expressing the chromatin marker histone-2b fused to mCherry and beta-tubulin fused to EGFP (not shown) in normal growth medium treated with 1 nM paclitaxel. In this example, entry into and progression through mitosis can be followed. The timing of mitosis appears normal in this cell, however chromosome alignment and segregation is not, resulting in nuclear bulges and micronuclei that are structures indicating poor chromosome segregation. Micronuclei are prone to DNA damage and chromothripsis, which is the large-scale fragmentation of chromosomes or chromatin – this has important implications in tumor evolution28,29. While not shown here, the origin of micronuclei with relation to other mitotic structures and the fate of these cells can be directly tracked using long-term time-lapse. Further, a chromatin marker expressed with a DNA damage reporter could be used to establish the relationship between chromosome segregation, micronuclei and DNA damage.

Fluorescent reporters allow for enumerable cell processes to be tracked and new reporters are continually being developed. For example, the cell cycle consists of phases that are of particular interest in developing targeted anti-cancer therapeutics. Figure 4 and Movie 4 shows a fibrosarcoma-derived cell line (HT1080) that stably co-expresses two reporters termed, fluorescent ubiquitin cell cycle indicators (FUCCI)30. In the system here, a portion of the Cdt1 polypeptide is fused to mKO2 (monomeric Kusabira orange 2) and increases in G1-phase and is degraded in early S-phase, and a portion of geminin is fused to mAG (monomeric Azami green) and increases in mid-S-phase and is degraded upon anaphase. This cell is in normal growth medium and progresses through the cell cycle in 15 hr. Figure 5A, B and Movie 5 show the same cells in normal medium treated with 10 µM PD0332991, a Cdk4/6 inhibitor. The cells progress through G2-phase and divide normally, and strongly arrest in the subsequent G1-phase, indicating the potential for effective cytostatic effects in growing tumors. Figure 5C, D and Movie 6 show the same cells in normal medium treated with a small molecule called selinexor (KPT-330), a potent inhibitor the nuclear export protein, exportin-1 (XPO1, a.k.a. CRM1). These compounds are termed selective inhibitors of nuclear export (SINE) and their anti-cancer effects are currently under investigation31,32. SINE treatment results in strong cell cycle phenotypes and cell death33,34. This example shows a cell that progresses through G1-phase with normal kinetics (approximately 6 hr), but experiences delay in S-phase progression as indicated by the period with both red and green signal (approximately 3 hr in control but 10 in SINE treated). This cell dies in late S- or G2-phase after 21 hr 30 min; a normal cell cycle is approximately 15 hr. The effects of selinexor are being studied for different blood and solid tumors35.

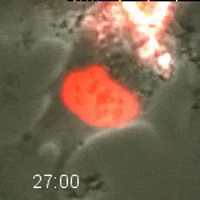
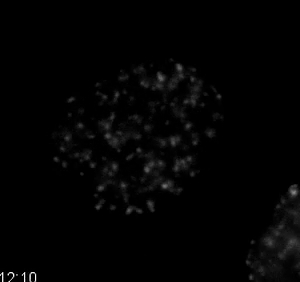
A mainstay of anti-cancer therapy is cytotoxicity through catastrophic DNA damage. DNA damage can be induced through many therapies including radiation, platinum-based adducts, and small molecule drugs – for example, those that target topoisomerase I and/or II. Many combination therapies also attack the DNA damage axis by either inducing damage through separate pathways or blocking the ability of cells to repair the damage. The kinetics and level of damage and if and how this causes cell death is of widespread importance in developmental therapeutics. Figure 6 and Movie 7 show HT1080 cells that stably express a double-strand DNA damage reporter, mCherry-BP1-236 in normal growth medium treated with 10 µM etoposide (VP-16), a topoisomerase II poison. This reporter is comprised of a portion of the DNA double-strand break site protein, 53BP1 that is fused to mCherry. The nucleus of this cell was tracked using the Analyze Particles plugin in ImageJ and the integrated mCherry-BP1-2 signal was measured in each frame after thresholding out values that eliminated soluble nuclear probe. DNA damage is minimal for the first 10 hr and then steadily increases. Topoisomerase II inhibitors are known to particularly affect S- and G2-phase, when the enzyme is most active37,38. The kinetics observed in this example could indicate cell cycle associated damage; combining mCherry-BP1-2 with FUCCI reporters could demonstrate the timing of the damage that can then be linked to cell fate.

Figure 1
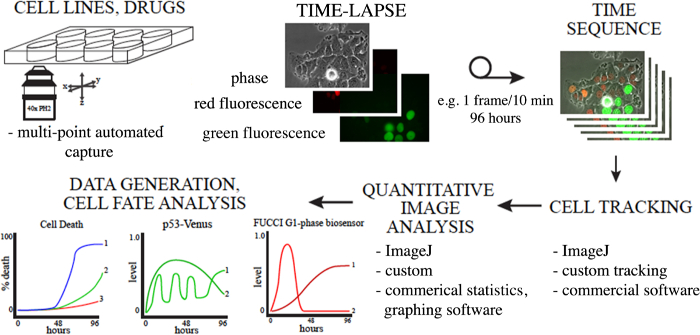
Figure 1. Overview of Using Long-term Time-lapse Microscopy and Longitudinal Tracking to Study Anti-cancer Drug Response. Cells in appropriate live-cell imaging dishes labeled as desired are imaged, cells or regions of interest are tracked, and the data is analyzed. Many methods exist to track and quantify cells, some are indicated here. Please click here to view a larger version of this figure.

Figure 2
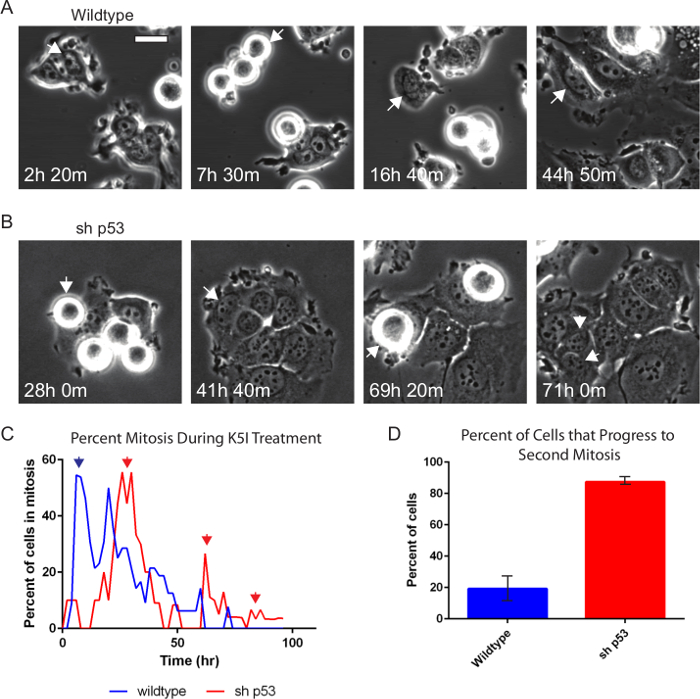
Figure 2. Phase-contrast Time-lapse Microscopy Shows p53-dependence after Anti-mitotic Drug Treatment. Wildtype (A) and p53-knockdown (B) MCF7 cells were treated with 500 nM Kinesin-5 inhibitor and imaged every 10 min for 96 hr using phase-contrast microscopy with a 20X PH2 0.70 NA lens. Individual cells were tracked manually and the percent mitosis and if the cell progresses to another mitosis again during the time-lapse were scored. Arrows indicate cell that is being tracked. The sh p53 cell (B) divides upon entering a second mitosis. (C) Both cell lines show prolonged mitotic arrest as indicated by the high peak percent mitosis (first blue and red arrows). (C, D) Nearly 90% of cells without p53 (sh p53, n = 87) show continued progression (red arrows) compared to 20% of wildtype (n = 130). Error bars indicate standard deviation. Bar = 20 µm. Movies 1 and 2. Please click here to view a larger version of this figure.

Figure 3
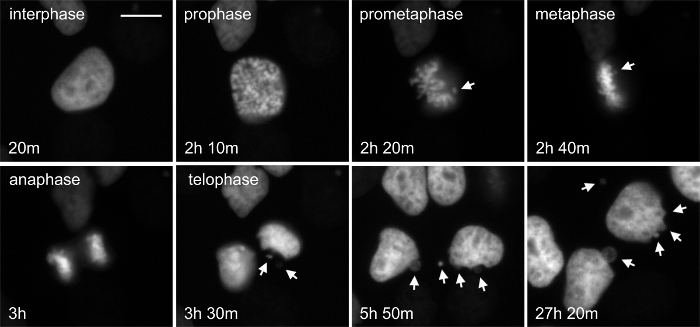
Figure 3. The Chromatin Marker Histone 2b Reveals Evidence of Chromosome Segregation Abnormalities after Low-dose Paclitaxel Treatment. Paclitaxel is a microtubule-targeted drug that results in complex, concentration-dependent defects in cell growth and division. The organization of the chromatin informs on different cell states, including the stage of mitosis and cell death. HeLa cells stably expressing both H2b-mCherry and β-tubulin-EGFP were treated with 1 nM paclitaxel. This cell is initially in interphase, progresses through the stages of mitosis and divides. While the time in mitosis appears normal, there is evidence of chromosome attachment and segregation errors that are resolved (arrows). The fate of these cells can be determined directly by longitudinal tracking. Phase-contrast (not shown) and fluorescent images were acquired at 1 frame per 10 min with a 20X Ph2 0.70 NA lens. Bar = 10 µm. Movie 3. Please click here to view a larger version of this figure.

Figure 4
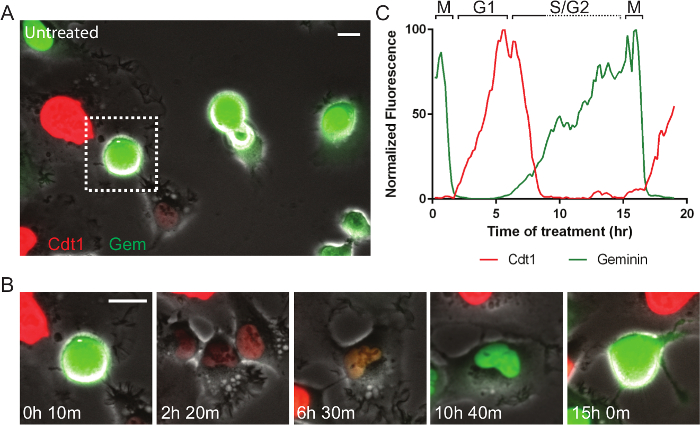
Figure 4. Fluorescent Cell Cycle Markers Allow for Direct Monitoring of Cell Cycle Progression. (A) A field of live HT1080 fibrosarcoma cells expressing the FUCCI system imaged by phase-contrast and fluorescence. (B, C) The mitotic cell in the dashed box in panel A is followed. Normally progress through the cell cycle in approximately 15 hr. After mitosis, cells are briefly dim, and then become red as they progress into and through G1-phase. When cells enter S-phase, the red Cdt1 probe is degraded and the green geminin probe increases. The brief approximately 3 hr period where both probes are present, indicates early S-phase. As cells progress through S- and G2-phase and into the next mitosis they remain green. The green probe is degraded upon anaphase of cell division. Phase-contrast and fluorescent images were acquired at 1 frame per 10 min with a 20X PH2 0.70 NA lens. Bar = 10 µm. Movie 4. Please click here to view a larger version of this figure.

Figure 5
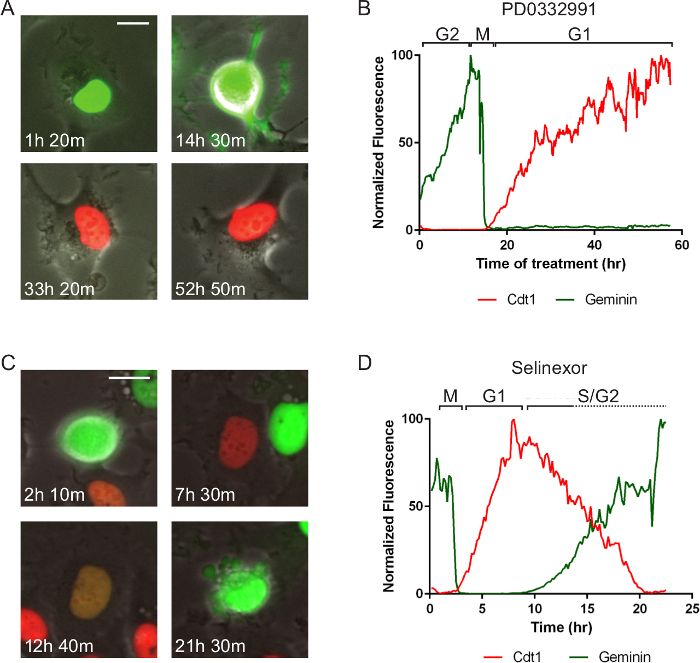
Figure 5. Cell Cycle Specific Effects and Associated Cell Death. The same cell line as in Figure 4 but treated with two different molecules that represent different anti-cancer targets. Times after treatment are indicated. (A, B) After treatment of a late S/G2-phase cell with 10 µM PD0332991 Cdk4/6 inhibitor, it cell progresses normally to mitosis (M) and divides. One daughter cell is tracked by measuring red and green fluorescent intensities in the region of interest in the nucleus. The cell remains arrested in G1-phase for approximately 40 hr. (C, D) After treatment of a late G2-phase cell with 1 µM selinexor, it cell progresses normally to mitosis (M) and divides. One daughter cell is tracked and it enters G1-phase, progresses through a protracted early S-phase (red and green signal), transitions to solely green and dies after 21 hr 30 min. The data suggest S-phase progression is affected by selinexor treatment. Phase-contrast and fluorescent images were acquired at 1 frame per 10 min with a 20X PH2 0.70 NA lens. Bar = 10 µm. Movies 5 and 6. Please click here to view a larger version of this figure.

Figure 6
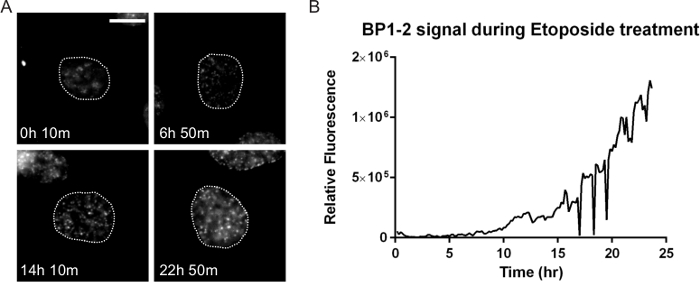
Figure 6. DNA Damage Dynamics after Drug Treatment. Many anti-cancer therapies result in DNA damage that can profoundly impact cell response and treatment success. HT1080 cells stably expressing both the double-strand DNA damage marker mCherry-BP1-2 and H2b-EGFP (not shown) were treated with 10 µM of the topoisomerase II drug etoposide and DNA damage was tracked. (A) The number and intensity of the foci increase after etoposide. There is initially a lag, indicating possible cell cycle effects consistent with the known mechanism of etoposide. By 22 hr 50 min this cell has accumulated high levels of damage. While not shown here, the fate of this cell can be determined by direct tracking. (B) A ROI corresponding to the nucleus obtained through the H2b-EGFP signal was tracked using particle tracking in ImageJ and the integrated BP1-2 mCherry signal was quantified and plotted over time. The lag in signal until approximately 10 hr is noted, followed by a persistent increase. Fluorescent images were acquired at 1 frame per 10 min with a 40X PH2 0.75 NA lens. Bar = 10 µm. Movie 7. Please click here to view a larger version of this figure.

Moive 1
Movie 1. Phase-contrast Time-lapse Microscopy of Wildtype MCF7 Cells after Anti-mitotic Drug Treatment. Wildtype MCF7 cells were treated with 500 nM Kinesin-5 inhibitor and imaged every 10 min for 96 hr using phase-contrast microscopy with a 20X PH2 0.70 NA lens. Prolonged mitotic arrest and exit from mitosis can be observed, as described in Figure 2. Please click here to download this file.

Moive 2
Movie 2. Phase-contrast Time-lapse Microscopy of p53-knockdown MCF7 Cells after Anti-mitotic Drug Treatment. MCF7 cells stably expressing a small hairpin RNA targeting p53 for degradation were treated with 500 nM Kinesin-5 inhibitor and imaged every 10 min for 96 hr using phase-contrast microscopy with a 20X PH2 0.70 NA lens. Prolonged mitotic arrest and multiple rounds of mitosis can be observed, as described in Figure 2. Please click here to download this file.

Moive 3
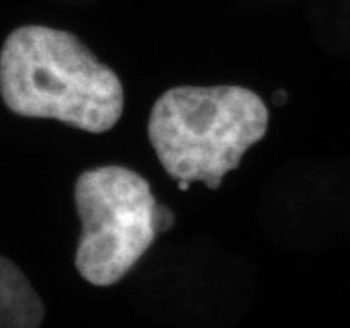
Movie 3. Fluorescent Time-lapse Microscopy of HeLa Cells after Low-dose Paclitaxel Treatment. HeLa cells stably expressing H2B-mCherry and β-tubulin-EGFP were treated with 1 nM paclitaxel. Chromosome attachment and segregation issues can be observed, as described in Figure 3. Images were acquired every 10 min with a 20X PH2 0.70 NA lens. Please click here to download this file.

Moive 4
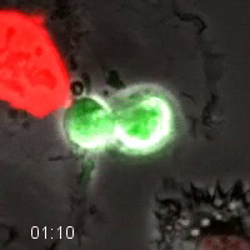
Movie 4. Fluorescent Cell Cycle Markers Allow for Direct Monitoring of Cell Cycle Progression. HT1080 cells expressing the FUCCI system were longitudinally tracked during time-lapse microscopy. The cell goes dim after exiting mitosis, and then becomes red as the cell progresses through G1-phase. As the cell enters S-phase, it becomes yellow as the green geminin probe increases and the red Cdt1 probe is degraded. The cell remains green as it progresses through S- and G2-phase. The green degrades as the cells enters anaphase. Quantification of this cell is shown in Figure 4. Images were acquired every 10 min with a 20X PH2 0.70 NA lens. Please click here to download this file.

Moive 5
Movie 5. HT1080 Cell Expressing Fluorescent Cell Cycle Markers after Treatment with a G1-phase Inhibitor. HT1080 cells expressing the FUCCI system were treated with 10 µM PD0332991, a Cdk4/6 inhibitor. The tracked cell progresses normally to mitosis and divides. One daughter is tracked, and remains red in G1 for the duration of the movie. Quantification is shown in Figure 5. Images were acquired every 10 min with a 20X PH2 0.70 NA lens. Please click here to download this file.

Moive 6
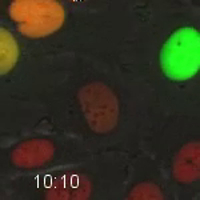
Movie 6. HT1080 Cell Expressing Fluorescent Cell Cycle Markers after Treatment with the Exportin-1 Inhibitor, Selinexor. HT1080 cells expressing the FUCCI system were treated with 1 µM selinexor. This late G2-phase cell was tracked through mitosis. A daughter cell then progresses through G1-phase (red) and enters S-phase (yellow). The cell progresses slowly through S-phases until it enters late-S/G2-phase and dies after 21 hr 30 min of treatment. Quantification is shown in Figure 5. Images were acquired every 10 min with a 20X PH2 0.70 NA lens. Please click here to download this file.

Moive 7
Movie 7. DNA Damage Dynamics after Treatment with a Topoisomerase II Inhibitor. HT1080 cells stably expressing the double-strand DNA damage marker mCherry-BP1-2 and H2B-EGFP were treated with 10 µM etoposide, a topoisomerase II inhibitor. The mCherry-BP1-2 is displayed in the movie. As treatment continues, the signal of mCherry-BP1-2 increases, indicating increased double-strand DNA damage. Quantification is shown in Figure 6. Images were acquired every 10 min with a 40X PH2 0.75 NA lens. Please click here to download this file.

List of Materials

Taxol (paclitaxel) Sigma T7191 microtubule stabilizing drug
etoposide Selleckchem S1225 topoisomerase II inhibitor
selinexor Karyopharm Therapeutics na XPO1/CRM1 inhibitor, gift
Kinesin-5 inhibitor Merck Serono na gift, also available from American Custom Chemicals Corporation. CAS 858668-07-2
cell growth medium HyClone (Fisher) or Mediatech many companies available
5% CO2/balance air, certified Airgas Z03NI7222004379
35mm dish, 20mm glass bottom Cellvis D35-20-1.5-N many companies available
35mm 4 well dish, 20mm glass bottom Cellvis D35C4-20-1.5-N many companies available
35mm dish, gridded glass bottom MatTek P35G-2-14-CGRD many companies available
multi-well, glass bottom Cellvis P12-1.5H-N many companies available
Olympus IX81 inverted epifluorescence microscope Olympus
Olympus IX2-UCB controller Olympus
PRIOR LumenPro200 Prior Scientific Lumen200PRO
PRIOR Proscan III motorized stage Prio Scientific H117
STEV chamber InVivo Scientific STEV.ECU.HC5 STAGE TOP
Environmental Controller Unit InVivo Scientific STEV.ECU.HC5 STAGE TOP
Hamamatsu ORCA R2 CCD with controller Hamamatsu C10600
Nikon Eclipse Ti Nikon
Nikon laser launch Nikon
SOLA light engine lumencor
iXon Ultra 897 EM-CCD ANDOR 
TOKAI HIT inclubation chamber TOKAI HIT TIZSH

Lab Prep

The response of single cells to anti-cancer drugs contributes significantly in determining the population response, and therefore is a major contributing factor in the overall outcome. Immunoblotting, flow cytometry and fixed cell experiments are often used to study how cells respond to anti-cancer drugs. These methods are important, but they have several shortcomings. Variability in drug responses between cancer and normal cells, and between cells of different cancer origin, and transient and rare responses are difficult to understand using population averaging assays and without being able to directly track and analyze them longitudinally. The microscope is particularly well suited to image live cells. Advancements in technology enable us to routinely image cells at a resolution that enables not only cell tracking, but also the observation of a variety of cellular responses. We describe an approach in detail that allows for the continuous time-lapse imaging of cells during the drug response for essentially as long as desired, typically up to 96 hr. Using variations of the approach, cells can be monitored for weeks. With the employment of genetically encoded fluorescent biosensors numerous processes, pathways and responses can be followed. We show examples that include tracking and quantification of cell growth and cell cycle progression, chromosome dynamics, DNA damage, and cell death. We also discuss variations of the technique and its flexibility, and highlight some common pitfalls.

The response of single cells to anti-cancer drugs contributes significantly in determining the population response, and therefore is a major contributing factor in the overall outcome. Immunoblotting, flow cytometry and fixed cell experiments are often used to study how cells respond to anti-cancer drugs. These methods are important, but they have several shortcomings. Variability in drug responses between cancer and normal cells, and between cells of different cancer origin, and transient and rare responses are difficult to understand using population averaging assays and without being able to directly track and analyze them longitudinally. The microscope is particularly well suited to image live cells. Advancements in technology enable us to routinely image cells at a resolution that enables not only cell tracking, but also the observation of a variety of cellular responses. We describe an approach in detail that allows for the continuous time-lapse imaging of cells during the drug response for essentially as long as desired, typically up to 96 hr. Using variations of the approach, cells can be monitored for weeks. With the employment of genetically encoded fluorescent biosensors numerous processes, pathways and responses can be followed. We show examples that include tracking and quantification of cell growth and cell cycle progression, chromosome dynamics, DNA damage, and cell death. We also discuss variations of the technique and its flexibility, and highlight some common pitfalls.

Procedure

The response of single cells to anti-cancer drugs contributes significantly in determining the population response, and therefore is a major contributing factor in the overall outcome. Immunoblotting, flow cytometry and fixed cell experiments are often used to study how cells respond to anti-cancer drugs. These methods are important, but they have several shortcomings. Variability in drug responses between cancer and normal cells, and between cells of different cancer origin, and transient and rare responses are difficult to understand using population averaging assays and without being able to directly track and analyze them longitudinally. The microscope is particularly well suited to image live cells. Advancements in technology enable us to routinely image cells at a resolution that enables not only cell tracking, but also the observation of a variety of cellular responses. We describe an approach in detail that allows for the continuous time-lapse imaging of cells during the drug response for essentially as long as desired, typically up to 96 hr. Using variations of the approach, cells can be monitored for weeks. With the employment of genetically encoded fluorescent biosensors numerous processes, pathways and responses can be followed. We show examples that include tracking and quantification of cell growth and cell cycle progression, chromosome dynamics, DNA damage, and cell death. We also discuss variations of the technique and its flexibility, and highlight some common pitfalls.

Tags