Note: The collection of cores with undisturbed sediment-water interfaces is essential to making good experimental measurements of exchange; highly-disturbed cores are likely to exchange pore water solutes with overlying water and have enhanced uptake of oxygen via the oxidation of Fe(II) and reduced sulfur compounds. In this paper, we emphasize sediment incubation procedures of sediments with only a cursory inclusion of sediment sampling techniques and chemical analyses of solutes and gases. Prior to sampling, or based on initial results, determine the degree of replication by the overall project needs, statistical design or expected amount of small scale spatial variability. Duplicate cores are the minimum used by many studies and triplicates are useful for allowing a better statistical analysis.
1. Sediment Collection and Handling
Note: The collection of sediment for exchange experiments is carried out using 1) manual insertion of cores using divers or in shallow water or wetland, by wading, 2) pole coring using an aluminum pole with a manually closed valve to retain sediments, or 3) box coring.
- At each site, record the site location using GPS, determine bottom water oxygen, temperature, and salinity using a water quality sonde, and determine the photosynthetically active radiation (PAR) at the surface and bottom using a PAR sensor/meter.
- Lower the water quality sonde to ~1 m above the sediment and record bottom water characteristics (depth, temperature, dissolved oxygen, temperature and salinity/conductivity).
- Lower a PAR sensor with an underwater probe to the sediment-water interface using a lowering frame. Compare PAR readings near the sediment surface to PAR readings immediately below the air-water interface to estimate the light attenuation under the ambient light conditions.
- Deploy a box corer over the side of the boat/ship, lowering it slowly to minimize disturbances upon penetrating the sediment. Examine the core box for visible disturbance or excessive resuspension.
- For a box corer, insert core tubes into the sediment, and use a butyl stopper to cover the top of the core. For flux experiments, while the ideal sediment/water balance within the core is 15 cm of water and 15 cm of sediment, in coarse or highly compacted sediments collecting less sediment depth is an acceptable outcome. If rates of oxygen depletion are excessive, shift the balance towards more water column height.
- Typically use 6.35 cm inner diameter cores for deep water studies and for sediments with benthic microalgae or large animal populations, use 10 cm ID cores. The main limit to core size is the ability to cap the bottom of the core.
- Cap the bottom with an acrylic bottom plate that has an embedded O-ring. Repeat this process until sufficient replicates are collected. With the pole corer, first place the acrylic bottom plate in the core liner, remove the core from the corer, and add the stopper.
- Place cores in a tall insulated water cooler that is flooded with ambient water from the site; this helps maintain in situ temperatures. Ensure that the cooler remains upright. Discard cores that are disturbed during transport.
- Pump bottom water taken near the sediment surface into 20 L carboys for use in the experiments. Use a diaphragm pump with 10-20 L/min capacity or a high speed peristaltic pump.
- In shallow unstratified water, fill the carboy by "dunking" it in the water. Filtration of the bottom water using a high capacity inline cartridge filter may be useful at sites with high rates of water column oxygen uptake or photosynthesis (in the light), minimizing the correction from the water column only control cores.
- Transport the cores as quickly as possible to the incubation facility. In the case of extended transport, aerobic cores can become anoxic and artificial bubbling or circulation are necessary.
2. Initial Setup
- At the incubation facility, place cores in an incubation tub either in an environmental room with controlled temperature, or in a double walled incubator with temperature control via a heating/cooling circulator. Set the temperature to bottom water temperatures measured in 1.1.1.
- Add bottom water to the incubator, completely submerging the sediment cores. Also add water to 5 L carboys with spigots that will be used to dispense replacement water.
- Add a water-only core (without sediment) to the incubator. The use of water column blanks is important in most environments to compensate for any water column processes that affect gases and solutes. For the measurement of denitrification, these blanks can reflect not only water column processes but the exchange of gases with the acrylic walls of the core.
- Bubble cores with air for a minimum of 2 hr to ensure thermal equilibrium and full oxygenation of overlying water. They may be kept overnight and time courses initiated the next morning. Longer pre-incubation periods have not been evaluated for efficacy.
- For aeration, use a small "T" bubbler consisting of ½" PVC pipe with a three way coupler; a 1/8' tube inserted to the bottom of the T results in entrainment of water upward during bubbling and ensures not only oxygenation, but circulation of the water in the core with water in the incubation tub.
3. Sediment-water Incubation Procedures
- After checking the temperature to ensure it matches the field conditions, attach spinning tops to the tops of the cores. At this point, seal the core from the tank water. Leave the sampling valve on the core open during this process. Manually sweep any air bubbles gently from the bottom side of the spinning top.
- Elevate the replacement water carboy ~30-40 cm higher than the tops of the incubation cores and drain the lines downward to eliminate any air in the line. While still flowing, attach the lines to the core tops and close the valves.
- Turn on the central stirring turntable and adjust the rotation speed so that cores rotate ~40 times per minute, or at a rate that is sufficient to mix the water column but not resuspend the sediment.
- Approximately 5 min after all cores are sealed, open the replacement water valve and the sample valve, and then attach a short piece of tubing to the sample valve using a Luer fitting. Place this sampling tube in the bottom of a 7 ml glass tube, which is filled to overflowing. Prior to capping the tube, add 10 µl of 30 g L-1 HgCl2 as a preservative.
- Store these samples underwater at temperatures close to the incubation temperature. Other laboratories have successfully used 12 ml "Exetainers" for sample storage.
- For solute sampling, attach a 20 ml syringe barrel to the sample valve and open the replacement water valve. The syringe barrel fills until full using only gravity. Attach a plunger and a filter disk, and then filter the samples into vials. These samples for nutrient analysis are frozen at -20 °C until analysis.
Note: The time course of sampling in the dark typically involves 4 sampling periods with the intervals between sampling ranging from 0.5 to > 2 hr, depending on the rate of oxygen uptake. With low rates of oxygen uptake, the time intervals are long; in sediments with high rates of respiration, intervals need to be short. Excessively high volumes of sample taken at each sample point may result in sampling too big a proportion of the whole sample volume; in our work these sample volumes result in a negligible correction. If greater volume of sample is needed, larger diameter cores or an increased water column height may be necessary. - Do not proceed with a time course of sampling below a threshold of 50% oxygen depletion, with oxygen depletions of 25% usually providing sufficient signal in nutrient concentrations. Here, use calibrated optodes for direct analysis of oxygen concentrations and oxygen saturation.
- If the sediments are from shallow, illuminated environments, at the 4th sampling, turn on the lights and take 3 subsequent samples. Note that in highly photosynthetic sediments, supersaturation of O2 and bubble formation limits the measurement of gas fluxes in some cases. The continual monitoring of oxygen is an increasingly viable and valuable alternative, with fiber optic measurement technology having relatively small probes that are highly reliable and precise.
- At the conclusion of the sediment incubations, either measure the height of the water column or siphon the water column in to a graduated cylinder to directly determine the water volume, and take photos of each core.
4. Sample Analysis
- Pump samples for the analysis of N2, O2 and Ar into a membrane inlet mass spectrometer, and determine the ratios of N2:Ar and O2:Ar to < 0.03% precision12,23.
- Couple a quadrupole mass spectrometer to a membrane inlet. Push the sample into the membrane tubing using a peristaltic pump. Collect the sample waste in a plastic carboy and treat as chemical waste due to the Hg preservative. Calibrate with deionized water equilibrated with air at the temperature of incubation.
- Perform nutrient analyses manually on ≤ 5 ml samples or on smaller volumes using automated analyzers. Upon sample thawing, start analyses immediately. The choice of nutrient analysis procedure must yield a precision sufficient to observe changes in nutrient concentration during incubation. Typical detection limits are < 0.05 µmol L-1 and time course trends can be difficult to observe under both extremely low and extremely high nutrient concentrations.
- For colorimetric analyses of soluble reactive phosphorus, use the ascorbic acid phosphomolybdate technique. For the ammonium analyses, utilize an overnight color development using a phenol hypochlorite reagent24. Automated colorimetric analyses, either using segmented flow or a discrete analyzer, are a great alternative and utilize lower sample volume.
- For analyses of nitrate plus nitrite, utilize overnight color development using vanadium chloride as a reductant25, or use an automated analyzer
- Compare absorbances determined on a UV/VIS spectrophotometer to standard curves and determine concentrations from a regression of standards concentrations and absorbances.
5. Calculation of Sediment-water Exchange Rates
- Regress the concentrations of gas or nutrient versus time independently for both dark and illuminated incubations, with the slope expressed as µmol L-1 hr-1. Correct the slopes of the incubation cores for the slope of the water column-only cores. Only use significant regressions (P < 0.05) for calculations; identify non-significant data in the final data spreadsheets.
- Calculate sediment-water exchange rates from the slope of the change of chemical constituent concentrations in the overlying water:
Where F is the flux (µmol m-2 hr-1), ΔC/Δt is the slope of the concentration change in overlying water (µmol L-1 hr-1), V is the volume of the overlying water (L) and A is the area of the incubated core (m-2).To estimate the daily flux, multiply the illuminated rate by the hours of light and add to the dark rate multiplied by the hours of darkness.
6. Reporting
- When reporting results from sediment-water exchange measurements, provide sufficient information for other scientists to understand the environment that has been sampled. Essential information includes: 1) site location and water depth, 2) physical characteristics such as field and incubation temperature, and PAR, 3) bottom water characteristics such as oxygen, nutrient concentrations and salinity, and 4) sediment characteristics such as grain size, organic matter concentrations, and the presence of benthic animals.
Results from sediment flux measurements near an aquaculture facility on the Choptank River (Chesapeake Bay, MD) are shown in Figure 1 and the interpretation of these results in an ecosystem context are presented elsewhere26. The incubations were carried out over 7 hours, with dark incubations followed by illuminated incubations data. Data from two cores are shown as well as the water column only control. The rapid decrease in oxygen in the dark was attenuated somewhat by illumination; the photosynthesis rate of microalgal production was not as high as respiration, with the main effect of illumination being a decreased rate of change of oxygen. The control core experienced small decreases in oxygen concentration in the dark and small increases in the light.
The N2 concentrations were determined by the N2:Ar ratio and the calculated Ar saturation literature values for the observed temperature and salinity27. At a typical precision of 0.02% for the N2:Ar ratio, these data are precise to ~0.1 µmol L-1 N2. The sediment cores and the water column blank cores had increases in N2 over time, with much higher rates of increase for the cores. Under illumination, slopes were generally similar to the dark rate of N2 change.
Fluxes of dissolved NH4+ were quite high at this site, with dark increase of > 20 µmol L-1 for one core. Illuminated NH4+ fluxes were much lower. Both cores and the water column blank had decreasing NOx– concentration over time, leveling out during illumination. For all of the fluxes, the concentration data and data on the core volume and other relevant parameters are shown in Tables 1 and 2.
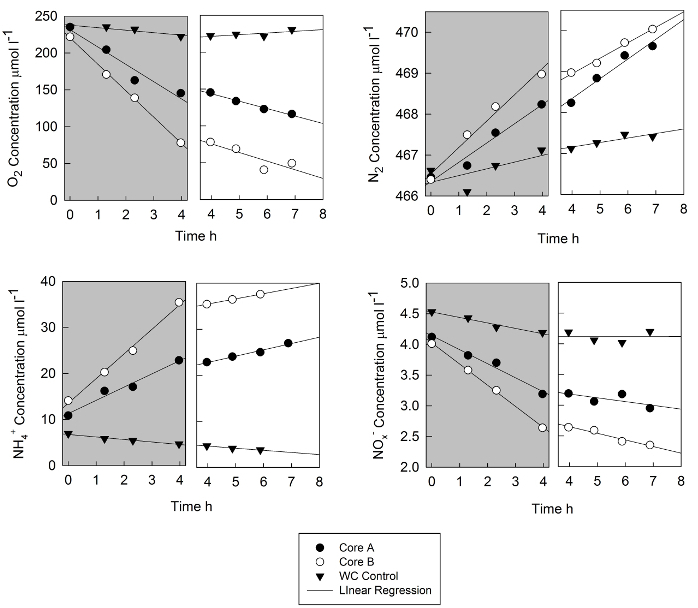
Figure 1. Time course data from a shallow water site in the Choptank River that was covered with floats containing cultured oysters. The data are from replicate cores (A and B) and the data from a water column blank are shown. Concentrations of oxygen N2, NH4+ and NOx– (the sum of NO3– and NO2– are presented for both the dark part of the incubation (shaded area) and for the illuminated part of the incubation. The fourth time point of the dark incubation is also the first time point of the illuminated time series; lights were turned on at the time of sampling. The lines are linear regressions and slopes are presented in Table 1. Please click here to view a larger version of this figure.
| Oxygen – Dark | Time (hr) | Core A | Core B | Control |
| 0 | 235.1 | 221.7 | 235.2 | |
| 1.3 | 204.3 | 170.6 | 235.3 | |
| 2.32 | 162.7 | 138.9 | 232 | |
| 3.97 | 145.3 | 77.9 | 222.2 | |
| R2 | 0.943 | 0.999 | 0.836 | |
| Slope (µmol L-1 hr-1) | -23.5 | -35.9 | -3.4 | |
| Corrected Slope (µmol L-1 hr-1) | -20.1 | -32.5 | ||
| Rate (µmol m-2 hr-1) | -3,095 | -4,875 | ||
| Oxygen – Light | Time (hr) | Core A | Core B | Control |
| 3.97 | 145.3 | 77.9 | 222.2 | |
| 4.88 | 133.5 | 68.8 | 224.3 | |
| 5.88 | 122.8 | 40.3 | 221.6 | |
| 6.88 | 116 | 49.2 | 230.5 | |
| R2 | 0.981 | 0.999 | 0.994 | |
| Slope (µmol L-1 hr-1) | -10.1 | -9.8 | 2.9 | |
| Corrected Slope (µmol L-1 hr-1) | -13 | -12.7 | ||
| Rate (µmol m-2 hr-1) | -2,000 | -1,905 | ||
| N2 – Dark | Time (hr) | Core A | Core B | Control |
| 0 | 466.46 | 466.40 | 466.62 | |
| 1.3 | 466.74 | 467.49 | 466.11 | |
| 2.32 | 467.55 | 468.18 | 466.74 | |
| 3.97 | 468.24 | 468.98 | 467.12 | |
| R2 | 0.963 | 0.98 | 0.854 | |
| Slope N2 (µmol L-1 hr-1) | 0.471 | 0.645 | 0.12 | |
| Corrected Slope N2 (µmol L-1 hr-1) | 0.351 | 0.525 | ||
| Rate N2-N (µmol m-2 hr-1) | 108.1 | 157.5 | ||
| N2 – Light | Time (hr) | Core A | Core B | Control |
| 3.97 | 468.24 | 468.98 | 467.12 | |
| 4.88 | 468.84 | 469.21 | 467.26 | |
| 5.88 | 469.39 | 469.71 | 467.47 | |
| 6.88 | 469.62 | 470.04 | 467.41 | |
| R2 | 0.96 | 0.987 | 0.967 | |
| Slope N2 (µmol L-1 hr-1) | 0.481 | 0.378 | 0.096 | |
| Corrected Slope N2 (µmol L-1 hr-1) | 0.386 | 0.282 | ||
| Rate N2-N (µmol m-2 hr-1) | 118.9 | 84.6 | ||
| Core Surface Area (m2) | 0.003165 | 0.003165 | ||
| Core Volume (L) | 0.4874 | 0.4747 |
Table 1. Time course data for O2 and N2 from sediments underneath oyster aquaculture floats in the Choptank River, a subestuary of the Chesapeake Bay. The gas concentrations are derived from O2:Ar and N2:Ar ratios determined via membrane inlet mass spectrometry. The time course regression R2 values are significant for values > 0.9025 (P < 0.05). Slopes are determined by linear regression and corrected slopes are determined by subtracting the rate of change of the water column only blank. Positive rates are net fluxes out of the sediment, negative rates indicate flux into the sediment. The N2 flux data are expressed as N2-N, making comparison to NH4+ and NOx– fluxes easier. This site had sediments primarily consisting of silt and clay with fully aerobic water column conditions. The area of the cores was 31.65 cm-2 and the water column depths were 15.4 cm for core A and 15.0 for core B. All concentrations for N2 and O2 are µmol L-1. The final rate for N2 flux is expressed at N2-N.
| NH4+ – Dark | Time (hr) | Core A | Core B | Control |
| 0 | 10.84 | 14.09 | 6.91 | |
| 1.3 | 16.19 | 20.26 | 5.83 | |
| 2.32 | 17.07 | 24.93 | 5.42 | |
| 3.97 | 22.83 | 35.43 | 4.67 | |
| R2 | 0.968 | 0.993 | 0.853 | |
| Slope (µmol L-1 hr-1) | 2.88 | 5.36 | -0.53 | |
| Corrected Slope (µmol L-1 hr-1) | 3.41 | 5.89 | ||
| Rate (µmol m-2 hr-1) | 525 | 884 | ||
| NH4+ – Light | Time (hr) | Core A | Core B | Control |
| 3.97 | 22.83 | 35.43 | 4.67 | |
| 4.88 | 24.05 | 36.45 | 4.13 | |
| 5.88 | 25.00 | 37.60 | 3.79 | |
| 6.88 | 26.96 | |||
| R2 | 0.978 | 1 | 0.966 | |
| Slope (µmol L-1 hr-1) | 1.37 | 1.13 | -0.55 | |
| Corrected Slope (µmol L-1 hr-1) | 1.92 | 1.68 | ||
| Rate (µmol m-2 hr-1) | 296 | 252 | ||
| NOx– – Dark | Time (hr) | Core A | Core B | Control |
| 0 | 4.12 | 4.01 | 4.53 | |
| 1.3 | 3.82 | 3.58 | 4.43 | |
| 2.32 | 3.70 | 3.25 | 4.28 | |
| 3.97 | 3.19 | 2.64 | 4.19 | |
| R2 | 0.976 | 0.992 | 0.967 | |
| Slope (µmol L-1 hr-1) | -0.229 | -0.345 | -0.089 | |
| Corrected Slope (µmol L-1 hr-1) | -0.14 | -0.256 | ||
| Rate (µmol m-2 hr-1) | -21.6 | -38.4 | ||
| NOx– – Light | Time (hr) | Core A | Core B | Control |
| 3.97 | 3.19 | 2.64 | 4.19 | |
| 4.88 | 3.06 | 2.59 | 4.06 | |
| 5.88 | 3.18 | 2.41 | 4.02 | |
| 6.88 | 2.95 | 2.35 | 4.2 | |
| R2 | 0.934 | 0.909 | 0.9 | |
| Slope (µmol L-1 hr-1) | -0.078 | -0.103 | 0 | |
| Corrected Slope (µmol L-1 hr-1) | -0.078 | -0.103 | ||
| Rate (µmol m-2 hr-1) | -12 | -15.5 | ||
| Core Surface Area (m2) | 0.003165 | 0.003165 | ||
| Core Volume (L) | 0.4874 | 0.4747 |
Table 2. Time course data for NH4+ and NOx– from the same sediment cores used for Table 1. The time course regression R2 values are significant for values > 0.9025 (P < 0.05). Slopes are determined by linear regression and corrected slopes are determined by subtracting the rate of change of the water column only blank. Positive rates are net fluxes out of the sediment, negative rates indicate flux into the sediment. All concentrations for NH4+ and NO2– are µmol L-1.