1. Microgel Synthesis
NOTE: N-isopropylacrylamide (NIPAM) was recrystallized from n-hexane. Other reagents were used as received.
- Conventional Batch Synthesis of Poly(NIPAM) Matrix Microgels
- Dissolve 1.8 g NIPAM and 24 mg N,N'-bisacrylamide (BIS) in 245 ml filtered (0.2 µm regenerated cellulose (RC) membrane filter) double distilled water in a 500 ml three-neck round bottom flask equipped with a reflux condenser, a stirrer and a rubber septum.
- Insert a thermometer and a 120 mm needle for the nitrogen input through the septum.
- Heat the solution to 60 °C, while stirring. Deoxygenate the solution by purging with nitrogen for 40 min.
- Simultaneously prepare an initiator solution of 155 mg potassium persulfate (KPS) in 5 ml filtered double-distilled water and bubble the solution with nitrogen to remove oxygen.
- Transfer the complete 5 ml KPS solution in a nitrogen-washed syringe equipped with a 120 mm needle.
- Lift the nitrogen needle above the solution level in the three-neck flask and add the KPS solution rapidly through the rubber septum into the reactor.
- Let the polymerization proceed for 1 hr under nitrogen flow and slow stirring at 60 °C.
- Use a Buchner funnel and filter paper to filter the hot reaction solution in order to discard big aggregates. Let the dispersion to cool down.
- Centrifuge and redisperse the dispersion three times for 40 min at 257,000 x g and finally redisperse the sediment in a minimum viable amount of double distilled water. Typically this is 2-4 ml.
- Lyophilize the dispersion for storing.
- Non-stirred Synthesis of Fluorescently Labeled Poly(NIPAM) Microgels
- Weigh 257.7 mg NIPAM, 3.5 mg BIS, and 1.5 mg methacryloxyethyl thiocarbamoyl rhodamine B (dye) in glass vessel and add 10 ml of filtered double distilled water.
- Ultrasonicate the dye–monomer solution for 15 min to dissolve the dye in water.
- Prepare the same solution without the dye into a separate glass vessel.
- Prepare various dilutions of the monomer solution with the dye using the monomer solution without the dye to obtain a concentration series with various dye concentrations. In this work, use dye in the concentration range of 0.02-0.1 mmol/L.
- Dissolve 8.4 mg KPS in 10 ml filtered double distilled water in order to get the initiator solution.
- Transfer 0.5 ml of the concentration series and 0.5 ml of the KPS solution to test tubes with 10 mm diameter to obtain the final reaction solutions and seal them with rubber septa.
- Preheat an oil bath in a double-walled glass vessel connected to a heating circulator to 63 °C.
- Deoxygenize the reaction solutions by purging with nitrogen through 120 mm needles for 20 min.
- Insert the tubes into a floating platform and immerse the platform into the preheated oil bath. Set the temperature to 60 °C. Initially higher temperature in the bath is necessary as the room temperature solutions cool down the bath. For high precision particle size tuning the temperature control during the initial reaction has to be rigorous, typically ±0.1 °C.
- Let the reaction proceed for an appropriate time. Typically 1 hr is enough.
- Transfer the reaction tubes rapidly to an oven at 60 °C and put one drop of the hot dispersion to 10 ml filtered double distilled water preheated over PNIPAM volume phase transition temperature (VPTT, 32 -34 °C) 1, for DLS characterization in the collapsed state.
- Let the rest of the dispersions cool down to room temperature and transfer them into centrifuge tubes.
- Centrifuge the solution three times for 40 min at 257,000 x g and dilute the microgels finally in 2 ml filtered double distilled water for use as tracer particles.
2. Light Scattering Characterization
- Hydrodynamic Radius Determination in Collapsed State by Dynamic Light Scattering
- Wash cuvettes and glassware with acetone vapor.
- Heat 10 ml of filtered (e.g., 200 nm or smaller RC filter) double distilled water over PNIPAM VPTT.
- Transfer a drop of hot dispersion to the filtered water using a pre-heated needle (0.9 x 40 mm) and syringe (1 ml).
- Temper the DLS goniometer index match bath to 50 °C and transfer the sample to the instrument without letting it cool down.
- Find the largest scattering angle where the scattered intensity is sufficient to acquire a correlogram by performing test measurements.
- Insert sample cuvette (10 mm diameter glass tube with 1 ml of particle dispersion). Move the detector arm to small scattering angle (here 30°).
- Check the beam profile for multiple scattering: no glow around the primary beam, no multiple scattering, etc. Check that the count range is suitable for measurement at the lowest scattering angle (approx. between 30 and 600 kHz; top right corner of the software window.)
- Move the goniometer arm to highest scattering angle (choose 120° here). Check that the count rate is still high enough for the measurement (between 30 and 600 kHz). If the intensity is too low, move the arm to lower scattering angle.
- Check the beam visually through the toluene bath glass at the lowest scattering angle, if glow around the incident beam is observed multiple scattering takes place. In this case, reduce the laser intensity or use a higher dilution.
- Acquire 20 correlograms between the minimum and maximum scattering angle (e.g., 30° – 140°) with minimum acquisition time of 60 sec. Increase the acquisition time for weak intensity large scattering angles if necessary.
- Data Analysis 37
- Calculate scattering vector magnitudes for the scattering angle according to
 , where n is the refractive index of the dispersion,
  the wavelength of the laser in vacuum and
  the scattering angle.
 - In the case the measurement software provides the intensity correlation function
 , transform it to electric field correlation function
  according to
  . Parameter
  is an uninteresting instrumental parameter related to the degree of spatial coherence of the scattered light over the detector area.
 - Perform cumulant analysis on correlograms, i.e., fit second order polynomial to the logarithm of each electric field correlation function
 by linear least squares. appears as the intercept of the fit and its exact value is unimportant in respect to the data analysis. Restrict the fit to a meaningful lag time τ value, e.g., so that the correlation amplitude is 10 – 20 % of the maximum amplitude. The coefficient of the first order term is the mean decay rate of the correlation function,
  .
. - Find the most likely value for the mean diffusion coefficient
 of the particles by linear least squares fit on
  . If against
  does not appear linear and go through the origin within the error, the particle size distribution is broad and hydrodynamic radius will be poorly defined.
 - Calculate the mean hydrodynamic radius from the Stokes-Einstein relation
 , where
  is the Boltzmann coefficient,
  the absolute temperature and
  the viscosity of the dispersion at . Propagate the standard deviation of to
  .
.
- Calculate scattering vector magnitudes for the scattering angle according to
- Particle Structure Determination by Static Light Scattering
- Wash cuvettes and glassware with acetone vapor. Use 20 mm diameter or larger cuvettes to minimize the cylindrical lens effect.
- Filter (200 nm RC filter or smaller) approximately 20 ml of double distilled water to a glass vial and transfer a drop of purified dispersion to the vial. Wash the filter with 10 ml water before using it for sample preparation to remove impurities remaining from the manufacturing process.
- Check sample against any ambient light source. If blue hue is observed, the sample is likely to be too concentrated. Dilute accordingly.
- Prepare background water sample by flushing the cuvette multiple times with filtered water and then fill up to appropriate sample volume, depending on the cuvette and the laser position in the instrument. The laser must pass through the sample without being refracted from the meniscus.
- Calibrate the instrument using a toluene sample.
- Measure water scattering (background) throughout the available angular range.
- Measure the scattering intensity from the sample throughout the available angular range preferably at several wavelengths. The scattering pattern normalized to the forward scattering intensity is known as the form factor.
- If particle structure is known, use the appropriate model expression to calculate global fit on the datasets measured at different wavelengths.
- For unknown particle structure use regularized direct (such as FitIt! 33) or a more general indirect inverse Fourier transform 21,22 routine in conjunction with deconvolution of the pair distance distribution function (only for spherical particles) 23,24 for approximate classification of particle type.
- In case the fitting or inversion routine provides an estimate of the particle radius distribution function, calculate the polydispersity index (standard deviation of the distribution divided by its mean).
3. Particle Tracking by Wide-field Fluorescence Microscopy
NOTE: Tracer and matrix particles of 465 ± 7 nm and 405 ± 7 nm hydrodynamic radii at 20 °C, respectively, were used for particle tracking.
- Sample Preparation
- Prepare concentrated matrix microgel dispersion by redispersing known amount of lyophilized unlabeled microgel to known amount of double distilled water. Add a small volume of labeled tracer particles.
- Confirm the appropriate tracer microgel concentration in the microscope. The optimal concentration is a compromise between simultaneous acquisitions of maximum number of tracks, while having the tracer concentration low enough so that the probability that the tracer particle tracks cross during the acquisition is negligible.
- Prepare concentrated dispersions by evaporating water in an oven. Determine weight concentration by comparing the weight of the dispersion to the original weight of the sample before evaporation.
- Data Acquisition and Analysis
- Use an appropriate objective lens of the desired magnification and aperture for excitation of the tracers and simultaneous fluorescence collection from the sample. In this work, use a 100X/1.3 NA oil immersion objective lens.
- Place the moisture chamber onto a xyz-piezo table, which fits into a commercial microscope.
- To prevent the sample from drying, place a plasma cleaned cover slip into the moisture chamber and pipette 10 µl of poly(NIPAM) dispersion of the desired concentration onto the slip.
- Depending on the excitation and emission spectra of the fluorescent dye, use a suitable laser for excitation and adjust the laser power appropriately. The intensity should be sufficiently low to avoid fast photobleaching of the dyes, but at the same time strong enough for accurate single particle positioning (see below). In this work, use a 561 nm diode-pumped solid-state laser and keep the laser power constant at 16 mW (ca. 0.5 kW cm-2 at the sample) for all the measurements.
- To obtain homogeneous sample illumination, use the critical illumination setup described here. For this, couple the laser into a multimode fiber (NA 0.22 ± 0.02, 0.6 mm core diameter), shake the fiber using a vortexer in order to temporally average out laser speckles, and project the fiber end into the sample plane.
- Calibrate the z distance from the back reflection of the cover slip and focus several micrometers into the sample by moving the objective slightly up and fix the z-position using a z-compensator. This avoids any interface effects with the coverslip.
- Adjust the detector parameters, such as exposure time, to the strength of the fluorescence signal. In this case, use an EMCCD camera with exposure time of 0.1 sec, electron multiplying mode and gain of 50.
- Acquire several movies with the appropriate number of frames to obtain adequate lag time to calculate the mean square displacement of the microgels in different regions of the sample. In this work, use acquisition frame numbers of 500 or 1,000 frames.
- Analyze the data by positioning the particles in each frame using Gaussian fitting 25 and use an appropriate particle tracking algorithm 26 to obtain the mean square displacement. 27 Calculate mean values and standard deviation by averaging over all the tracks in all the movies. Calculate the long lag time diffusion coefficients by linear regression from
 , where
  is the mean square displacement, D the mean diffusion coefficient and τ the lag time.
 - Estimate the anomaly parameter γ from the anomalous diffusion equation
 by transforming the data to logarithmic scale, yielding
  . The anomaly parameter
  is given by the derivative of the plot. The derivative can be estimated by the finite differences of the data points, or fitting the data points by polynomial functions and differentiating analytically. Determine the sufficient degree of the polynomial fit functions by plotting the fit residuals and residual norm for increasing polynomial order.
 - Repeat the same procedure for different concentrations of the microgel matrices.
The number of PNIPAM microgel particles in the batch, and thus the final particle volume, is determined early in the reaction during the nucleation phase 20 Hydrophobic co-monomer dye methacryloxyethyl thiocarbamoyl rhodamine B influences the nucleation by reducing the particle number density in the batch. The decrease in particle concentration for two different initial NIPAM concentrations can be seen as increase in the mean final particle volume in the collapsed state with increasing dye concentration, shown in Figure 1. The increase in volume can be attributed to the hydrophobic comonomer dye, which promotes microgel nuclei aggregation at early reaction times, decreasing the particle concentration and increasing the final particle volume.
Results from a successful DLS measurements are shown in Figure 2. For the six smallest final particle volume batches linear dependence of the mean decay rate Γ2 on q2 and zero y-intercept within the error indicate that the particle size distributions for these batches are relatively narrow and a well-defined estimate for the mean diffusion coefficient can be obtained from the slope of the linear fit. Figure 3 shows a more complicated result from the two largest volume batches, where Γ2 deviates from the linear behavior in the intermediate q range. The non-linearity originates from the form factor (angular scattering pattern) minimum which coincides with these q values. 28 The phenomenon in question can be observed for particles with dimensions comparable to the wavelength of the incident laser radiation and even a moderate particle size distribution width. Determination of diffusion coefficient in this q range results in strongly biased results and therefore poses a notable risk of mischaracterization. In the specific case of Figure 3, Γ2 reflects the mean behavior again at high q, where all particle size fractions contribute more evenly to the total scattered intensity. A straightforward way to obtain a reasonable estimate for the mean diffusion coefficient is to exclude the intermediate Γ2 values from the linear fit. If the form factor of the particles are known, a more elaborate fitting method can be used 28.
Determining the hydrodynamic volume in the collapsed state without letting the samples cool down below the PNIPAM VPTT ensures that the non-gelled sol fraction has not detached from the particles. Therefore the volume in the collapsed state reflects the mass and the number of the particles during the polymerization, which is important if the fundamental properties of the precipitation polymerization are being investigated 20. Volume in the collapsed state also provides a good quantity for comparing different reaction parameters, because it is independent of the swelling properties and the fraction of non-gelled polymer in the particles regulated by the amount of cross-linker in the monomer mixture. Smaller size and higher scattering contrast in the collapsed state also facilitate the DLS characterization.
Static light scattering data measured at two wavelengths of 642 nm and 404 nm for the matrix and tracer particles are shown in Figure 4. Visual inspection of the angular scattering patterns reveals that the particles are well-defined: Multiple distinguished oscillations typical for spherical particles throughout the q indicates narrow polydispersity, in this case 7% and 6% for the tracer and matrix microgels, respectively. Smooth behavior at low q indicates that the samples are sufficiently diluted and no significant particle aggregation is present. The increase in scattered intensity at extreme q can be attributed to the scattering due to the back reflected beam from the inner cuvette wall. Inversion of the form factors of the matrix particles confirm typical microgel structure 29 with dense core and radially decaying density profile resulting from cross-linker copolymerization kinetics 30 (see inset). The dashed line shows the form factor of the reference hard sphere with the same mean radius of gyration as the matrix particles. The experimental form factor decays faster with q than the hard sphere form factor, which is typical for particles with fuzzy surface. In contrast, tracer particles exhibit unconventional microgel structure. This can be also seen from the reference hard sphere form factor, which shows that the experimental form factor initially does not decay faster than the reference. This result shows that the incorporating dye molecules to microgels can affect their structure, which must be accounted for in interpretation of the results.
The high uniformity of the synthesized particles is of high interest for studies of their diffusion at volume fractions around the glass transition temperature in order to accurately determine the evolution behavior in this regime 13, and compare it to hard particles 31. Therefore, a low fraction of labeled microgels were mixed with non-labeled microgel of comparable size. Excitation and emission spectra of microgel-incorporated dye molecules along with the excitation wavelength and filter configuration used in the emission path are presented in Figure 5. Absorbance and emission maxima of methacryloxyethyl thiocarbamoyl rhodamine B are close to excitation wavelength and fluorescence collection range, respectively, enabling high collection efficiency in the particle tracking setup. The time evolution of mean square displacement for tracer microgels in various non-labeled microgel matrix concentrations are shown in Figure 6 and Figure 7 in linear and logarithmic scale, respectively. At low microgel matrix concentrations the tracer particles diffuse rapidly. Even though they are only visible for a limited number of frames before moving out of the focus plane, a reasonably good estimation of their mean square displacements is possible. The linear increase of the mean square displacement with time indicates normal diffusion behavior for all lag times measured. However, for microgel concentrations close to the colloidal glass transition, i.e., 29-36 mg/ml, the temporal evolution of the mean square displacements becomes non-linear (see Figure 7). The behavior resembles the one of colloidal micrometer-sized PMMA particles as described by Weeks and Weitz 31 and can be related to the cage effect. As shown schematically in Figure 10, a labeled microgel in a dense matrix can diffuse rather freely within the cage. For that reason, the mean square displacement increases linearly in the first few milliseconds. However, since particles are trapped in transient cages formed by their neighbors, a collective rearrangement of the surrounding microgels is necessary for microgels to move further. This cage effect expresses itself in a rather shallow slope in the second range of Figure 7, and can be also confirmed by inspecting the particle tracks in Figure 9. At short lag times the particles jiggle in their cages, from which they escape just to get trapped again. At long lag times, the linear diffusion behavior is recovered. Cage effects can be analyzed using anomalous diffusion models where the temporal evolution of the (two-dimensionally detected) mean square displacement is expressed by a power law in time:  or in its logarithmic form
  with the anomaly parameter
  32. For normal diffusion, the anomaly parameter equals 1, subdiffusion is represented by values below 1. Figure 8 presents the temporal evolution of the anomaly parameter directly determined from the slope in the log-log-plot Figure 7. For the lower concentrations of microgels in our study, the anomaly parameter basically equals to 1. For lag times
  in the range of several seconds, the factor deviates from 1 towards lower values. This behavior is an artifact due to fact that the axial (z-)observation range in wide-field microscopy is limited to only a few micrometers. The narrow z-range biases the analysis for fast diffusion at long time intervals for rapidly diffusing tracers at low matrix concentrations. When increasing the microgel concentration, we find that the minimum of the anomaly parameter becomes much more pronounced and the transition to normal diffusion (
 ) appears later. This is a clear indication of the cage effect appearing for dense microgels systems when approaching their glass transition regime.
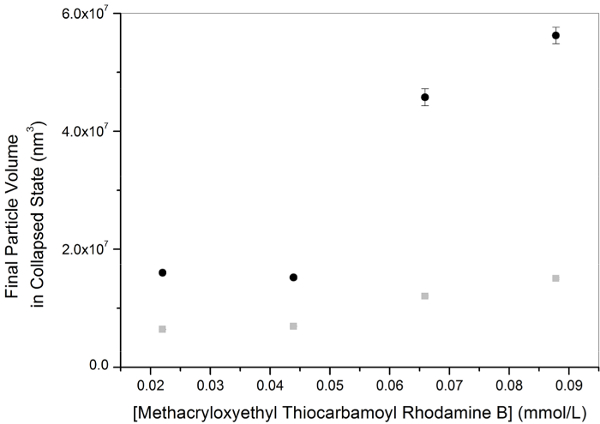
Figure 1: Single particle volume in collapsed state with initial dye concentration in the batch. Two different initial NIPAM concentrations were used, 57.5 mmol dm-3 (black circles) and 28.8 mmol dm-3 (grey rectangles). 1 mol-% of cross-linker was used. Initial KPS concentration was the same in all the batches at 1.56 mmol dm-3. Error bars denote the standard deviation. Please click here to view a larger version of this figure.
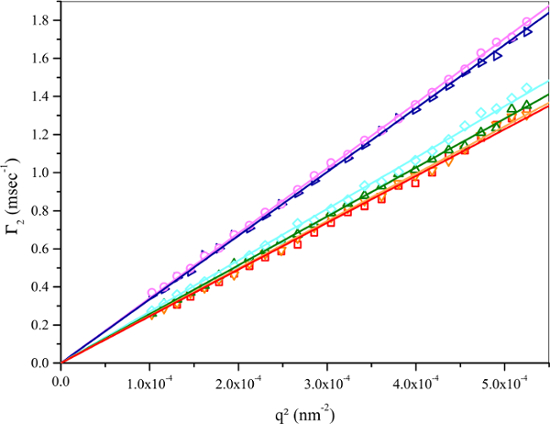
Figure 2: Decay rate with the square of the scattering vector magnitude for the four smallest volume microgel batches. Linear dependence of  on q2 and zero intercept indicate narrow particle size distribution and indicates that well-defined estimate of the mean diffusion coefficient can be calculated from the slope of the linear fit. NIPAM concentrations were 57.5 mmol dm-3 (red squares and orange inverted triangles) and 28.8 mmol dm-3 (rest of the symbols). Dye concentrations were 0.044 mmol dm-3 (red squares), 0.022 mmol dm-3 (orange inverted triangles), 0.088 mmol dm-3 (green triangles), 0.066 mmol dm-3 (cyan rhombuses), 0.044 mmol dm-3 (dark blue triangles), and 0.022 mmol dm-3 (pink circles). Please click here to view a larger version of this figure.
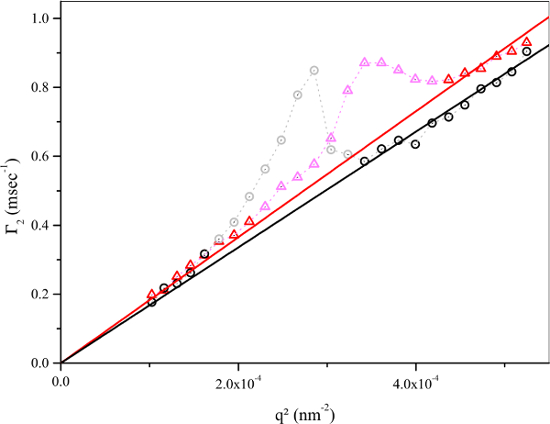
Figure 3: Decay rate with the square of the scattering vector magnitude for the two largest volume batches. Non-linear behavior of Γ2 with q2 in the central q range is caused by the changes in the intensity weighting of signal by different size fractions in the vicinity of the form factor minimum. NIPAM concentration in the both batches were 57.5 mmol dm-3, the dye concentrations were 0.088 mmol dm-3 (black circles) and 0.066 mmol dm-3 (red triangles). Faded symbols were excluded from the linear fit. Please click here to view a larger version of this figure.
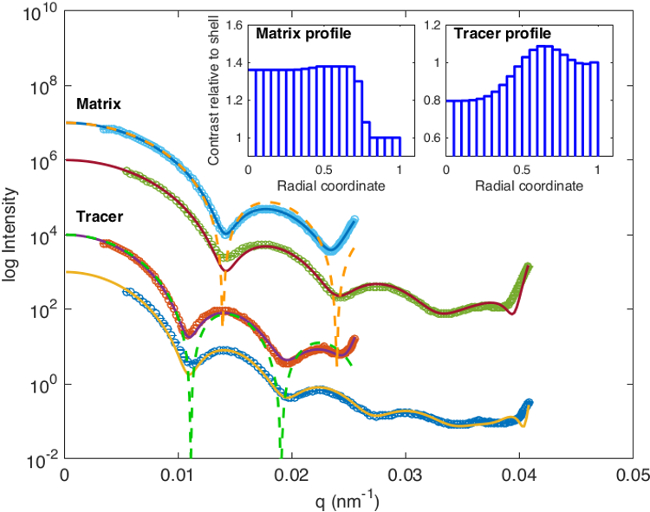
Figure 4: Form factors of the labeled tracer and unlabeled matrix particles. For both particles the form factor was measured at two wavelengths, 642 nm (light blue and red data points) and 404 nm (green and dark blue data points). Solid lines are global fits to the 642 nm and 404 nm datasets. Dashed lines show form factors of hard sphere reference particles with the same radii of gyration as matrix and tracer particles (orange and green dashed lines, respectively.) Insets show normalized particle density profiles from the core to the surface calculated, e.g., FitIt! Please click here to view a larger version of this figure.
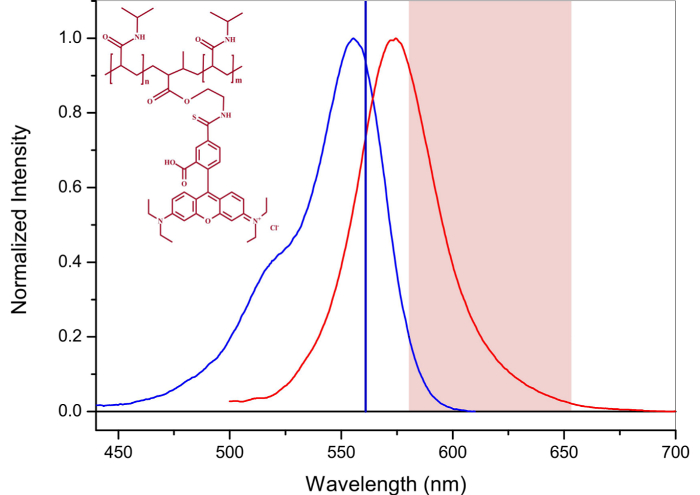
Figure 5: Excitation and emission spectra of fluorescence labeled microgel particles. Blue line denotes the excitation and red line emission spectrum. Solid vertical line is the excitation wavelength. Shaded area denotes fluorescence collection wavelength range. Please click here to view a larger version of this figure.
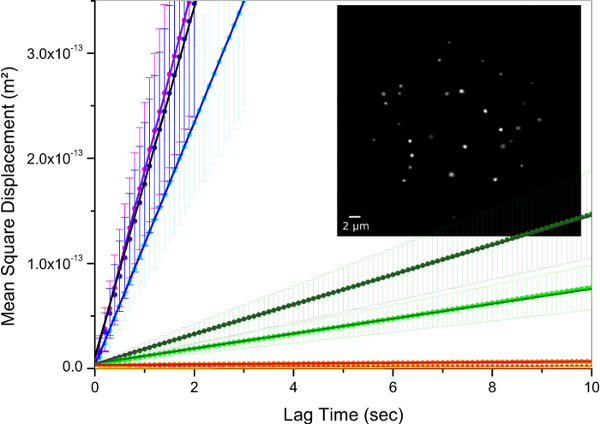
Figure 6: Mean square displacement with lag time for the tracer particles. Unlabeled matrix microgel concentrations were 15.56 mg/ml (left), 22.05 mg/ml, 28.28 mg/ml, 28.67 mg/ml, 30.32 mg/ml, 31.13 mg/ml and 35.35 mg/ml. Points and error bars denote experimental values and standard deviation, respectively. Solid lines are linear fits to the data points. Inset shows a wide-field fluorescence micrograph of tracer microgels at 35.35 mg/ml matrix concentration. Please click here to view a larger version of this figure.
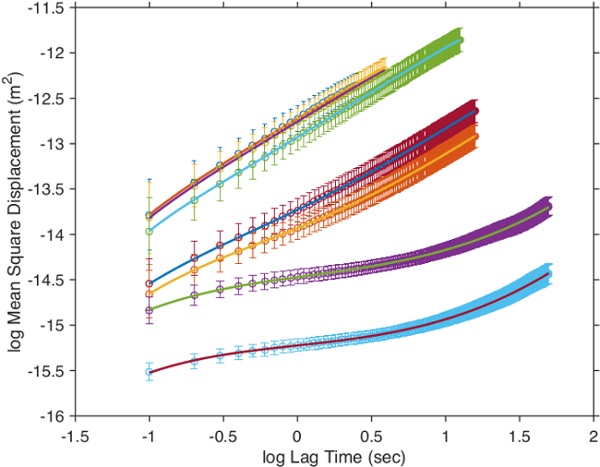
Figure 7: Mean square displacement with lag time for the tracer particles in logarithmic scale. Unlabeled matrix microgel concentrations were 15.56 mg/ml (left), 22.05 mg/ml, 28.28 mg/ml, 28.67 mg/ml, 30.32 mg/ml, 31.13 mg/ml and 35.35 mg/ml. Points and error bars denote experimental values and standard deviation, respectively. Solid lines are polynomial fits to the data points. Please click here to view a larger version of this figure.
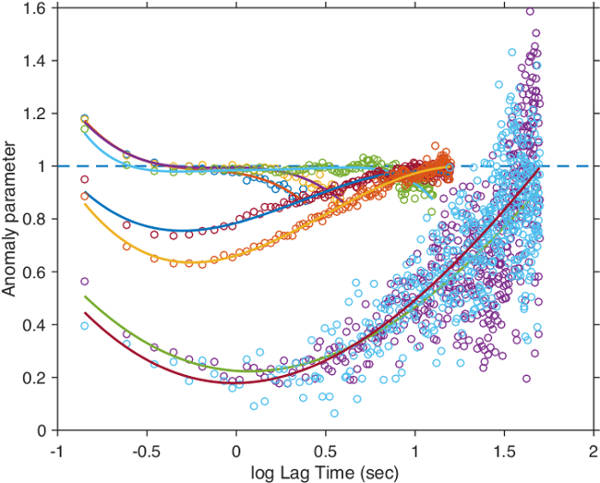
Figure 8: Anomaly parameters with lag time for tracer particles. Unlabeled matrix microgel concentrations were 15.56 mg/ml (left), 22.05 mg/ml, 28.28 mg/ml, 28.67 mg/ml, 30.32 mg/ml, 31.13 mg/ml and 35.35 mg/ml. Points represent derivatives estimated by finite differences and solid lines analytically calculated derivatives from the polynomial fits in Figure 7. Please click here to view a larger version of this figure.
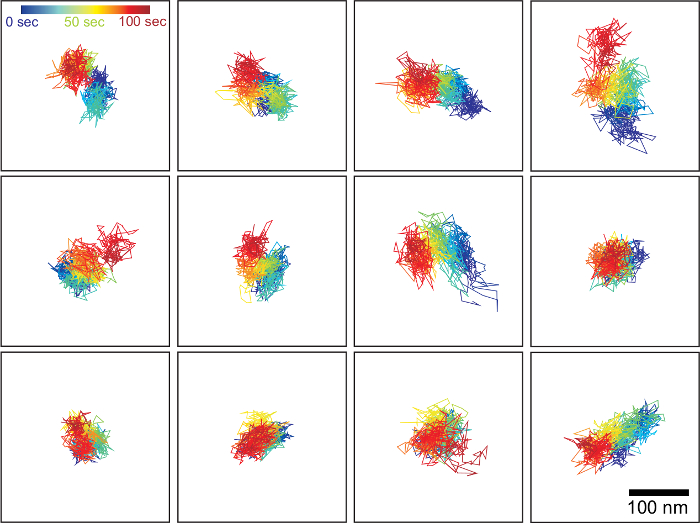
Figure 9: Particle tracks for 12 tracer microgels in dispersion with 35.35 mg/ml matrix concentration. Clustering of tracks to distinctive blobs results from the tracer's particles being trapped in transient cages formed by their unlabeled neighbors. Please click here to view a larger version of this figure.
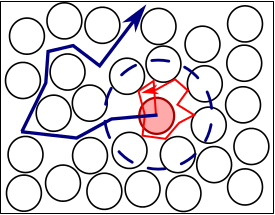
Figure 10: Schematic illustration of tracer microgel diffusion in concentrated unlabeled matrix microgel dispersion. Red trajectory denotes rapid diffusion of the tracers within the transient cages (blue dashed line) formed by the neighboring particles. Blue trajectory denotes long lag time diffusion enabled by the collective rearrangement of the transient cages. Please click here to view a larger version of this figure.
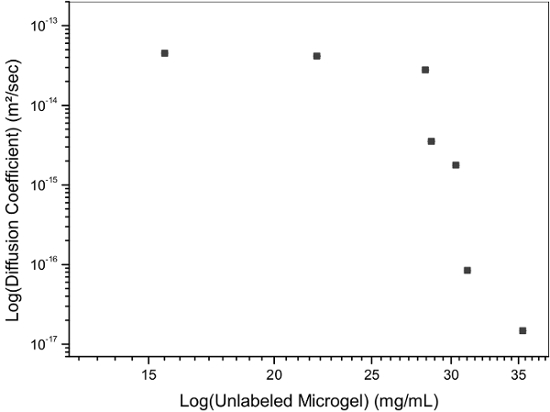
Figure 11: Long lag time diffusion coefficients with unlabeled matrix microgel concentration. At low matrix concentration the diffusion of the tracer microgels is not affected by the matrix particles. With increasing matrix microgel concentration the long time diffusion slows down orders of magnitude because diffusion requires collective rearrangement of the transient cages, where the tracers are trapped. Please click here to view a larger version of this figure.