Using the assessment procedure presented here, it is possible to carry out an effective assessment about ADHD symptomatology in order to design an accurate intervention and make recommendations for parents and teachers. Below are a series of representative results of a participant with ADHD and a participant without ADHD, which will allow professionals to see the differences between the two profiles.
Once clinicians had the informed consent from the families, a cognitive scale (WISC IV) was administered to the children in order to exclude those participants who present low or high capacities. The following steps then compiled an attentional profile of the children using the Continuous Performance Test and Activation Cortical Techniques (Q-EEG and nir-HEG). Figure 7 shows the results of children with and without ADHD in the Virtual Reality CPT. These results show the children with ADHD have more omissions and commissions errors, as well as higher motor activity and larger response times.
Similarly, Figure 8 shows the results obtained by the Traditional CPT showing how the child with ADHD presented larger percentages in omissions, commissions, response times and in the variability of the response. While the child without ADHD showed the best scores at the end of the tasks, the child with ADHD did not show improvement in any of the four blocks.
Figure 9 shows an example of the Cortical Activation collected by nir-HEG in a child affected by ADHD who obtained 24.5 percentage points below the average in Fp1 region.
Similarly, an example of the measures collected by Q-EEG in a child with ADHD (FP1 region) are shown in Figure 10 that evidences how the symptoms of ADHD cause a decreased in cortical activation (ratio beta/theta under 0.5).
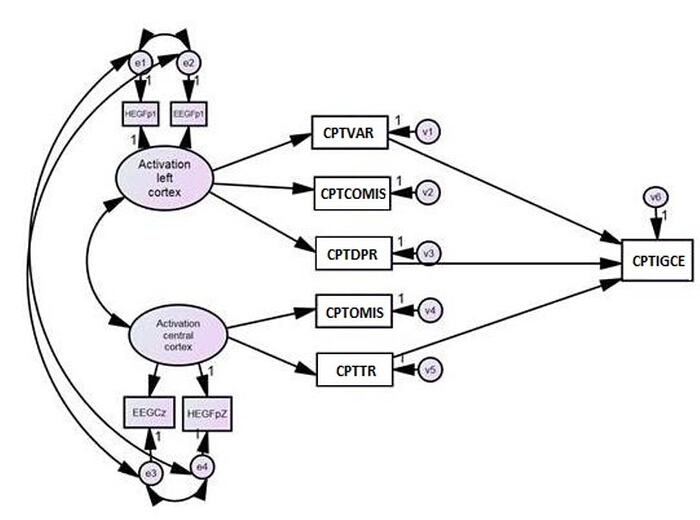
Figure 1. Model of ADHD assessment
Based on Hemoencephalograpy (nir-HEG), Quantified Electroencephalography (Q-EEG), and Traditional CPT (CPT). Variables included: HEG-Fp1(nir-HEG ratio from left pre-frontal cortex); HEG-FpZ (nir-HEG ratio from central pre-frontal cortex); Q-EEG-Fp1(beta-theta ratio from left pre-frontal cortex); Q-EEG-CZ (beta-theta ratio from central cortex); CPT-OMIS (omissions committed in CPT ); CPT-COMIS (commissions committed in CPT); CPT-VAR (Response Variability during CPT tasks); CPT-RT (Response Time obtained in CPT); CPT-DPR (D prime Index provided by CPT); ADHD-INDEX (ADHD Index provided by CPT). This model reflects a stronger association between activation (central and left prefrontal) and execution in ADHD children than their peers without the disorder. Low cortical activation (by QEEF) and blood oxygenation (by nir-HEG) in Fp1 region, are related to low performance in CPT. Similarly, normal levels of electrical activation and blood oxygenation are associated to normal results from CPT. Provided by Rodríguez et al.11. Please click here to view a larger version of this figure.
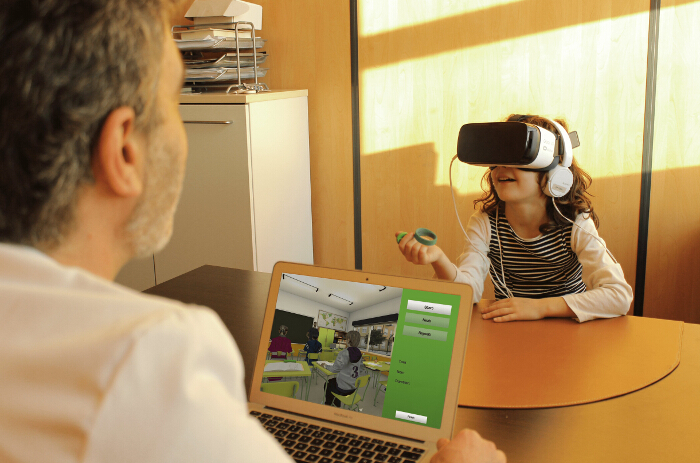
Figure 2. Head Mounted Display(HMD) glasses of the Virtual Reality CPT.
The image shows the Head Mounted Display (HMD) glasses, the headphones and the button which must be held with the dominant hand. The image also shows the virtual classroom which is shown to the participant via the glasses and to the therapist via the computer screen. Please click here to view a larger version of this figure.
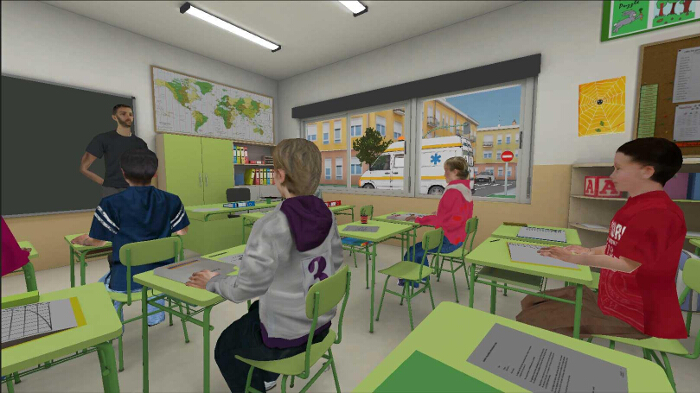
Figure 3. Virtual classroom provided by the Virtual Reality CPT.
Virtual classroom environment where the participant does the tasks which are explained by a virtual teacher. Please click here to view a larger version of this figure.
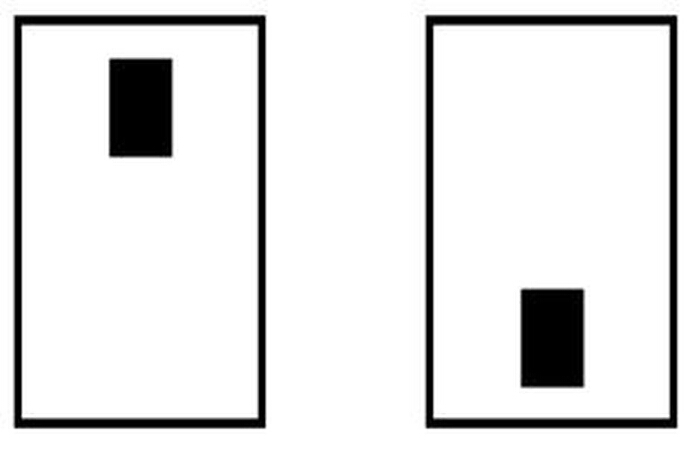
Figure 4. Images present in the Traditional CPT.
The right-hand picture shows the non-target stimulus and the left-hand picture shows the target stimulus. Please click here to view a larger version of this figure.
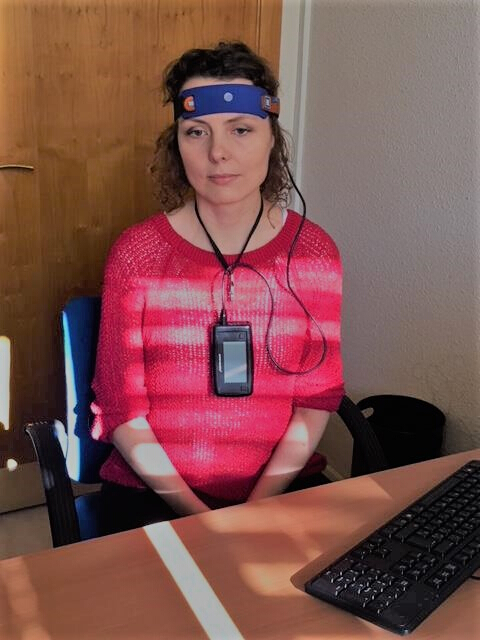
Figure 5. Participant wearing the nir-HEG band.
The image shows the nir-HEG band placed in the Fp1 region and the hardware connected.
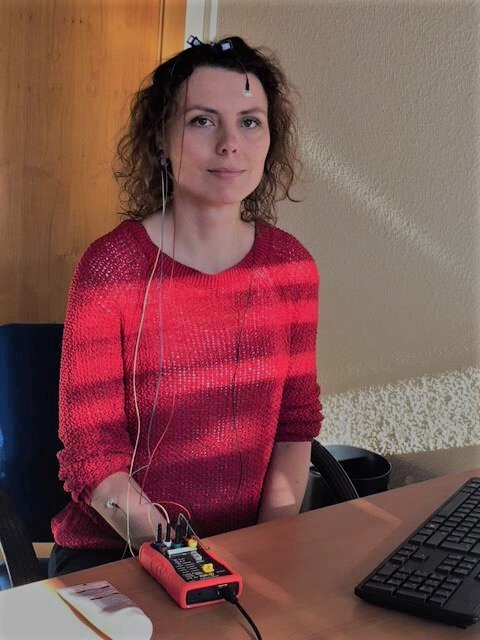
Figure 6. Participant with electrodes of Q-EEG.
The image shows the blue electrode in the Cz region and the red one in the Fp1 region. The control electrodes: black and white, have been placed on the participant´s left and right earlobes, applying electrode gel. Finally, an electromyogram was placed on the right forearm.
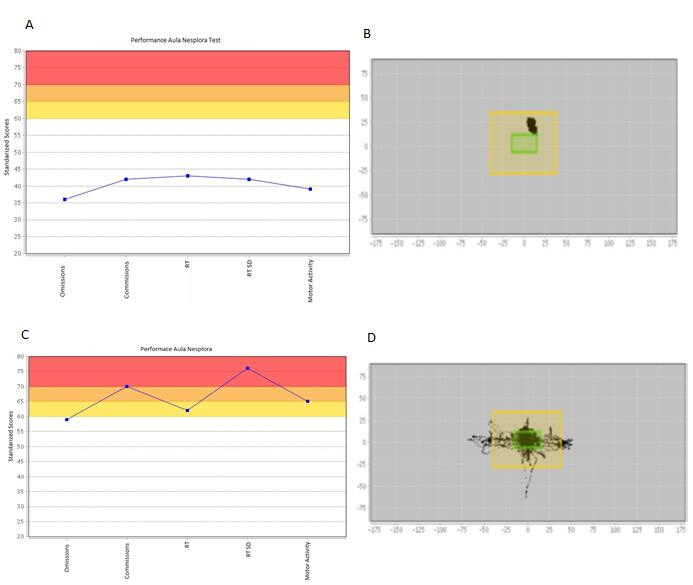
Figure 7. Performance and motor activity during the Virtual Reality CPT.
The Y axis shows the standardized scores from the Virtual Reality CPT (scores above 60 mean low performance in the variable studied and scores below 60 mean good performance of the variables studied. The X axis shows the different variables provided by the Virtual Reality test. The colors: yellow, orange and red, represent the grade of severity: low, medium and high in the performance of different variables. A and C illustrate the performance of a participant without ADHD (A) and a participant with ADHD (C).
Images B and D represent the subject´s head movement (motor activity) throughout the test. The green square refers to the blackboard and the yellow square represents the area in which the virtual blackboard can be inside the visual range for detecting the stimulus. If child move out of the yellow square, it makes impossible to perform the visual task properly. The dot diagram provides a graphic which represents the child's attention towards the blackboard and to the general task. Image B represents the motor activity in a participant without ADHD and image D represents the motor activity of a participant with ADHD.
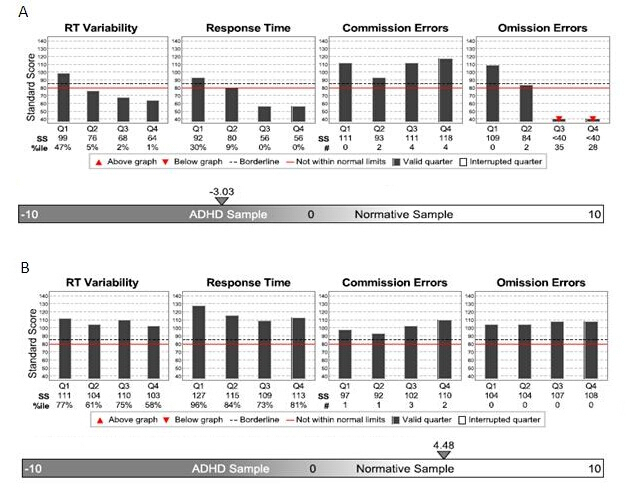
Figure 8. Profile provided by the Traditional CPT in the main variables.
Figure A represents the profile of a student with ADHD while Figure B shows the execution of a child with a performance similar to the normative group. The term "SS" refers to Standardized scores. Standardized scores below 80 represent low performance. "Q1"(25%), "Q2"(50%), "Q3"(75%) and "Q4"(100%) represent the four quartiles of the CPT tasks. This division is useful in order to see whether the subject's attention decreases during the activities or not.
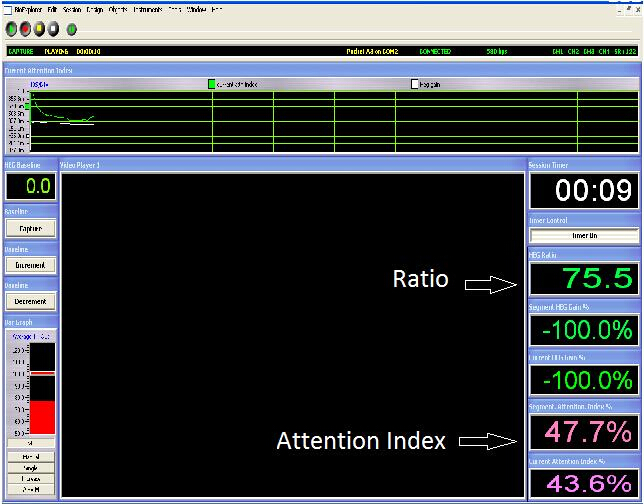
Figure 9. Activation measure with the nir-HEG.
This Figure shows the ratio indicator of the oxygenation of the blood at specific point (Fp1/Fpz) and an attention index which is expressed as percentage (a percentage below 50% represents a low attentional index).
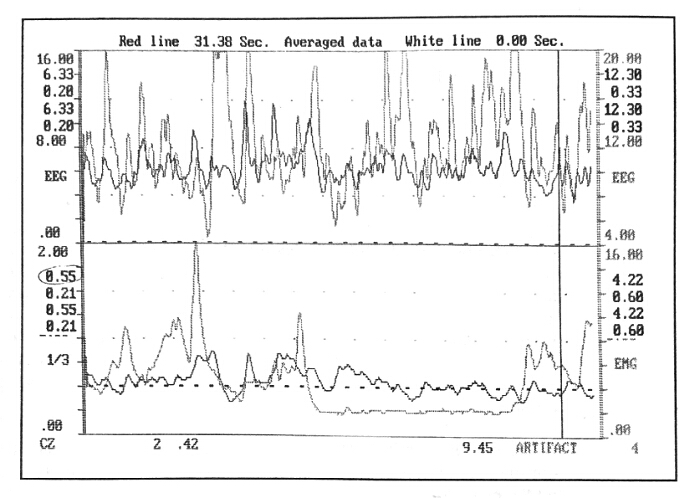
Figure 10. Cortical activation measures in FP1.
The Figures show the output from Q-EEG. The top part shows beta/theta waves measured individually, and the bottom part shows the beta/theta ratio in the Cz region and electromyography results from the right forearm. The CZ beta/theta ratio is shown on the left (in this case is 0.55), cortical activation is good when the ratio is above 0.50. The electromyography from the right forearm is used to ensure that the participant is relaxed at a muscular level, and is on the right (in this case the value of EMG is 4.22). Good values in electromyography are below 5.0. Please click here to view a larger version of this figure.