This protocol follows the guidelines of the institutional review board at the University of Texas at Arlington and conforms to the standards set by the latest version of the Declaration of Helsinki. Accordingly, written informed consent was (and should be) obtained prior to commencement of research procedures.
1. Instrumentation
NOTE: The following instrumentation description is based on the near-infrared (NIR) spectrometer and data acquisition system used in our lab (see Table of Materials). Thus, the instructions include steps that are necessary for the optimal function of these devices. These steps include the calibration of the NIR probe using the accompanying software and calibration phantom, and the application of a dark cloth to exclude ambient light. In the event that different data collection hardware and/or software are used, investigators should consult their own specific user manuals for calibration and ambient light considerations. Figure 1 illustrates the experimental set-up and instrumentation described immediately below.
- Instruct the subject to lie supine with their legs inside a lower body negative pressure (LBNP) chamber (Figure 1A), so that their belt line is approximately even with the opening to the LBNP box. For instructions on how to build a LBNP chamber, see References17.
- Place three electrocardiogram electrodes on the subject: two in an inferior, mid-clavicular location and one on the subject's left side medial to the iliac crest. This configuration provides the best results due to limited access to the lower limbs, instrumentation of the upper limbs, and arm movement during hand grip exercise.
- Place a non-invasive blood pressure monitor module on the subject's dominant wrist. Place the finger blood pressure cuffs on each finger and connect them to the module (Figure 1B). Ensure the finger blood pressure cuffs are properly calibrated according to the user's manual accompanying your device.
- Instruct the subject to grasp a hand grip dynamometer (HGD) with their non-dominant arm in a slightly abducted position. The arm should be comfortably positioned on a bedside table. The distance and angle of the HGD should be adjusted to allow for optimal grip strength with minimal arm movement (Figure 1C).
- Secure the HGD to a bedside table.
- Measure the maximum voluntary contraction (MVC) of the participant. Tell the participant that, when prompted, they must squeeze the HGD as hard as possible while only utilizing the muscles in the hand and forearm. Instruct the subject that they must refrain from recruiting their upper arm, chest, shoulder, or abdominal muscles when performing the maximum grip.
- Repeat Step 1.6 three times, separated by at least 60 s. Record the maximum force achieved (best of 3). This maximum force will be used to calculate the exercise intensity for skeletal muscle oxidative capacity and neurovascular coupling (below).
- Place a rapid-inflation cuff around the upper arm of the exercising hand. Connect the airline from the rapid inflation controller to the cuff.
- Identify the flexor digitorum profundus. Use a skin marker to demarcate the borders of the palpable muscle.
- Ensure that the NIR spectrometer is properly calibrated according to the user's manual included with your device. Clean the skin over which the NIR probe will be positioned with an alcohol prep wipe.
- Place the NIR probe over the center of the belly of the muscle (flexor digitorum profundus) and affix it securely to the forearm.
- Wrap the probe and forearm with dark cloth, minimizing interference from ambient light (Figure 1C, Figure 1D).
- When ready to perform the functional sympatholysis portion of the study, seal the subject into the LBNP chamber.
2. Skeletal Muscle Oxidative Capacity
NOTE: A representative data tracing illustrating the experimental procedure for measuring skeletal muscle oxidative capacity is depicted in Figure 2. This experimental approach has previously been validated against in vivo phosphorus MRS18 and in situ muscle respirometry19, and is gaining widespread acceptance20.
- Instrument the subject as indicated above (Instrumentation).
- Instruct the subject to lie still for 2 min while monitoring deoxyhemoglobin (HHb) and oxyhemoglobin (HbO2) via the NIR probe.
NOTE: This rest period allows the subject to recover from any movement artifact associated with the instrumentation process, and ensures stable baseline measurements. If after 2 min no significant fluctuations have occurred, the subject may be considered at a steady state, or resting baseline. - Prior to cuff occlusion, notify your subject that you will be inflating the cuff. Inflate the upper arm cuff at least 30 mmHg above systolic blood pressure for 5 min (i.e., suprasystolic). Instruct the subject to keep their arm as still and relaxed as possible both during cuff inflation and following cuff deflation.
NOTE: This 5 min brachial artery cuff occlusion protocol closely reflects the currently accepted clinical standard for vascular occlusion tests21,22,23,24,25. - Record the initial/baseline value (prior to cuff occlusion) and the nadir value of tissue saturation (StO2) during the cuff occlusion and determine the midpoint between these two values.
- Allow the subject to recover from the cuff occlusion and return to the resting baseline values. Once the subject has maintained a resting baseline for at least 1 full min, continue to the next step.
- Instruct subject to squeeze and maintain an isometric hand grip at 50% of their MVC. Encourage the subject to maintain their isometric contraction until the tissue desaturates by 50%. Upon achieving this value, tell the subject to relax their hand and inform them that no more exercise or movement is needed.
- Within 3 – 5 s following exercise cessation, administer the following rapid cuff occlusion series (one series = 1 inflation + 1 deflation), as previously established18:
Series #1 – 6: 5 s on/5 s off
Series #7 – 10: 7 s on/10 s off
Series #11 – 14: 10 s on/15 s off
Series #15 – 18: 10 s on/20 s off - After completing the 18th inflation/deflation series, instruct the subject to rest, allowing tissue saturation to return to initial baseline values. After these values have remained consistent for at least 2 min, repeat steps 2.4 and 2.5.
- Calculating Skeletal Muscle Oxidative Capacity
- Calculate the slope of change in the StO2for each of the individual 18 cuff occlusions, forming the monoexponential recovery points illustrated in Figure 2C.
- Fit the calculated data from 2.7 to the following monoexponential curve18,19,26
y = End – Δ x e-kt
NOTE: 'y' is the relative muscle oxygen consumption rate (mV̇O2) during cuff inflation, 'End' represents the mV̇O2 immediately following the cessation of exercise; delta ('Δ') signifies the change in mV̇O2 from rest to the end of exercise; 'k' is the fitting rate constant; 't' is time. Tau is calculated as 1/k.
3. Reactive Hyperemia
NOTE: A representative data tracing illustrating the experimental procedure for measuring reactive hyperemia is depicted in Figure 3.
- With the subject lying supine and instrumented as described above (Instrumentation), instruct the subject to lie as still as possible.
- Once the subject has achieved a consistent resting state, continue to record at least 1 min of baseline data and then rapidly inflate a blood pressure cuff on the upper arm to a suprasystolic pressure (30 mmHg above systolic blood pressure).
- At the 5 min mark, rapidly deflate the cuff while recording the hyperemic response.
- Continue recording for at least 3 min to capture the subject's recovery.
- Calculating Reactive Hyperemia
NOTE: The NIRS parameters calculated are depicted in Figure 3.- Calculate baseline StO2 as the average StO2 over 1 full min prior to the onset of arterial cuff occlusion.
- Determine the resting skeletal muscle metabolic rate as the desaturation rate (i.e., average slope) during cuff occlusion (defined as Slope 1)27,28.
- Calculate reactive hyperemia as follows:
a) the average upslope following cuff release (i.e., reperfusion rate, defined as slope 2), calculated from the moment of cuff release through the linearly increasing phase of the rebound trace;
b) the highest StO2 value reached after cuff release (denoted as StO2max);
c) the reactive hyperemia area under the curve (AUC); calculated from the time of cuff release to 1-, 2- and 3-min post cuff-occlusion (AUC 1-min, AUC 2-min, and AUC 3-min, respectively); and
d) the hyperemic reserve, calculated as the change in StO2 above baseline and reported as a percent (%) change. This value is calculated as the highest saturation achieved during the post-occlusive rebound minus the average saturation calculated in step 3.5.1 (see above).
NOTE: Large differences in baseline data will greatly affect the interpretation of the hyperemic reserve.
4. Functional Sympatholysis
NOTE: A representative data tracing illustrating the experimental procedure for measuring functional sympatholysis is depicted in Figure 4.
- Instrument the subject as indicated above (Instrumentation).
- Ensure an airtight seal in the LBNP chamber.
- With the subject lying still and at rest, collect 3 min of baseline data.
- At the 3 min mark, turn on the vacuum. Adjust the vacuum so that the pressure inside the LBNP chamber is between -20 and -30 mmHg. Allow the vacuum to run for 2 min while monitoring the subject's response.
- At the 5 min mark, turn off the vacuum and allow the subject to rest for 3 min.
- At the 8 min mark, initiate the voice prompt guiding the subject through the rhythmic hand grip exercise (20% MVC).
- Confirm that the subject is maintaining their squeeze throughout the entirety of each gripping phase and relaxing completely during between each repetition. Monitor their force output and confirm that they are achieving 20% MVC with each grip. Continue exercise until the 11 min mark.
- At the 11 min mark, turn on the vacuum encouraging the subject to continue their rhythmic exercise. Allow the vacuum to run from 11 – 13 min, then turn it off.
- Have the subject continue performing rhythmic hand grip exercise at 20% of their MVC for an additional 2 min. Upon exercise cessation, have the subject rest quietly and lie still.
- Calculating Functional Sympatholysis
- Normalize the change in oxyhemoglobin with LBNP to the total labile signal (TLS), determined during 5 min cuff occlusion:


- Calculate each event as the final 20 min average of each event.
- Calculate the exercise-induced attenuation of the oxyhemoglobin reduction:
- Normalize the change in oxyhemoglobin with LBNP to the total labile signal (TLS), determined during 5 min cuff occlusion:
Skeletal muscle oxidative capacity
Figure 2 illustrates a representative participant response during a NIRS-derived skeletal muscle oxidative capacity assessment. Panel A shows the tissue saturation profile during a 5 min arterial cuff occlusion protocol, handgrip exercise, and intermittent arterial occlusion during recovery from exercise. Panel B illustrates the expected tissue desaturation/re-saturation profile during the intermittent arterial occlusions during the recovery period. The rate of desaturation is directly proportional to the rate of muscle oxygen consumption, and is plotted in Panel C for each of the intermittent cuff occlusion periods. The calculated muscle oxygen consumption recovery data is then fit to a monoexponential curve and the recovery time constant derived. Using the same approach, a growing number of studies have evaluated skeletal muscle oxidative capacity for both health and disease, across a variety of muscle groups (Table 1).
Reactive Hyperemia
Figure 3 illustrates the NIRS-derived reactive hyperemia profile during a representative vascular occlusion test. This same approach has been used across a wide range of study populations and muscle groups with good success (Table 2). The data indicate that NIRS-derived reactive hyperemia not only provides valuable insight into vascular reactivity, but that the test is easily adaptable and clinically meaningful.
Functional Sympatholysis
Table 3 summarizes the existing literature using the exact same neurovascular coupling approach described herein to measure functional sympatholysis, showing both mechanistic and clinically relevant outcomes. In healthy control subjects, when LBNP is superimposed on mild handgrip, the reflex decrease in muscle oxygenation is attenuated by ~50% (Figure 4). Failure to attenuate sympathetic (vasoconstrictor) nerve activity during exercise, as with cardiovascular or neurological disease (Table 3), disrupts the balance between oxygen delivery and utilization, and causes functional muscle ischemia.
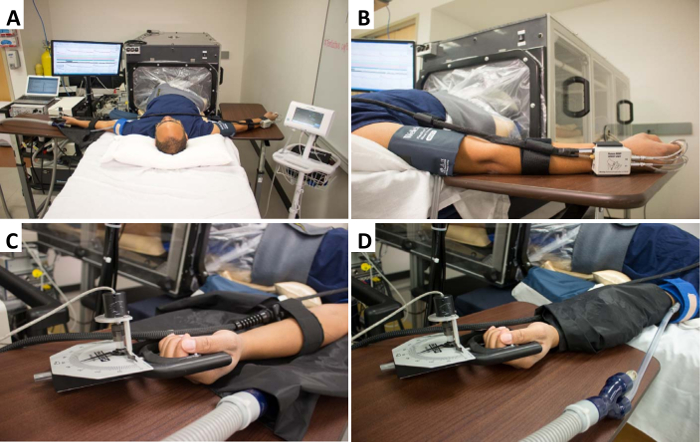
Figure 1. Experimental set-up and instrumentation. (A) Representative experimental set-up, with a typical subject lying supine on a bed with their legs inside the LBNP chamber and fully instrumented. (B) Dominant arm instrumented with a non-invasive beat-to-beat blood pressure device for beat-to-beat arterial blood pressure measurement, and a brachial artery blood pressure cuff for calibration and verification of the beat-to-beat system. (C) Instrumentation of the non-dominant arm. The hand is comfortably gripping a handgrip dynamometer (connected to data acquisition system), and the forearm muscle is instrumented with the near-infrared spectroscopy probe. (D) Once instrumented, the NIRS optodes are covered with a black vinyl cloth (to eliminate interference from ambient light). In addition, a rapid cuff inflation system is placed over the brachial artery. Please click here to view a larger version of this figure.
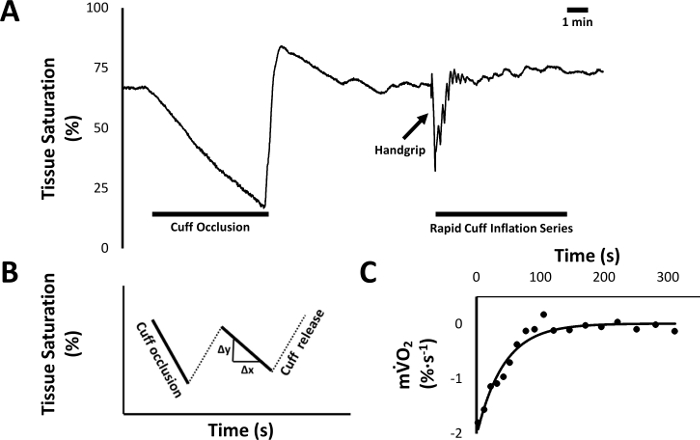
Figure 2. Skeletal muscle oxidative capacity protocol. (A) Raw data tracing from a representative subject measured via NIRS, showing tissue saturation (StO2) over time. After establishing a stable baseline, the brachial artery of the non-dominant arm is occluded for five min in order to establish the subject's desaturation reserve (difference between baseline StO2 and the nadir). After recovery from the occlusion, the subject is instructed to perform a 50% isometric handgrip, followed by 18 rapid cuff inflation series to assess muscle oxygen consumption recovery kinetics. (B) Data analysis is then performed offline by calculating the average slope of each cuff occlusion series following exercise; illustrated here using hypothetical cuff occlusion series data. (C) In order to calculate the recovery time constant of muscle oxygenation, the slope of each of the 18 rapid cuff occlusions (i.e., post-exercise muscle oxygen consumption, mV̇O2) from A is plotted against time and fit to a monoexponential curve. Please click here to view a larger version of this figure.
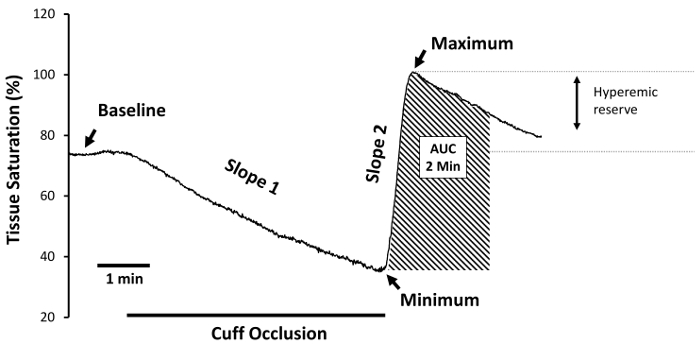
Figure 3. Reactive hyperemia experimental protocol. With the subject lying supine, record at least 1 min of baseline data, followed by 5 min of total arterial cuff occlusion, and at least 3 min of recovery following cuff release. Note the obvious overlap between the skeletal muscle oxidative capacity protocol (Figure 2) and this protocol. 'Baseline' defines the period of time prior to arterial cuff occlusion. 'Slope 1' defines the desaturation rate during cuff occlusion, and is regarded as a measure of resting skeletal muscle metabolic rate. The lowest StO2 value obtained during ischemia is defined as 'StO2 minimum', and is regarded as a measure of the ischemic stimulus to vasodilate. The tissue saturation reperfusion rate is denoted as 'Slope 2', and is an index of reactive hyperemia; as are StO2 maximum, and the reactive hyperemia 'area under the curve' (AUC). To gain insight into the hyperemic reserve, the StO2 maximum is expressed as a percent change from baseline. Please click here to view a larger version of this figure.
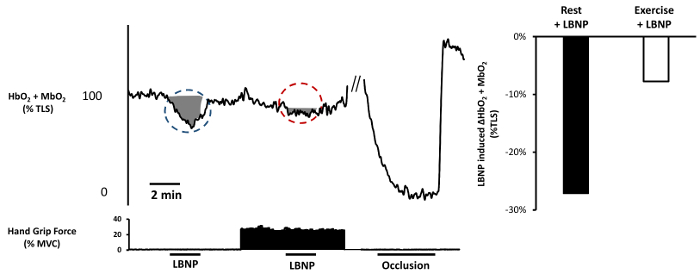
Figure 4. Functional sympatholysis experimental protocol. Left panel: Raw data tracing from a representative subject. With the subject lying supine in the LBNP chamber, allow 3 min of steady-state baseline data collection. Turn on LBNP to -20 mmHg for 2 min. Oxyhemoglobin/myoglobin should decrease in response to the reflex sympathetic vasoconstriction (blue circle, shaded area). Allow 2 min for recovery. Ask the subject to perform rhythmic handgrip exercise at 20% MVC (measured prior to data collection). After 3 min of rhythmic exercise, repeat -20 mmHg LBNP for 2 min while the subject continues to exercise, followed by 2 min of exercise without LBNP. The reduction in oxyhemoglobin/myoglobin should be significantly attenuated (red circle, shaded area). If not already performed, inflate a blood pressure cuff over the brachial artery of the exercising arm for 5 min to establish the subject's range of desaturation. Note that the shaded areas in the figure are only meant to highlight the changes in oxyhemoglobin/myoglobin; see protocol for details on how to analyze the outcome variables used to calculate sympatholysis. Right Panel: LBNP-induced change in oxyhemoglobin/myoglobin at rest and during handgrip exercise calculated from the data on the left. Please click here to view a larger version of this figure.
| Reference/Data Set | Study Population | Sample size (n) |
Age of participants (years ± SD) |
Tau (τ) (s) |
Muscle group | NIRS Variable reported | Device |
| Brizendine et al. (2013) | Endurance Athletes | 8 | 25 ± 3 | 19 | Vastus lateralis | Hbdiff/total blood volume | Continuous wave (Oxymon MK III) |
| Ryan et al. (2014) | Young, healthy | 21 | 26 ± 2 | 55 | Vastus lateralis | HHb | Continuous wave (Oxymon MK III) |
| Southern et al. (2015) | Elderly | 23 | 61 ± 5 | 63 | Wrist flexor | Hbdiff | Continuous wave (Oxymon MK III) |
| Elderly + Heart Failure | 16 | 65 ± 7 | 77 | Wrist flexor | Continuous wave (Oxymon MK III) |
||
| Adami et al. (2017) | Smokers with normal spirometry | 23 | 63 ± 7 | 80 | Medial forearm | Tissue saturation index (TSI) | Continuous wave (Portamon) |
| COPD Gold 2-4 | 16 | 64 ± 9 | 100 | Medial forearm | Continuous wave (Portamon) |
||
| Erickson et al. (2013) | Spinal cord injury | 9 | 43 ± 11 | 143 | Vastus lateralis | HbO2 | Continuous wave (Oxymon MK III) |
Table 1: Summary of previously published reports across the health continuum using near-infrared spectroscopy to measure skeletal muscle oxidative capacity.
| Reference | Study Population | Muscle Group | Reported Outcomes | Outcome Value |
| Lacroix, J Biomed Opt, 2012 | Healthy Males | Forearm | Peak Oxyhemoglobin | 28.05 ± 3.15 μM |
| Peak Total Hemoglobin | 10.56 ± 1.80 μM | |||
| Increase Rate to Peak HbO2 | 0.75 ± 0.22 μM/s | |||
| Increase Rate to Peak Total Hb | 0.52 ± 0.16 μM/s | |||
| Kragelj, Ann Biomed Eng, 2001 | Peripheral Vascular Disease | Forearm | Oxygen Consumption | 0.68 ± 0.04 mL/min |
| Time to Peak | 153 ± 16 s | |||
| Maximal Absolute Change in HbO2 | 2.93 ± 0.22 μM/100 mL | |||
| Suffoletto, Resuscitation, 2012 | Post-Cardiac Arrest ICU Admittants | Thenar Eminence | Desaturation Rate | -5.6 ± 2 %/min |
| Resaturation Rate | 0.9 ± 0.6 %/sec | |||
| Dimopoulos, Respir Care, 2013 | Pulmonary Artery Hypertension | Thenar Eminence | Baseline Saturation with 21% O2 | 65.8 ± 14.9 % |
| O2 Consumption Rate with 21% O2 | 35.3 ± 9.1 %/min | |||
| Reperfusion Rate with 21% O2 | 535 ± 179 %/min | |||
| Doerschug, Am J Physiol Heart Circ Physiol, 2007 | Organ Failure & Sepsis | Forearm | Baseline Saturation | 84% |
| Reoxygenation Rate | 3.6 %/s | |||
| Mayeur, Crit Care Med, 2011 | Septic Shock | Thenar Eminence | Baseline Saturation | 80 ± 1.0 % |
| Desaturation Slope | -9.8 ± 3.7 %/min | |||
| Recovery Slope | 2.3 ± 1.4 %/sec | |||
| McLay, Exp Physiol, 2016 | Healthy Males | Tibialis Anterior | Baseline Saturation | 71.3 ± 2.9 % |
| Minimum Saturation | 44.8 ± 8.6 % | |||
| Desaturation Slope | -0.1 ± 0.03 %/s | |||
| Recovery Slope | 1.63 ± 0.5 %/s | |||
| Peak Saturation | 82.6 ± 2.3 % | |||
| McLay, Physiol Rep, 2016 | Healthy Males | Tibialis Anterior | Baseline Saturation | 71.1 ± 2.4 % |
| Minimum Saturation | 46.2 ± 7.5 % | |||
| Peak Saturation | 82.1 ± 1.4 % | |||
| Recovery Slope | 1.32 ± 0.38 %/s |
Table 2: Summary of previously published reports across the health continuum using near-infrared spectroscopy to measure reactive hyperemia.
| Reference | Study Population | % Attenuation |
| Nelson MD, J. Physiol, 2015 | Healthy | -57 |
| Becker Muscular Dystrophy | -13 | |
| Vongpatanasin, J. Physiol, 2011 | Healthy | -93 |
| Hypertension | -14 | |
| Fadel, J. Physiol, 2004 | Pre-Menopause | -84 |
| Post-Menopause | -19 | |
| Sander, PNAS, 2000 | Healthy | -74 |
| Duchenne Muscular Dystrophy | .+7 | |
| Nelson MD, Neurology, 2014 | Healthy | -54 |
| Duchenne Muscular Dystrophy | -7 | |
| Price, Hypertension, 2013 | Hypertension Pre-Treatment | -52 |
| Hypertension Post-Nebivolol Treatment | -97 | |
| Hansen, J. Clin. Invest., 1996 | Healthy Exercise at 20% MVC | -92 |
| Healthy Exercise at 30% MVC | -125 |
Table 3: Summary of previously published reports across the health continuum using near-infrared spectroscopy, in combination with lower body negative pressure and handgrip exercise, to assess functional sympatholysis.