1. Fabrication of Soft Silicone Substrate
- Weigh out 1.75 g of the A component and 1.75 g of the B component (A:B = 1:1) from the soft silicone elastomer kit using (polystyrene) weighing trays.
- Add the A component to the B component in the weighing tray and mix them together for 5 min using an appropriate applicator stick.
- Add the above mixture to a 35 mm Petri dish. Allow the mixture to spread evenly across the Petri dish for a couple of minutes.
Note: The choice of the Petri dish diameter and the amount of soft silicone will determine the soft silicone thickness. Here, the thickness will be around 3.5 mm; more about choosing the elastomer thickness in the Discussion section. - Place the Petri dish with the silicone mixture, with the lid off, in a vacuum chamber for 15 min to remove any air bubbles. During this time, pre-heat a hot plate to 70 °C.
- Once the hot plate reaches 70 °C, place a glass slide on it and then place the Petri dish with the silicone mixture on the glass slide. Let the silicone cure at 70 °C for 30 min. Do not place the polystyrene dish directly on the hot plate, as the Petri dish may melt.
2. Coupling of Fluorescent Microbeads to the Soft Silicone
- Place the cured soft silicone (in the uncovered Petri dish) in a deep UV chamber (an enclosure with a deep UV lamp of light wavelengths of 185 and 254 nm). Expose the soft silicone sample (~5 – 10 cm away from the UV lamp) to deep UV light for 5 min.
- While the silicone is being exposed to deep UV light, proceed with steps 2.2 – 2.6 below. After the deep UV exposure, degas the deep UV chamber for at least 5 min before retrieving the sample.
- In the meantime, weigh out 19 mg of 1-ethyl-3-(3-dimethylaminopropyl) carbodiimide (EDC) in a 1.5 mL microcentrifuge tube and add 500 μL of deionized water (DI) water to it. Dissolve the EDC by gently shaking the tube.
- In a separate 1.5 mL microcentrifuge tube, weigh out 11 mg of N-hydroxysulfosuccinimide (sulfo-NHS), add 500 μL of DI water to it, and dissolve the sulfo-NHS by gently shaking the tube. Then, combine the EDC and sulfo-NHS solutions in a single microcentrifuge tube.
- To this EDC/sulfo-NHS solution, add 30 μL of 0.44 μm diameter red (or any other fluorescence color based on the filter cubes available in the fluorescence microscope) carboxylate modified fluorescent microbeads (with a 1% w/v stock concentration).
- To the EDC/sulfo-NHS/bead mixture, add 0.02 mg of collagen I (from a rat tail, stock concentration of 4 mg/mL in 0.02 M acetic acid) to obtain a concentration of about 0.02 mg/mL.
- Vortex the EDC/NHS/bead/collagen I mixture briefly to ensure that the beads are evenly dispersed throughout, before coupling.
- Pipette 1 mL of the EDC/NHS/bead/collagen I mixture on a piece of parafilm placed on top of another shallow, flat lid (of smaller diameter). Invert the Petri dish with soft silicone on this mixture so that the soft silicone surface contacts the mixture but does not directly touch the surface of the smaller Petri dish lid below. To raise the inverted Petri dish, use one or two glass slides under either side of the inverted Petri dish spacers.
Note: Please refer to Figure 1 to see how step 2.7 is performed. - Cover the sample with aluminum foil and incubate it at room temperature for 30 min.
- Remove the Petri dish with soft silicone and set it upright (silicone-side up).
- Wash the soft silicone surface with phosphate-buffered saline (PBS) by adding 2 mL of PBS (pH 7.4) to the dish. Let it sit for a couple of minutes. Aspirate off the PBS and wash the silicone again with 2 mL of PBS. Let the silicone cure further for about a day. For that reason, place the soft silicone sample in PBS at 37 °C overnight.
3. Measurement of Silicone Stiffness with Sphere Indentation using a Widefield Fluorescence Microscope
- Retrieve the Petri dish with soft silicone and ensure that it contains at least 1 mL of PBS to have the silicone surface several mm below the liquid surface.
- Using pointed tweezers, drop five 1 mm zirconium sphere indentors on the soft silicone. Immerse the spheres into the liquid medium and drop them, away from the edges of the silicone layer and at least 5 indentor diameters away from the location of the other indentors.
Note: When dropped above the liquid surface, the spheres may fail to enter the liquid medium (float) due to the liquid medium’s surface tension. - Place the Petri dish with soft silicone on the microscope stage so that it is possible to image through the Petri dish base.
- Using phase imaging with a 10X objective (such as a dry 10X objective of NA 0.30), locate and bring a sphere indentor into focus.
- Take a phase image of a part or the whole of the indentor and save this image. Use a tile scan if available. If the indentor has any visible defects, discard and replace it with another indentor.
- Under live phase imaging, pan to the left of the indentor’s edge so that the left edge of the frame is at least a distance of ~1.5 R from the indentor center. Ensure that the center of the indentor remains visible on the right side, close to the right edge of the image frame. Take a phase image and save it.
- Switch the microscope light source to the illumination for the red fluorescent channel. With the x– and y-coordinates unchanged (the x–y position of the indentor center within but near the right edge of the frame), focus down (decrease Z) until the red fluorescent microbeads under the sphere indentor’s center just go out of focus.
- Take a z-stack with an image for every z-increment of 0.5 µm till the microbeads in the top layer of the silicone far from the indentor (near the left edge of the imaging frame) go out of focus.
- Repeat steps 3.4 – 3.8 with the other indentors on the sample.
4. Calculating the Silicone’s Stiffness (Young’s Modulus)
- Open the phase image of the indentor using ImageJ, click on the line tool, and measure the indentor’s diameter in pixels. Click and hold on a point on the indentor edge, move the cursor to a diametrically opposite point on the edge and note the length in pixels displayed on the status bar of the ImageJ main window before releasing the cursor.
- Ensure that the unit of length is set to pixels by clicking Analyze | Set Scale and checking the Unit of length.
- Convert the indentor’s radius in pixels to μm by taking into account the objective magnification and the CCD camera pixel size (R in μm = R in pixels x the CCD camera pixel size in μm / the objective magnification).
- Open the red channel z-stack of microbead images (if the microbeads are red fluorescent) in ImageJ by clicking on File | Import | Image Sequence and select any image in the stack and click OK to open the stack.
Note: F1 is the frame number at which the microbeads under the indentor center are in the best possible focus and F2 is the frame number at which the microbeads (at a region of ~1.5 R away from the bead center) near the left edge of the frame are in the best possible focus. The z-difference between the two frames is the indentation depth δ.- Using the line tool in ImageJ, draw a line across a well-defined microbead in the image. Click on Analyze | Plot Profile and click on the Live button to obtain the updated line scan intensity across the bead while selecting different frames. The frame that gives the highest value of the maximum intensity can be chosen as the frame in focus.
- Since the z-increment between the frames in the z-stack is 0.5 μm, calculate the indentation depth in μm as δ = (F2-F1) x 0.5.
- Calculate the force exerted on the gel by the indentor due to its weight (minus the opposing buoyant force), that is, the indentation force F, as the volume of the indentor x (the density of the indentor – the density of the liquid medium) x the acceleration due to gravity. Use the equation F = (4/3) x 3.142 x (R3) x (ρindentor – ρmedium) x g where R is the radius of the indentor, ρindentor is the density of the indentor, ρmedium is the density of the liquid medium and g is the acceleration due to gravity (9.81 m/s2). Express all quantities on the right-hand side in SI units to obtain F (in N).
- Calculate the Young’s modulus (E) of the silicone using a modified11 Hertz model12 equation:
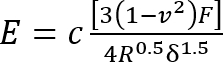
Where:
c = a correction factor that modifies the Hertz model expression that follows it;
v = Poisson’s ratio of the silicone gel (taken as 0.5 as for incompressible materials7);
F = the indentation force;
R = the indentor radius; and
δ = the indentation depth.
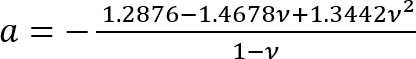
Express all quantities on the right-hand side in SI units to obtain E in Pa.- Calculate the correction factor c as follows3:

Where:
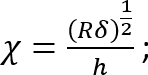
 ; and
; and
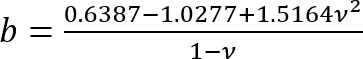 .
.
It should be noted that this correction factor is specifically to be used only when the soft silicone adheres well to the Petri dish (or stiff silicone) underneath it (which is the case here). - Calculate the height h of the soft silicone layer based on the amount of silicone added and the Petri dish diameter. Alternatively, obtain h directly by determining the z-coordinate of the top and bottom surfaces of the silicone layer by phase imaging (minor impurities come into focus at either surface). Note that for a large h (h2 > Rδ), the correction factor c is close to 1.
- Calculate the correction factor c as follows3:
- Repeat steps 4.1 – 4.4 for each indentor. Average the Young’s modulus obtained from each indentor to obtain the mean Young’s modulus for the silicone sample.
Using the protocol detailed above, we prepared soft silicone in a 35 mm Petri dish, cured it at 70 °C for 30 min and coupled fluorescent microbeads (and collagen I) to the top surface as schematically depicted in Figure 1. Deep UV has been used previously for the eventual protein coupling to substrates13. Note that (I) the curing conditions used here are specific to this soft silicone and (II) the indentation measurement is performed on the next day as the soft silicone is expected to cure a bit further over the course of a day.
Various parameters that characterize the spherical indentation of the silicone surface are shown in Figure 2A. Phase imaging is used to capture either (I) the entire image of the indentor as shown in Figure 2B (using image stitching, if necessary) or (II) part of the image of the sphere. The only parameter to be derived from the indentor's image is its diameter. For example, for the indentor we used with the 1:1 soft silicone in this protocol, different individual indentors from the same lot had diameters that ranged from 950 µm to 1,200 µm with a mean value of 1,037 µm and a standard deviation of 47 µm (8 indentors). Note that the diameter measured for a particular indentor (rather than the mean diameter for many indentors) should be used for the stiffness calculation for the indentation-induced by that particular indentor.
Fluorescent images of the microbeads in the top surface of the silicone are taken at an x–y frame position so that the region under the indentor is in the far-right part of the frame. The region in the far-left part of the frame is chosen to be the region away from the indentor as shown in Figure 3. Z-stack images of the regions under the indentor and away from the indentor are shown in Figure 3as well. For the 1 mm diameter zirconium indentor used with the 1:1 soft silicone, the z-values at which the 2 regions come into focus differed by about 20 µm (δ). This is much smaller than the thickness of the soft silicone, which was around 3,500 µm. Using the density (4.66 g/cm3) of the zirconium indentor (which is actually made of a mixture of zirconium dioxide and silicon dioxide) and the density of the liquid medium (for PBS: 1.01 g/cm3), the net force exerted on the silicone can be computed. For the case under consideration, it was in the 20 – 25 µN range. The Young's modulus we computed for the 1:1 soft silicone was 7.2 ± 2.4 kPa (from 28 locations pooled from 6 independent samples). The representative results for other A:B ratios for the same soft silicone (specified in the accompanying Table of Specific Reagents) are given in Table 1. Finally, to validate the sphere indentation method that uses a widefield microscope as we described in this protocol, we also measured the Young's moduli of a polyacrylamide gel we characterized with a rheometer to have a Young's modulus of 21 ± 3 kPa. Using the sphere indentation method of this protocol using a widefield microscope, polyacrylamide gel of the same composition was found to have a Young's modulus of 22.1 ± 4.2 kPa, indicating a good agreement10. Caveats to pay attention to while carrying out these measurements are addressed in the Discussion section.
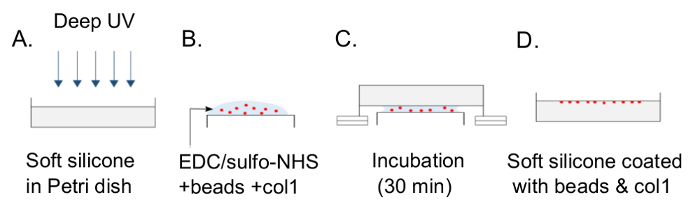
Figure 1: Schematic depiction of the procedure for coupling fluorescent microbeads to the top surface of soft silicone. (A) The soft silicone that has been cured is exposed to deep UV light for 5 min. (B) A mixture of EDC, sulfo-NHS, beads, and collagen I in water is pipetted down onto a piece of parafilm placed on top of a lid of smaller diameter. (C) The soft silicone sample is inverted on this mixture so that it is in contact with the liquid but not with the top surface of the smaller lid underneath. Two glass slides on either side, under the Petri dish, act as spacers. (D) After washing the sample with PBS, the soft silicone surface coated with fluorescent microbeads is ready for the stiffness measurement. Please click here to view a larger version of this figure.
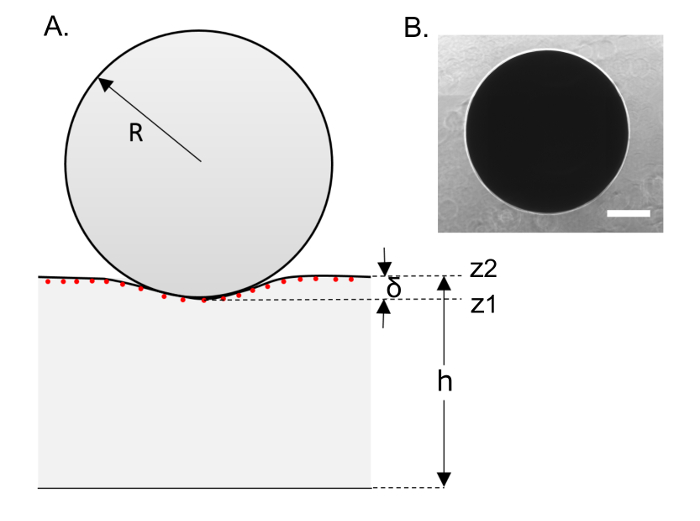
Figure 2: Schematic illustration of sphere indentation of the soft silicone surface. (A) This schematic depiction shows a spherical indentor on the surface of a soft silicone sample. Various parameters of interest are indicated. (B) This panel shows an image of a 1 mm indentor (on a soft silicone sample) obtained via phase imaging. The scale bar indicates 250 µm. Please click here to view a larger version of this figure.
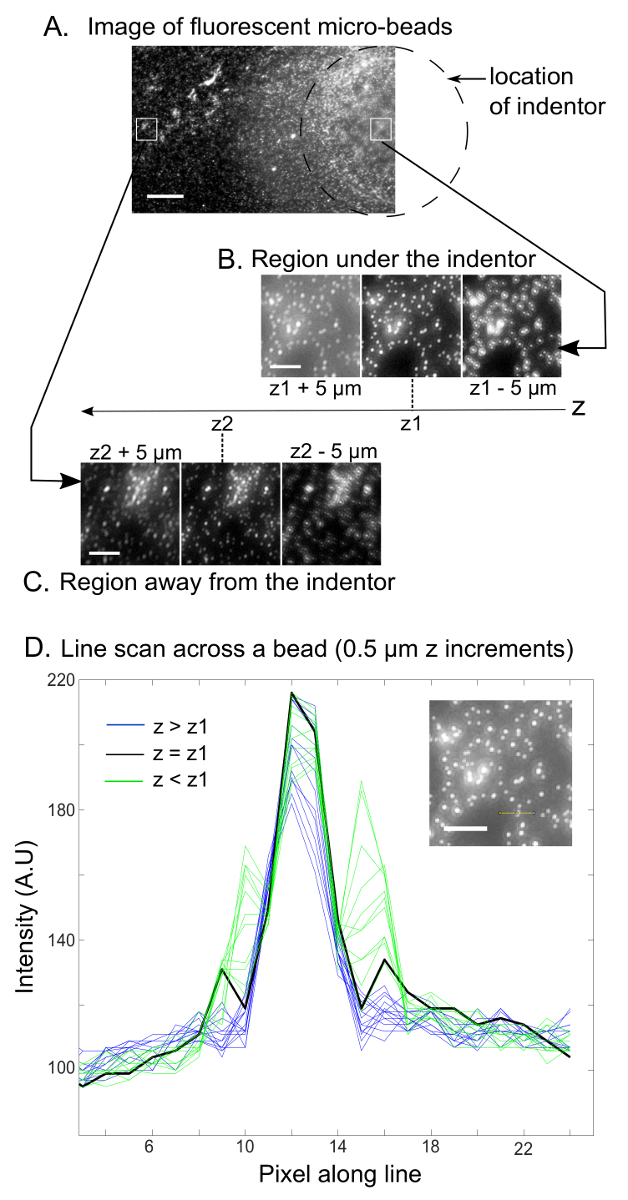
Figure 3: Bead image acquisition and determination of the in-focus image. (A) This fluorescence image shows microbeads on the top surface of the soft silicone sample and the desired x–y location of its frame relative to the indentor (dotted line). The scale bar indicates 150 µm. Panels B and C show z-stack fluorescence images of regions on the soft silicone surface (B) under the indentor and (C) away from the indentor (boxed regions in the top image). The indicators z1 and z2 correspond to the z-values at which the region under the indentor and the region away from the indentor are in focus, respectively. The scale bars indicate 20 µm. The monochrome images shown are those obtained in the red channel since nominally pink microbeads were used whose excitation and emission profiles fit the red channel. (D) This panel shows an intensity line scan across a micro-bead (shown in the inset image with a yellow line across it) as the focus is varied in z-increments of 0.5 µm. The focus (z-value) corresponding to the in-focus image can be objectively chosen based on the z-value corresponding to the line scan with the highest maximum intensity. The scale bar in the inset indicates 20 µm. Please click here to view a larger version of this figure.
| Silicone elastomer* A:B | Young's Modulus** (kPa) |
| 1:1 | 7.2±2.4 |
| 4:7 | 37.6±3.9 |
| 1:2 | 64.1±6.9 |
| *specified in the accompanying Table of Specific Reagents/Equipment ** as measured with the sphere indentation method using a widefield microscope as detailed in this protocol |
|
Table 1. Young's modulus of soft silicone (for the particular silicone specified in the Table of Specific Reagents/Equipment) for different compositions as measured using the protocol detailed here. Values for the ratio of the two mixed components A:B (and the corresponding number of measurements) are 1:1 (28), 4:7 (13), and 1:2 (8).