1. Alkaline Hydrolysis and Strand-specific Southern Blot (Figure 1)
2. Measuring Mutation Rate and Specificity in S. cerevisiae Strains
Treatment of genomic DNA with alkali followed by alkaline gel electrophoresis allows for semi-quantitative detection of the DNA fragmentation due to the abundance of stably incorporated ribonucleotides. Figure 2 shows the gel images of yeast genomic DNA treated with or without KOH5. The M644L variant of Pol2, the catalytic subunit of Polε, has reduced the ability to incorporate ribonucleotides while the M644G mutant incorporates more ribonucleotides than the WT polymerase. As detailed in the protocol, the alkaline gel can be further probed by strand-specific Southern blot analysis. With the knowledge of the location of the probed genomic site relative to its adjacent origins, we can selectively probe ribonucleotides incorporated into the nascent leading or lagging strands. Figure 3 shows the Southern blot results probing the URA3 reporter gene inserted in two opposite orientations close to an early-firing replication origin, ARS30616. By using leading strand-specific probes, we observe the DNA fragmentation pattern caused by alkali-cleavage at ribonucleotides in nascent leading strand DNA in a WT strain and in strains expressing the variants of polymerases α, δ, and ε that are promiscuous for ribonucleotide incorporation.
Using a fluctuation experiment, we can measure the mutation rates of yeast strains containing reporter genes. Figure 4 shows the mutation rates at the URA3 and CAN1 loci of strains expressing WT polymerase or the pol2-M644G mutant with or without functional RNase H2. The lack of RNase H2 causes a moderate increase in overall mutation rates in the both backgrounds. However, closer examination of mutation specificity reveals that in strains lacking RNase H2 (Figure 5), there is a strong increase in the mutation rate for short deletions, particularly in tandem repeat sequences. Figure 5A compares the mutation specificity in WT and rnh201Δ strains and Figure 5B displays the mutational effect of further elevated ribonucleotide incorporation into the nascent leading DNA strand by Pol ε.
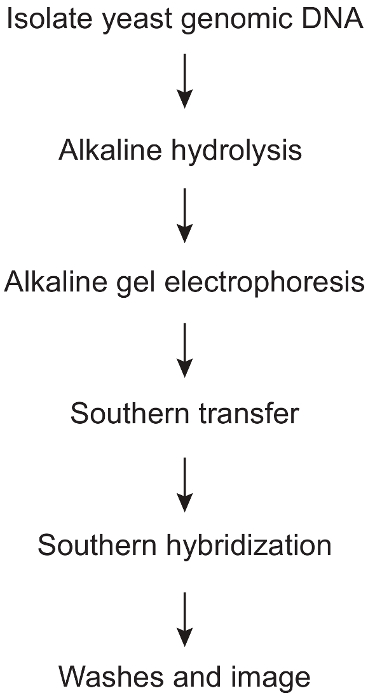
Figure 1: Protocol steps involved in strand-specific detection of alkali-sensitive sites caused by ribonucleotide incorporation into yeast genomic DNA. An overview of the various major steps involved in this procedure, beginning with yeast genomic DNA isolation and proceeding through the final Southern blot analysis. Please click here to view a larger version of this figure.
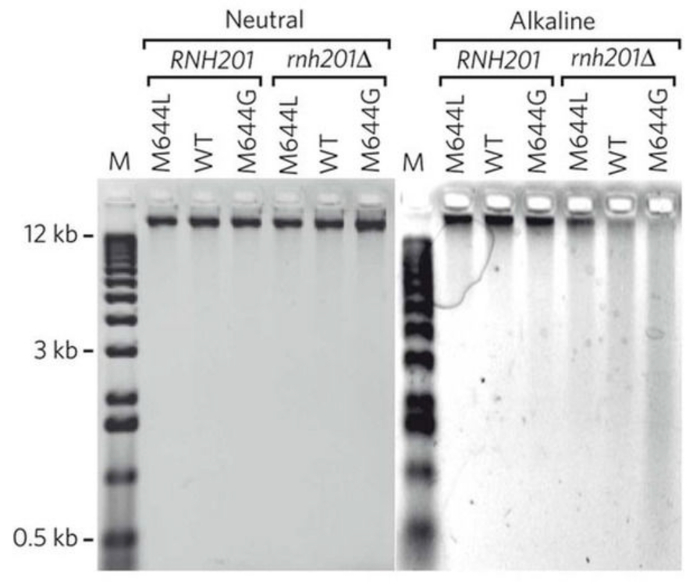
Figure 2: A representative image of results obtained by alkaline-agarose gel electrophoresis. This figure has been adapted from Nick McElhinny, S. A. et al.5. Yeast genomic DNA from strains of different genotypes was treated with KCl (neutral) or KOH (alkaline) and then separated on a neutral or alkaline agarose gel. "WT" and "M644G" indicate the status of Pol ε. Please click here to view a larger version of this figure.
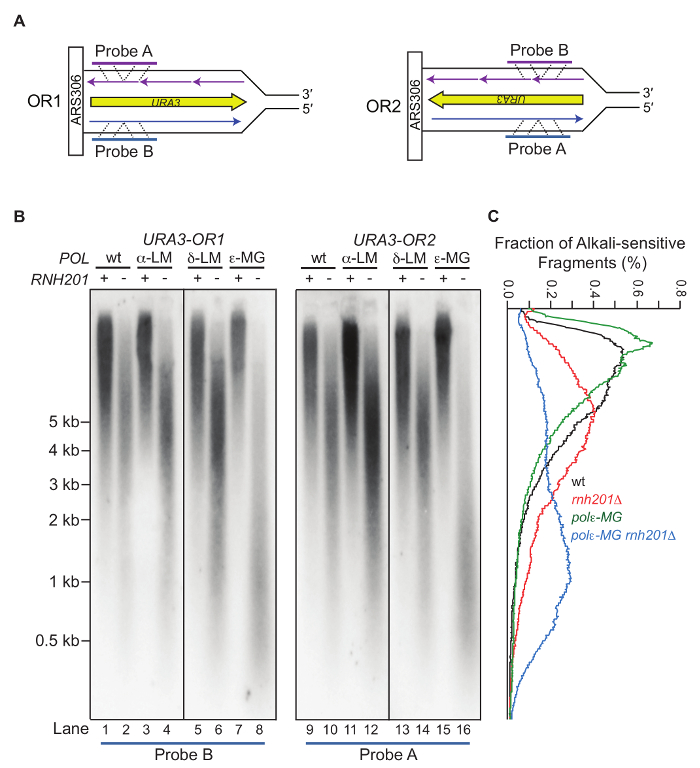
Figure 3: Strand-specific probing of an alkaline-agarose gel by Southern blot. This figure has been adapted from Williams, J. S. et al.13. (A) The radiolabeled probes anneal to the nascent leading DNA strand within the URA3 reporter gene that has been inserted close to ARS306 in two opposite orientations (OR1 and OR2). (B) Representative results of Southern blotting using the nascent leading strand-specific probes. Displayed are the probing results for the nascent leading strand in a strain with WT DNA polymerases, or the pol1-L868M, pol2-M644G or the pol3-L612M variant strains with or without RNase H2. The POL1, POL2, and POL3 genes encode catalytic subunits of Pols α, ε, and δ, respectively. The variants are more promiscuous for ribonucleotide incorporation5,12,17. (C) Quantification of the radioactive signal by fraction of the total in each lane from (B). Values are expressed as a percentage of the total. Please click here to view a larger version of this figure.
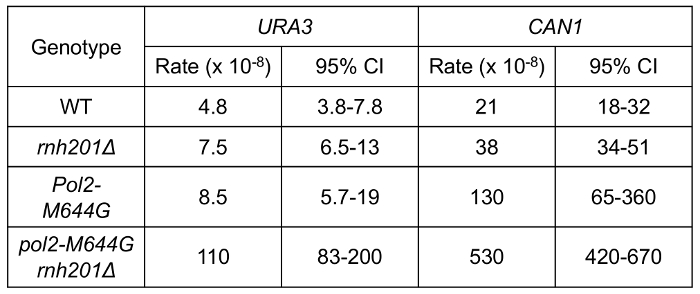
Figure 4: Spontaneous mutation rates in yeast strains. This figure has been adapted from Nick McElhinny, S. A. et al.5. The URA3 and CAN1 reporter genes were used in the forward mutation assay to measure the mutation rates of the indicated strains. URA3 reporter is in "orientation 2" (OR2, Figure 3A). The 95% confidence interval (CI) is included for each measurement. Please click here to view a larger version of this figure.
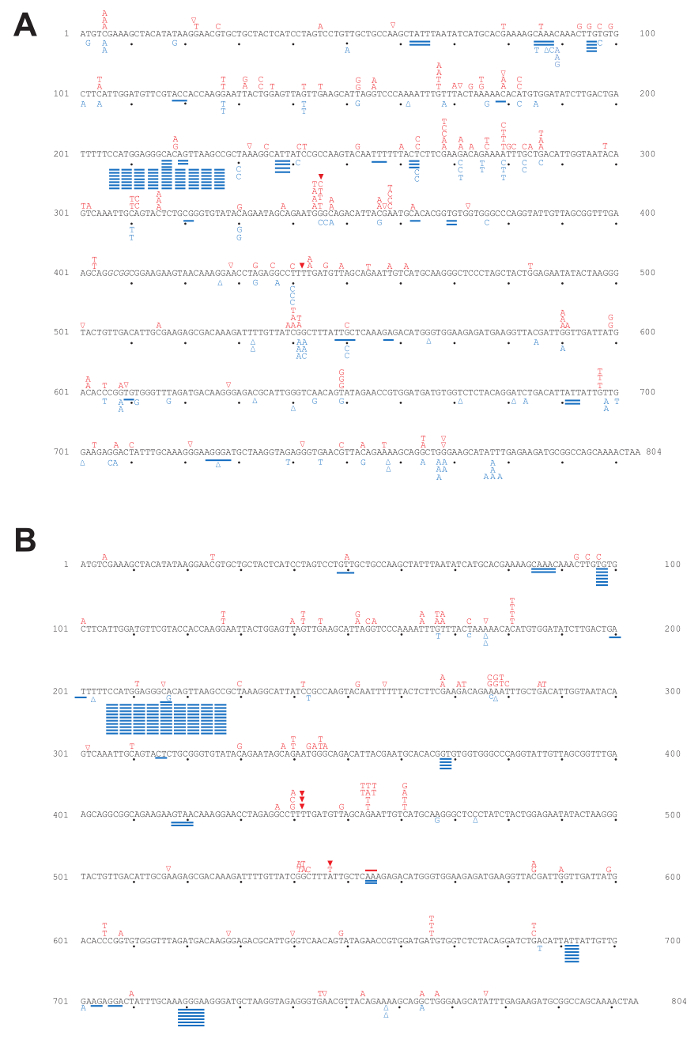
Figure 5: Mutation spectra for the URA3-OR2 reporter gene. This figure has been adapted from previous publications5,18,19,20. The position and mutation type observed in each independent 5-FOA-resistant colony selected in the forward mutation assay are depicted in the 804 bp URA3 coding sequence. Letters indicate base substitutions, open triangles indicate single base deletions, closed triangles indicate single base insertions, and solid lines indicate short deletions. (A) Mutation spectra in WT and rnh201Δ strains. Red labels above the sequence are mutations observed in WT while blue labels below the sequence are those observed in an rnh201Δ strain. (B) Mutation spectra in pol2-M644G and pol2-M644G rnh201Δ strains. Red labels above the sequence are mutations observed in pol2-M644G while blue below the sequence for pol2-M644G rnh201Δ strains. Please click here to view a larger version of this figure.
YPD media | 20 g dextrose, 20 g peptone, 10g yeast extract, in deionized H2O up to 1 L, add 20 g Bacto agar for solid media, autoclave. | ||
COM plates | 1.3 g SC dropout mix, 1.7 g yeast nitrogen base without amino acids or (NH4)2SO4, 5 g (NH4)2SO4, 20 g dextrose, 20 g Bacto agar deionized H2O up to 1 L. Adjust pH to 5.8. Autoclave and 30 – 35 ml per plate. | ||
CAN plates | 1.3 g SC-Ura dropout powder, 1.7 g yeast nitrogen base without amino acids or (NH4)2SO4, 5 g (NH4)2SO4, 20 g dextrose, 20 g Bacto agar, 25 mg uracil and H2O up to 1 L. Autoclave for 15 mins at 121 °C and cool down to 56 °C. Add 6 mL of filter-sterilized 1% canavanine sulfate solution. | ||
5-FOA plates | 1.3 g SC-Ura dropout powder, 1.7 g yeast nitrogen base without amino acids or (NH4)2SO4, 5 g (NH4)2SO4, 20 g dextrose, 20 g Bacto agar, 25 mg uracil and H2O up to 800 mL. Autoclave for 15 mins at 121 °C and cool down to 60 °C. Add 200 mL of filter-sterilized 0.5% 5-FOA solution. | ||
L-Canavanine sulfate | US Biological | C1050 | |
5-FOA | US Biological | F5050 | |
20 mL glass culture tube | Any brand | ||
Culture rotator in 30 °C incubator | Shaker incubator can be used instead | ||
96 well round bottom plates | Sterile, any brand | ||
3 mm glass beads | Fisher Scientific | 11-312A | Autoclave before use |
12-channel pipettes | Any brand | ||
Ex Taq DNA Polymerase | TaKaRa | RR001 | |
Epicentre MasterPure Yeast DNA Purification Kit | Epicenter | MPY80200 | |
3 M sodium acetate | Sigma-Aldrich | S7899 | |
100% ethanol | |||
Qubit 2.0 Fluorometer | Invitrogen | Q32866 | Newer model available |
dsDNA BR Assay kit | Invitrogen | Q32850 | |
KOH | Sigma-Aldrich | 221473 | |
EDTA | Sigma-Aldrich | E7889 | |
Ficoll 400 | Dot Scientific Inc. | DSF10400 | |
Bromocresol green | Eastman | 6356 | |
Xylene cyanol FF | International Technologies Inc. | 72120 | |
NaOH | Sigma-Aldrich | S8045 | |
1 M Tris-HCl (pH 8.0) | Teknova | T5080 | |
SYBR Gold Nucleic Acid Gel Stain | Invitrogen | S11494 | |
UV transilluminator | |||
Amersham Nylon membrane Hybond-N+ | GE Healthcare | RPN303B | |
3 MM CHR Chromotography paper | Whatman | 3030-392 | |
NaCl | Caledon | 7560-1 | |
Stratalinker 1800 | Stratagene | ||
QIAquick PCR Purification Kit | Qiagen | 28106 | |
G-25 spin column | GE Healthcare | 27-5325-01 | |
1 M Sodium phosphate buffer (pH 7.2) | Sigma-Aldrich | NaH2PO4 (S9638); Na2HPO4 (S9390) |
|
SDS | Sigma-Aldrich | L4522 | |
BSA | Sigma-Aldrich | A3059 | |
Formamide | Sigma-Aldrich | 47671 | |
Geiger counter |
The presence of ribonucleotides in nuclear DNA has been shown to be a source of genomic instability. The extent of ribonucleotide incorporation can be assessed by alkaline hydrolysis and gel electrophoresis as RNA is highly susceptible to hydrolysis in alkaline conditions. This, in combination with Southern blot analysis can be used to determine the location and strand into which the ribonucleotides have been incorporated. However, this procedure is only semi-quantitative and may not be sensitive enough to detect small changes in ribonucleotide content, although strand-specific Southern blot probing improves the sensitivity. As a measure of one of the most striking biological consequences of ribonucleotides in DNA, spontaneous mutagenesis can be analyzed using a forward mutation assay. Using appropriate reporter genes, rare mutations that results in the loss of function can be selected and overall and specific mutation rates can be measured by combining data from fluctuation experiments with DNA sequencing of the reporter gene. The fluctuation assay is applicable to examine a wide variety of mutagenic processes in specific genetic background or growth conditions.