All procedures were approved by the animal research ethics committee at University of Barcelona.
NOTE: X. tropicalis and X. laevis tadpoles are reared according to standard methods13,14. Tadpole water is prepared by adding commercial salts (see Table of Materials) to water obtained by reverse osmosis. Conductivity is adjusted to ∼700 µS and ∼1,400 µS for X. tropicalis and X. laevis tadpoles, respectively. Larvae can be obtained either by natural mating or in vitro fertilization14. Embryos are dejellied with 2% L-cysteine prepared in 0.1x Marc's Modified Ringers (MMR). 1x MMR contains (in mM): 100 NaCl, 2 KCl, 1 MgSO4, 2 CaCl2, 5 HEPES, 0.1 EDTA, pH 7.8. Larvae are transferred after 2–3 days (stage 25) to 2 L tanks with tadpole water. When tadpoles reach stage 40 of the Nieuwkoop-Faber (NF) criteria15, they are placed in 5 L tanks and maintained at a density of 10 animals/L. Temperature is kept constant at 23–25 °C and 18–20 °C for X. tropicalis and X. laevis tadpoles, respectively. Animals found at stages 48–52 of the NF criteria are used for experiments.
1. Transection of Olfactory Nerves
- Prepare an anesthetizing solution of 0.02% MS-222 in 50 mL of tadpole water at room temperature.
- Prepare a small tank (1–2 L) with tadpole water to allow recovery of animals after surgery.
- Cut rectangular pieces of cellulose qualitative filter paper (4 cm x 3 cm, see Table of Materials).
- Wet 2 pieces of cellulose qualitative filter paper in 0.02% MS-222 solution and place them under the dissecting scope.
- Pick a tadpole from the tank and immerse it into the anesthetizing solution. The animal stops swimming within 2–4 min and does not react to mechanical stimuli applied at the tail level using tweezers.
- Place the anesthetized tadpole on the rectangular pieces of filter paper. Position the animal with its dorsal side facing upward, so brain structures can be visualized.
- Using vannas scissors (see Table of Materials) cut one or both olfactory nerves (depending on the type of assay to be carried out). Transect a single nerve for experiments that require an internal control of nerve injury.
- For behavioral experiments, transect both nerves in order to suppress all odorant information arriving to the olfactory bulb. The efficiency of sectioning of olfactory nerves can be easily observed under the dissecting scope; however, pigmentation or animal position can be limiting factors.
NOTE: (Optional) The best way to certify the validity of the procedure is using transgenic tadpoles that express fluorescent reporters on their nervous system (see representative results). To this aim, it is necessary to use a dissection scope equipped with fluorescence (Figure 1). If only wild-type animals are available, tracing with CM-diI can be employed. Follow protocol 2 (see below) to inject a 0.5 mg/mL solution of CM-diI prepared in 0.3 M sucrose in the nasal capsule. See 16 for details on preparation and storage of CM-diI. Leakage of dye out of the principal cavity must be minimize. To this aim, it is necessary to modify the pressure of injection and the opening of micropipettes. Fluorescence at the level of the glomerular layer of the olfactory bulb becomes obvious 24 h after application of CM-diI. The present work uses labeling with CM-diI just to certify the transection procedure; however, this method can also be used to obtain morphological information of olfactory glomeruli using conventional histological procedures.
- Transfer animals to the recovery tank. Tadpoles should recover normal swimming within ~10 min. Perform a careful inspection for the presence of hemorrhages, which are expected in ~1% of animals subjected to surgery.
- Euthanize injured animals in a 0.2% MS-222 solution.
2. Labeling of Olfactory Receptor Neurons with Fluorescent Calcium Indicators
- Prepare a solution containing 12% Calcium Green-1-dextran (see Table of Materials), 0.1% Triton X-100, and 1 mM NaCl17. Store the solution at -20 °C or at -80 °C if it is not to be used within a month.
- Prepare glass pipettes with tip openings ~1–2 µm (similar diameter to microelectrodes used for patch-clamp experiments) for microinjection using a micropipette puller (see Table of Materials).
- Calibrate the volume of microinjections. Using distilled water, adjust pressure and injection time in order to obtain injection volumes of 0.15–0.3 µL.
NOTE: A simple procedure consists in counting the number of pulses required to empty a pipette filled with 1 µL of water. Typical parameters are a pressure of 30 psi and 50 ms injection time. - Place a pipette in the microinjector and load it with ~2 µL of calcium green-1 dextran solution.
- Prepare a tadpole following steps 1.1 to 1.6.
- Move the tip of the pipette into the principal cavity of the nasal capsule.
NOTE: See Figure 2A describing the location of olfactory pathways in a Xenopus tadpole. - Using settings obtained in 2.3, deliver a couple of puffs. Restrict dye presence to the nasal capsule.
- Let the tadpole rest for 2–3 min. Using a Pasteur pipette, pour drops of 0.02% MS-222 solution on the more caudal parts of the animal to avoiding drying.
- Transfer the animal to the recovery tank.
NOTE: It should recover normal swimming within ~10 min. Manipulation of animals might cause injuries. - Euthanize tadpoles that do not recover normal swimming behavior 15 min after injection using a 0.2% MS-222 solution.
- Observe fluorescence at the level of the glomerular layer of the olfactory bulb on the day after injection.
3. Preparation of Tadpoles for Live Imaging of Presynaptic Responses
- 24–48 h before conducting the experiment, coat 4–6 Petri dishes of 35 mm diameter with silicone elastomer (e.g., Sylgard). Once the elastomer has polymerized, fabricate a rectangular well to fit the tadpole.
NOTE: Typical dimensions for X. tropicalis tadpoles found at NF stages 48–52 are 10 mm x 4 mm. - Prepare 100 mL of a 160 µM to 1 mM amino acid solution acting as an odorant stimulus for tadpoles. The solution can contain a mixture of several amino acids: methionine, leucine, histidine, arginine and lysine. Dilute amino acids in Xenopus Ringer's solution, composed of (in mM): 100 NaCl, 2 KCl, 1 CaCl2, 2 MgCl2, 10 glucose, 10 HEPES, 240 mOsm/kg, pH 7.8. Ensure that pH is maintained at 7.8.
- Fill an elevated reservoir with 20 mL of the amino acid solution. Connect the reservoir with polyethylene tubing to a 28 G capillary tube (see Table of Materials) placed above the nasal capsule.
NOTE: The capillary tube is mounted on a micromanipulator (see Table of Materials). Air bubbles must be absent from the perfusion system. - Achieve temporal precision in applying the amino acid solution using the transistor-transistor logic (TTL) control of solenoid pinch valves (see Table of Materials). A stimulator is used to generate TTL pulses (see Table of Materials). Check the temporal precision to deliver the odorant solution by changing the duration of TTL pulses, i.e., 0.1 to 1 s.
- Fill another elevated reservoir with 100 mL of Xenopus Ringer's solution.
- Anesthetize a tadpole and place it under the dissecting scope (steps 1.1 to 1.6).
- Prepare a tadpole for imaging. If albino tadpoles are available proceed to step 3.9, otherwise remove the skin above the olfactory bulb because it contains melanocytes that impair imaging (step 3.8).
NOTE: There are two ways to perform the experiment depending on the pigmentation of the animal. It is preferable to use albino animals. Albino strains are available for X. laevis and albino X. tropicalis lines have recently been generated by CRISPR-Cas9 12 or TALENs18. - Using vannas scissors, make a lateral incision on the tadpole skin on the edge of the central nervous system. Make the cut should be made at the level of the olfactory bulb and never reaching the position of tectum, which can be easily identified by the location of the optic nerve.
- Pinch the cut skin using tweezers and pull it over the nervous system. Verify successful removal by the absence of melanocytes above the olfactory bulb. Keep the animal moist by pouring drops of 0.02% MS-222 solution using a Pasteur pipette.
- Place the tadpole into the well of the coated dish (see Table of Materials). Put a glass coverslip coated with high vacuum grease above the animal. Position the coverslip to cover the top of the tectum to the end of the tail.
- Ensure that the olfactory bulb and placodes remain exposed to the extracellular medium. Keep the tadpole immobile during imaging. Fill the Petri dish with Xenopus Ringer's solutioncontaining 100 µM tubocurarine (see Table of Materials) to prevent muscle contractions.
NOTE: Tubocurarine is stored in aliquots at -80 °C no longer than 6 months. - Place the dish holding the tadpole under an upright microscope. Connect the reservoir containing Xenopus Ringer's solution with the dish using polyethylene tubing (see Table of Materials) for continuous perfusion of Xenopus Ringer's solution to keep the animal alive for >1 h.
NOTE: Mini magnetic clamps (see Table of Materials) are very useful to stably connect tubing to the dish. Perfusion and suction tubes must be located in ~180° angle. - Start perfusing Xenopus Ringer's solution. Maintain the level of the solution in the dish constant throughout the experiment. Continuously evaluate tadpole viability by observing blood circulation through the vessels.
4. Live Imaging of Presynaptic Ca2+ Changes in Olfactory Glomeruli
NOTE: The imaging procedure is described for wide-field microscopy but could be easily adapted to a confocal microscope by adjusting the acquisition settings. Imaging should be carried out in an upright microscope mounted on an anti-vibration table.
- Visualize the tadpole with a low magnification objective, for example 5x.
- Move the micromanipulator axes to place the capillary delivering the odorant solution on the top of one nasal capsule forming a 90° angle with the olfactory nerve. The flow of odorant solution above the olfactory bulb should be avoided because it might cause turbulences that distort imaging.
- Find the olfactory bulb located ipsilaterally to the nasal capsule (subject to stimulation) using a high magnification, long working distance, water immersion objective: 60Xx, 0.9 N.A.
- Check the fluorescence emission by eye. Glomerular structures should be obvious (Figure 2B).
- Perform live acquisition with a camera suitable for calcium imaging. Define a box containing the entire olfactory bulb, typically of 256 x 256 or 512 x 512 pixels. Set the acquisition frame rate acquisition to 20–40 Hz. Adjust the gain, so that the values of basal fluorescence are ~20% of saturation. Acquire a 5 s video.
- Visualize the movie. Check image focus, the absence of movement artifacts and regions containing saturated pixels. Typical fluorescence values of glomerular regions should be of 5,000–20,000 a.u. if using a 16-bit camera. Proceed to the next step if imaging conditions are optimal. Repeat step 4.6 if needed to improve the image quality or adjust gain settings.
- Start a time-lapse acquisition to record responses evoked by olfactory stimuli.
NOTE: Precise application of the odorant solution is controlled by TTL stimuli. A typical experiment contains a baseline period of 4 s, followed by stimulation times ranging from 0.1 to 0.5 s and a recovery period of 6–10 s. - Perform repetitive stimulations of odorants for time intervals >2 min. Set the flow rate to 1–1.5 mL·min-1. Since the global perfusion is on during all experiments, locally applied amino acids are washed out.
NOTE: The volume of solution in the dish is ~3 mL. - Image analysis
- Detection of responses
- Export movies to ImageJ.
NOTE: The goal is detecting the presence of glomerular regions responding to stimuli. - Transform the raw sequence of fluorescence images to a ΔF/F0 movie. Measure relative changes in basal fluorescence according to the following relationship: (F-F0)/F0, where F0 indicates baseline fluorescence levels.
- Draw regions of interest (ROI) around areas showing putative fluorescence increases during stimulation and record their position in the ROI manager (Figure 2E). Draw an ROI to detect background fluorescence levels in an area devoid of glomerular structures.
- Export movies to ImageJ.
- Quantification of responses.
- Place the defined ROIs in the raw sequence of fluorescence images. Obtain the mean gray value of selected ROIs for each frame. Transfer the sequence of values obtained to an analysis program (e.g., Igor Pro).
- Subtract background fluorescence, and then calculate ΔF/F0 changes for each ROI (Figure 2F). Plot the increases in ΔF/F0 for each one of the ROIs selected. Calculate the standard deviation of basal ΔF/F0 (before stimulation).
NOTE: A positive response is considered if increases in ΔF/F0 obtained during stimulation are larger than 2 standard deviations of basal values.
- Detection of responses
5. Olfactory-guided Behavior Assay
NOTE: A schematic diagram of the setup for performing the assay is shown in Figure 3.
- Make small holes to fit 1.57 mm O.D. x 1.14 mm I.D. tubing in the upper part of each well of a 6-well dish. Insert the tubing and seal using an epoxy adhesive (see Table of Materials).
NOTE: The modified dish can be re-used many times after thorough wash with distilled water. - Prepare 50 mL of an amino acid solution containing methionine, leucine, histidine, arginine and lysine (see step 3.2 for details). The concentrations can range from 160 µM to 1 mM. Place 20 mL of the solution in an elevated reservoir.
- Do not feed tadpoles for at least 12 h before the assay. Take 6 tadpoles from their housing tank and place them in 2 L of clean tadpole water to minimize the exposure to odorants.
- Place the modified 6 wells dish on a white LED-transilluminator (Figure 3).
- Couple the perfusion inlets to the reservoir containing the amino acid solution using a manifold (see Table of Materials). Check the perfusion system and eliminate air bubbles. Fill the 6 wells simultaneously. Adjust the height of the reservoir to allow the delivery of ≥5 mL of odorant solution within ~30 s.
NOTE: Wash each well 4 times with double distilled water after exposure to the odorant solution. - Fill each well with 10 mL of tadpole water. Place 1 tadpole/well. Leave to rest for >3 min.
- Set up image acquisition. Use a conventional CCD camera that can acquire images at ≥5 Hz. Connect the camera to a computer. Here, use a Zeiss MRC5 camera controlled by Zen software but other equivalent configurations can be used. If it is necessary to increase frame rate, apply pixel binning. Images should show the whole 6-well dish.
- Start image acquisition such that movies contain basal (30 s), stimulus (25–35 s) and recovery (30–60 s) periods.
- Return animals from the 6 wells dish to tanks after imaging.
- Analyze movies in ImageJ using plugins such as wrMTrck19,20 that provide multiple parameters associated to motility.
- To prepare images for analysis, first select a well by drawing a rectangular ROI of 35 mm x 35 mm (Figure 4A). Obtain a background image by calculating the maximum projection of the whole sequence. It should display an image of the well without the tadpole.
- Subtract the maximum projection from the raw movie. Perform thresholding on the generated 32-bit movie and apply the wrMTrck plugin. Adjust WrMTrck parameters to reliably track animal movements. Transfer the obtained X,Y coordinates into an analysis program.
- Using X-Y coordinates, calculate the Euclidean distance to the odorant source (perfusion inlet in the well), by applying the following equation:

where os indicates the position of the odor source and tad indicates the tadpole position at a given time. See Figure 4A for details.
In this paper, we present a combination of two complementary approaches to perform in vivo study of the functionality of the Xenopus tadpole olfactory system: i) a method for imaging presynaptic Ca2+ changes in the glomeruli of living tadpoles using a fluorescent calcium indicator, and ii) an odor guided behavioral assay that can be used to investigate the response to specific waterborne odorants. Since these approaches have been employed to evaluate the recovery of olfactory processing after injury10, a simple method for transecting olfactory nerves is also described.
Transection of olfactory pathways in Xenopus tadpoles
There are two ways to certify the validity of the procedure. Both rely on the visualization of olfactory nerves using fluorescent reporters. One method is based on transgenic tadpoles that express fluorescent proteins on their nervous system. Two recommended lines that express GFP under a neuronal β-tubulin promoter are X. laevis tubb2b-GFP and X. tropicalis NBT-GFP (Figure 1, see Table of Materials). If only wild-type animals are available, CM-diI can be used (see step 1.8). Figure 1 shows images of tubb2-GFP X. laevis tadpoles. Images are from four different animals where a single olfactory nerve was transected. The cut should be obvious under the dissection scope. The advantage of using transgenic lines is that reformation of the olfactory nerve can be followed over a period of time. When doing sequential observations, it is recommended to minimize exposure to fluorescent light to prevent photodamage. Sectioning of a single olfactory nerve is useful when an internal control is required, as for example, to compare normally developed vs rewired glomerular units. Sectioning of both olfactory nerves should be applied when the aim is completely suppressing the transmission of information.
Live imaging of presynaptic responses to olfactory stimuli
The correct labeling of ORNs with calcium green-1 dextran can be observed at the level of the olfactory bulb (Figure 2A) using widefield microscopy. Glomeruli are obvious (Figure 2B) and should appear distributed in different layers by moving the focus plane. The morphology of glomerular structures can be better resolved if a confocal microscope is used instead (Figure 2C). The number of labeled glomeruli depends on dye uptake at the level of the olfactory epithelium. Therefore, this procedure does not allow the visualization of all glomerular units. Animals showing a more intense fluorescence staining of the glomerular region should be selected before performing imaging experiments, since they contain more ORNs labeled. This maneuver is highly recommended in order to increase experimental throughput and should be performed under a dissecting scope equipped with a fluorescence lamp. Reject animals that do not show labeled glomerular units or that show fluorescence restricted to particular areas of the glomerular layer. Presynaptic Ca2+ responses can be observed as soon as 1 day after dye loading. For carrying out imaging experiments it is desirable to use objectives of high numerical aperture, typically ≥0.9.
Increases of presynaptic calcium levels can be evoked exposing dendritic knobs of ORNs to amino acids. It is important to position the capillary delivering the odorant solution above the nasal capsule. Care should be taken to avoid contact because it could clog the tip of the capillary and/or cause mechanical stimulation of ORNs. Transient increases in presynaptic calcium levels can be observed for stimuli ≥0.1 s (Figure 2D) and are indicative of a correct olfactory transduction. It is also important to visualize basal calcium levels with low camera gain. Presynaptic terminals of ORNs display high fluorescent increases and it is essential to avoid signal saturation. High temporal resolution can be achieved with widefield microscopy. For example, using an electron-multiplied CCD camera, it is possible to achieve frame rates of 50 Hz or higher. Use of confocal microscopy reduces temporal resolution but allows a better definition of glomerular structures.
The high affinity of calcium green for binding calcium (190 nM) is particularly useful to detect small responses. Transient intracellular calcium increases detected in the glomerular layer are variable. Some glomerular regions show changes in ΔF/F0 ≥0.2, while neighboring processes might not even respond (Figure 2D). The following factors contribute to the variability of the response of glomerular units: i) the overall number of labeled glomeruli, ii) the intracellular concentration of calcium green, and iii) the selectivity of ORNs to detect amino acids. Since a too low number of labeled glomeruli might preclude observing responses, it is absolutely necessary to carry out these experiments with animals containing as many labeled ORNs as possible.
Olfactory-guided behavior
Data analysis
Olfactory-guided behavior is studied using a custom-built system. Figure 3 shows a schematic drawing of equipment used to carry out the assay. The test is based in the ability of tadpoles to detect the presence of amino acids, which act as odorants. A solution combining five different amino acids (methionine, leucine, histidine, arginine and lysine) is used for stimulation. The solution is locally delivered during 30 s to a 35 mm well containing a free-swimming tadpole. The immediate response of tadpoles to the incoming solution is an increase in motility. Random movements occurring during the initial ∼5–10 s of solution application are followed by a direct swim towards the source of odorants. Tadpoles remain for several seconds in the vicinity of the nozzle during delivery of amino acids and gradually recover motility in random directions (see Supplementary Videos 1, 2).
The experimental conditions described allow the normal swim of X. tropicalis tadpoles stages 48-52; however, it must be taken into account that the motility of larger animals might be restricted in 35 mm wells. Tadpole movements are recorded with a CCD camera. Attraction for the odorant solution can be detected as a reduction of the Euclidean distance separating perfusion inlet from tadpole position (Figure 4). Tracking of tadpole head positions within an area of 35 mm x 35 mm (or the equivalent size in pixels) allows obtaining a quantitative analysis of olfactory-guided behavior (Figure 4A). Individual plots of tadpole movements are constructed using X-Y coordinates obtained by image analysis (Figure 4B). The extracted motility plots must faithfully reproduce video images.
There are two possible methods of interpreting olfactory-guided behavior experiments. The first approach is inspired on a previous study using zebrafishes21. Measurement of the time spent in the vicinity of the nozzle delivering odorants evidences the presence of a positive tropism. A region of interest of 8.75 mm radius (corresponding to ¼ of the well diameter) centered on the solution inlet it is used to classify the proximity of the animals to the odorant source (Figure 4A, 4C). Binning the time spent by tadpoles in the vicinity of the nozzle during defined periods, i.e., 15 s intervals, allows identifying the ability to detect amino acid solutions (Figure 4D). The overall behavior of a population of tadpoles can be obtained by plotting the distribution of individual data (Figure 5A). A positive tropism can be detected when the solution of methionine, leucine, histidine, arginine and lysine is prepared either at 1 mM or 160 μM (Figure 5A and 5B). Animals do not respond to water application (Figure 5C), thus discarding the participation of mechanosensitive mechanisms. Differences among time intervals defined in each experimental group can be established using nonparametric repeated measures ANOVA with Dunn's multiple comparisons test. The disadvantage of binning data in time intervals of 15 s is a reduced temporal resolution.
A way to increase temporal information of the behavioral response is by making average plots of Euclidean distances from the odor source. Although tadpole movements show an intrinsic variability, the average motility of a population of animals (typically ≥40) shows the olfactory-guided behavior. To carry out this analysis it is necessary to group animal positions before the onset of stimulation. Since tadpoles are found in different locations when the odorant solution enters into the well it is required to set the Euclidean distance to 0 just before stimulation (Figure 6A, see also the inclusion criteria in Figure 7). Negative and positive values therefore indicate an attraction or a repulsion from the odor source, respectively. An attraction for odors is well described by a linear fit with regression coefficients ≥0.9. If water is delivered, the net changes of Euclidean distance are distributed around 0 and it is not possible to fit a line during odorant stimulation, thus indicating the absence of an olfactory-guided behavior (Figure 6B). Comparison of average plots of Euclidean distances for amino acid solutions prepared at 1 mM and 160 µM suggest different delays in the olfactory-guided response (compare Figure 6A and C). The time interval required to initiate the movement towards the source of odorants is shorter when amino acids are applied at a higher concentration. A lack of olfactory-guided behavior is observed in tadpoles with both olfactory nerves transected (Figure 6D).
A limitation of the described olfactory-guided behavioral assay is the establishment of complex fluid plumes. This can be seen if the amino acid solution is substituted by a dye, such as Fast Green, when setting up the system. The use of colored solutions verifies the formation of plumes and shows that waterborne odorants reach any region of the well within 5 s. Turbulences caused by the delivery of the solution are likely detected by the lateral line of tadpoles and probably contribute to the variability observed in animal motility but do not interfere with olfactory guided behavior. Control experiments carried out by using water instead of amino acid solutions reveal that tadpoles are capable to discriminate olfactory from mechanical stimuli. The estimation of time spent in a region of interest (Figure 5) and the average plot of Euclidean distances (Figure 6) are two complementary methods to describe the olfactory-guided response of tadpoles.
Inclusion criteria
Inclusion criteria must also be taken into account for data analysis. Some tadpoles show a resonant movement, which is illustrated by the fitting of the plot of Euclidean distances to a sinusoidal function (Figure 7A). Tadpoles displaying this behavior must be discarded from all analysis.
The exclusion of animals that at the onset of the application of odorant solutions are at a maximum (>30 mm Figure 7B) or a minimum Euclidean distance (<5mm, Figure 7C) from the nozzle allows decreasing the variability of the average plots. The example illustrated in Figure 7B shows a positive tropism for the amino acid solution. The tadpole is located at a maximum distance of the solution inlet at the onset of stimulation. Therefore, this relative position can only reveal an attraction for the odor source. Figure 7C shows the opposite situation. Here, a tadpole is located in the vicinity of the nozzle delivering the amino acid solution. Quantification of the time spent near the odor source shows a response (method used in Figure 5); however, it cannot show a net movement towards the inlet.
In summary, the proposed assay of olfactory-guided behavior defines a binary test. This method can be used to detect the ability of an experimental group of tadpoles to respond to odorants. Further improvements are required if the aim is establishing differences among complex olfactory-guided responses, as for example, determining preferences for given odors.
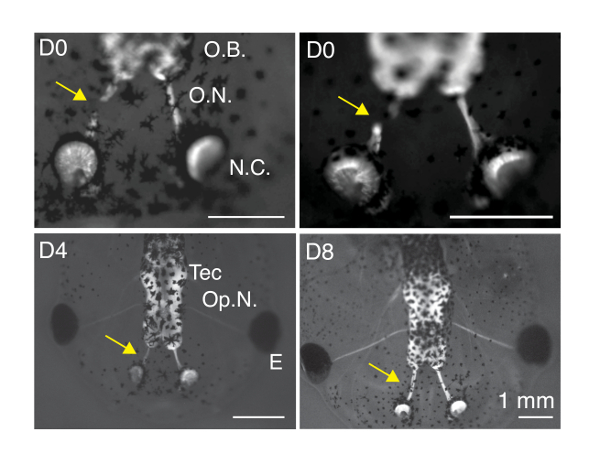
Figure 1: Transection of olfactory nerves. Representative images of tubb2-GFP X. laevis tadpoles obtained after transection of a single olfactory nerve (arrows). Nerves of tubb2-GFP tadpoles display strong fluorescence. Nerve transection is obvious immediately after surgery (D0). Regrowth of the olfactory nerve is evident 4 days after cut (D4). Eight days after surgery (D8) there is little difference between control and reformed nerves. Tadpoles were anesthetized in 0.02% MS-222 to collect images. Olfactory bulb (O.B.), olfactory nerve (O.N.), nasal capsule (N.C.), tectum (Tec), optic nerve (Op.N.). Arrows indicate the location of the transected nerve. Please click here to view a larger version of this figure.
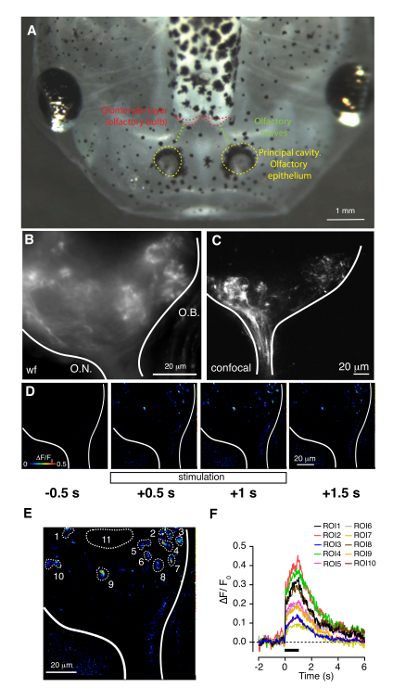
Figure 2: Labeling of olfactory receptor neurons with calcium green dextran and visualization of presynaptic calcium influx upon stimulation with amino acids. (A) Transmitted light image of a tadpole showing the location of the olfactory epithelium, olfactory nerves and the glomerular layer of the olfactory bulb. (B) Image of an olfactory bulb visualized by widefield (wf) microscopy. Neurons were labeled by application of calcium green-1 dextran at the nasal capsule. The fluorescence observed corresponds to presynaptic terminals from olfactory receptor neurons forming glomeruli. O.N: olfactory nerve; O.B: olfactory bulb. (C) Confocal section located dorsally from the entry of the olfactory nerve to the bulb. The presynaptic component of olfactory glomeruli was labeled using calcium green-1 dextran, as in B). (D) Presynaptic terminals transiently increase their calcium levels upon exposure of the olfactory epithelium to a solution containing five different amino acids. Relative changes in calcium fluorescence obtained before, during and after 1 s stimulation. (E) Distribution of 10 different regions of interest (ROIs) used to quantify ΔF/F0 changes. ROI11 is outside of the glomerular layer and is used to define background levels of fluorescence. (F) Individual ΔF/F0 responses for ROIs defined in E). Please click here to view a larger version of this figure.
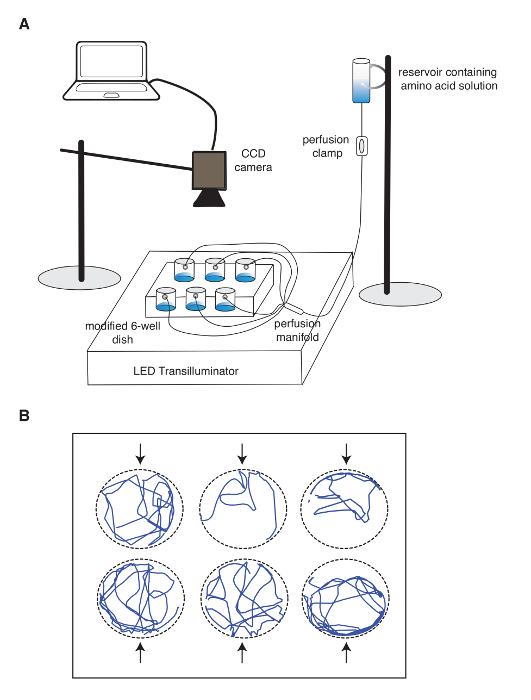
Figure 3: Olfactory-guided behavior assay. (A) Schematic diagram showing the equipment used in the test. (B) Example of motility tracks recorded over 90 s. Each circle represents a well containing a single animal. Please click here to view a larger version of this figure.
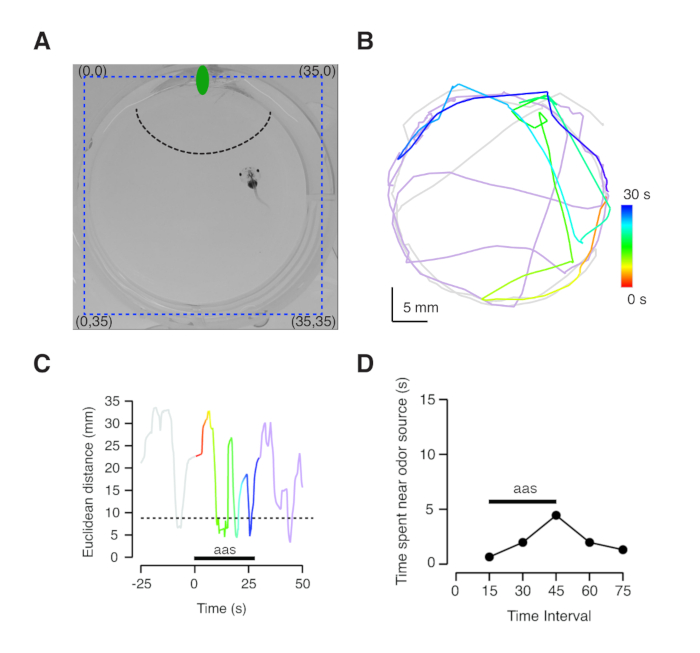
Figure 4: Tracking of olfactory-guided behavior. (A) Example showing a well used for the behavioral assay. Blue dotted lines indicate the location of X,Y coordinates (in mm) used to track tadpole movements (see also Supplementary Video 1). The green ellipse represents the position of the solution inlet. The dotted black line indicates the proximal area to the tube delivering the amino acid solution (see text for details). (B) Motility of the tadpole shown in A) during the behavioral assay. Color-coded traces indicate the position of the animal before (gray) and after olfactory stimulation (violet). Movements during application of the odorant solution are illustrated in a temporal color gradient (30 s, red to blue). (C) Using X,Y tadpole positions it is possible to calculate changes in the Euclidean distance from the tadpole head to the perfusion inlet. Distances shorter than 8.75 mm correspond to the proximal area of the nozzle. (D) Plot of the time spent by tadpoles in the region defined by the dotted line in A). Each dot indicates a 15 s period. The animal is attracted by the odorant solution. Please click here to view a larger version of this figure.
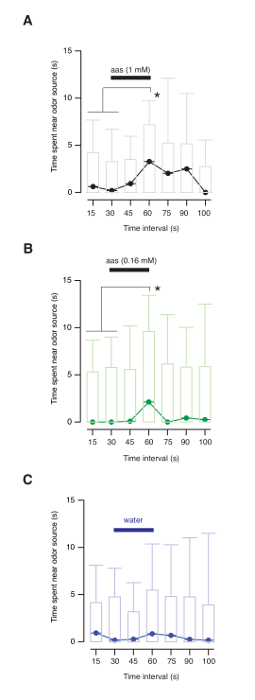
Figure 5: Tadpoles are attracted by amino acids. (A) Time spent by tadpoles in the vicinity of the odor source. Each bin comprises a 15 s period. Box plots represents the median (black horizontal line), 25 to 75% quartiles (boxes), and ranges (whiskers) of data. Delivery of a 1 mM amino acid solution attracted tadpoles to the odor source. (B) Tadpoles were attracted by the odorant solution when the concentration of amino acids was reduced to 160 μM. (C) Delivery of water did not modify animal behavior. Repeated measures ANOVA with Dunn's multiple comparisons test, p < 0.05. Please click here to view a larger version of this figure.
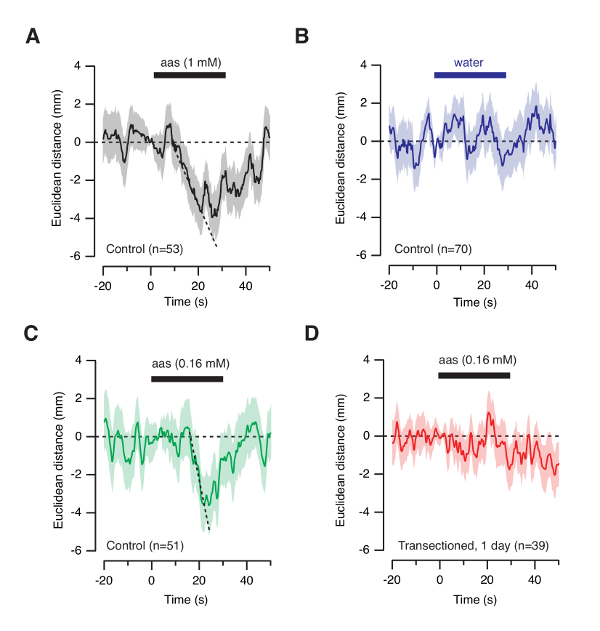
Figure 6: Temporal response of tadpoles to odorants. (A) Plot of the average Euclidean distance to the odor source as a function of time. The Euclidean distance was set to 0 before stimulation in each individual trace. Negative and positive values indicate a decrease and an increase in distance to the odor source, respectively. Attraction to the odor source can be described by a linear fit (r2=0.98). (B) Delivery of water does not modify the distance to the odor source. (C) Tadpoles respond to the application of a 160 μM solution of amino acids as revealed by a linear fit (r2=0.96). (D) Tadpoles with both olfactory nerves transected do not respond to amino acids. Please click here to view a larger version of this figure.
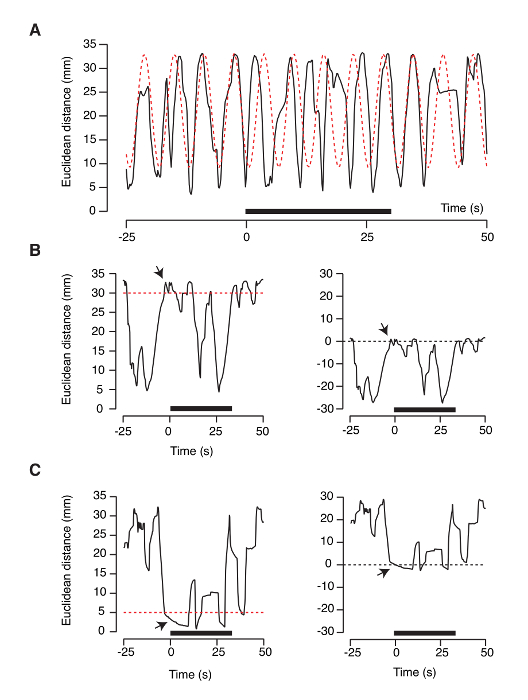
Figure 7: Inclusion criteria for the olfactory-guided behavior assay. (A) Some tadpoles show a resonant movement. This behavior is revealed by successful fit of a sinusoidal function to the plot of the Euclidean distance to the odor source. Tadpoles displaying this activity should be excluded from the test. (B, C) A way to reduce variability in the average temporal response to odorants (Figure 6) is by excluding animals located at a maximum (B) or a minimum (C) Euclidean distance at the onset of stimulation. Red dotted lines indicate the threshold value (30 mm and 5 mm). The Euclidean distance before the onset of stimulation (arrow, left plots) is set to "0" to report attractive or repulsive behaviors as negative or positive values (right plots), respectively. Please click here to view a larger version of this figure.
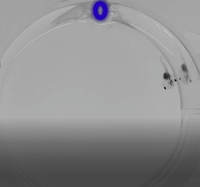
Supplementary Video 1: Olfactory-guided behavior triggered by delivery of an amino acid solution. The movie shows a tadpole freely swimming on a 35 mm well. The blue ellipse indicates the position of the nozzle delivering the odorant solution. The onset and end of stimulation are indicated by green and red dots, respectively. Figure 4 shows the analysis of the behavior observed. Please click here to view this video. (Right-click to download.)
Supplementary Video 2: Tadpole motility during delivery of water. The movie shows a tadpole freely swimming on a 35 mm well. The blue ellipse indicates the position of the nozzle releasing MQ water. The onset and end of water delivery are indicated by green and red dots, respectively. Please click here to view this video. (Right-click to download.)