The E-PRD domain (residues 1822-2014 cloned into pProEX-HTC) of the human envoplakin gene and the VimRod domain (residues 99-249 cloned into pET21a) of human vimentin4 were expressed with His6 tags and purified. Figure 6 and Figure 7 demonstrate the levels of purity of VimRod (18.8 kDa) and E-PRD (21.8 kDa) obtained from this method of protein purification. The removal of the His6 tag from the E-PRD construct is essential for the MST experiments as the VimRod protein is labeled using a His6 tag binding dye and any E-PRD retaining its His6 tag may compete for binding of the dye. The second IMAC column after cleavage of the tag with TEV protease removes the TEV protease, the cleaved tag and any uncleaved His6-E-PRD that remained. The final polishing step of the purification is size exclusion chromatography. Despite both proteins being of a similar size, the VimRod elutes from the column at a 51 mL while the E-PRD elution peak is centered at 72 mL where a protein monomer of this size would be expected. The apparent increase in size of VimRod is likely due to the its characteristics as a filamentous long rod shaped protein as analytically ultracentrifuge experiments demonstrated that VimRod was monomeric4. Lower yields of protein are obtained from the cultures grown in M9 than those from rich broth due to a lower amount of cells being produced in the minimal media. The initial growth of larger starter cultures for M9 preparations in TB allows improvement of cell yields while maintaining the extent of 15N labeling necessary for the NMR experiments.
The 15N-1H HSQCs were acquired for the wild type and R1914E mutant of E-PRD in presence or absence of VimRod (Figure 8A–8D). The spectrum of E-PRD in Figure 8A shows the expected number of well resolved peaks, indicative of a properly folded protein. In the presence of VimRod (Figure 8B) the spectrum shows extensive line broadening and peak disappearance, corresponding to binding between the E-PRD and VimRod. This binding is lost by mutation of R1914E as evidenced by comparison of Figure 8C and 8D. Little change is observed in the spectrum upon addition of VimRod to the R1914E mutant indicating a lack of binding between this mutant E-PRD and VimRod. The E-PRD peak intensities in the presence/absence of VimRod were compared and plotted as the relative peak intensities in Figure 8E, which indicates the range of peak broadening in the E-PRD complex. The R1914E mutant of E-PRD (not shown) retained about 97% of peaks at 20% or higher peak intensities in presence of VimRod compared to about 20% for the wild type (Figure 8E). This represents a loss of function point mutant, with additional mutants having intermediate effects also having been studied4.
To validate and quantitate the binding of VimRod and E-PRD MST analysis using His6-VimRod labeled with fluorescent RED-tris-NTA dye as the target mixed with decreasing concentrations of the ligand E-PRD from 1.28 mM to 39.1 nM were performed. Three binding titrations were carried out and the results are averaged and shown in Figure 9. The data were fit with a standard model of one-site ligand binding and gave a KD of 25.7 ± 2.1 μM. Evaluation of the binding between VimRod and E-PRD by surface plasmon resonance gave a similar KD value of 19.1 ± 1.3 μM4.
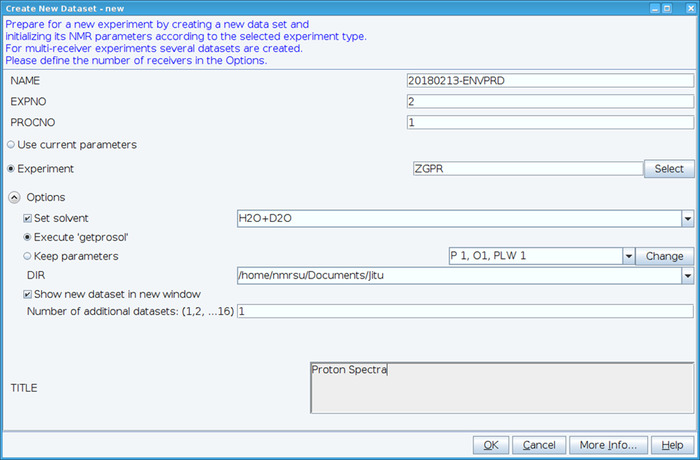
Figure 1: Screen Capture of the Setup of the NMR Experiment. The window shown is used to set up a standard experiment to collect a HSQC dataset. Experiment parameters are read in adjacent to Experiment. The ZGPR experiment shown is chosen as an initial experiment to load the standard and solvent dependent proton parameters. The Title window is used to input experimental details for record keeping purposes. To collect the HSQC spectrum the ZGPR experiment is replaced with SFHMQC3GPPH. Please click here to view a larger version of this figure.
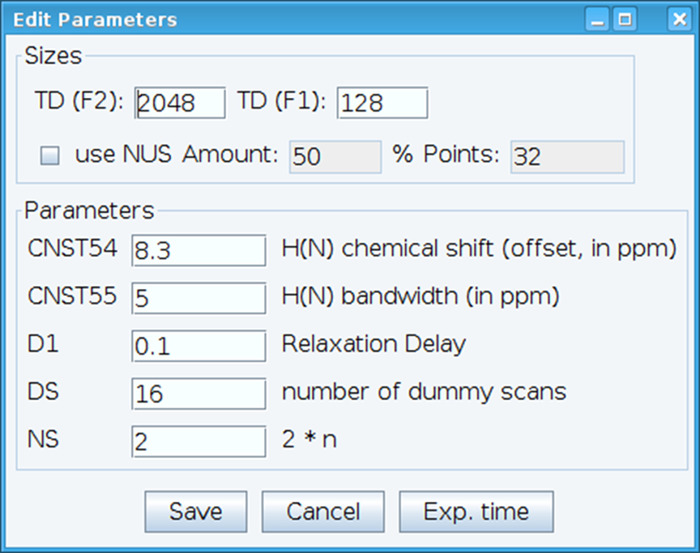
Figure 2: Adjusting of NMR Experimental Parameters. The window shown is used for entering the basic parameters for the NMR pulse sequence in order to optimize the signal. Please click here to view a larger version of this figure.
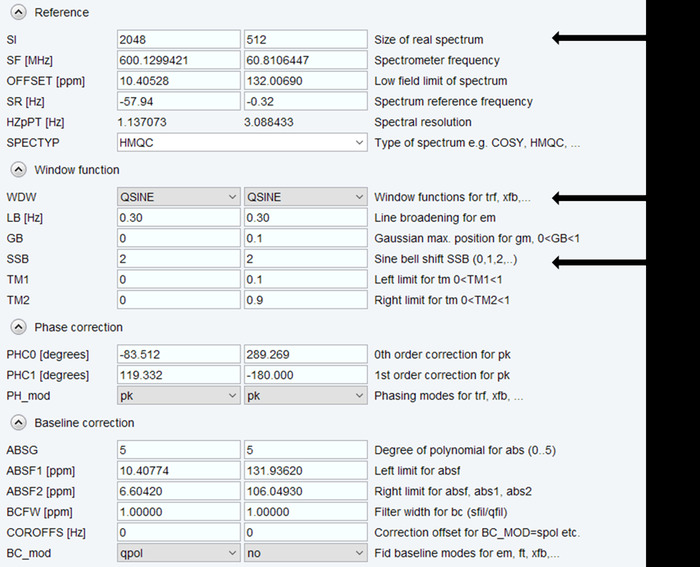
Figure 3: NMR Data Processing. Parameters used for processing each of the two dimensions of the NMR spectrum are shown, with arrows indicating those that are typically adjusted. Please click here to view a larger version of this figure.
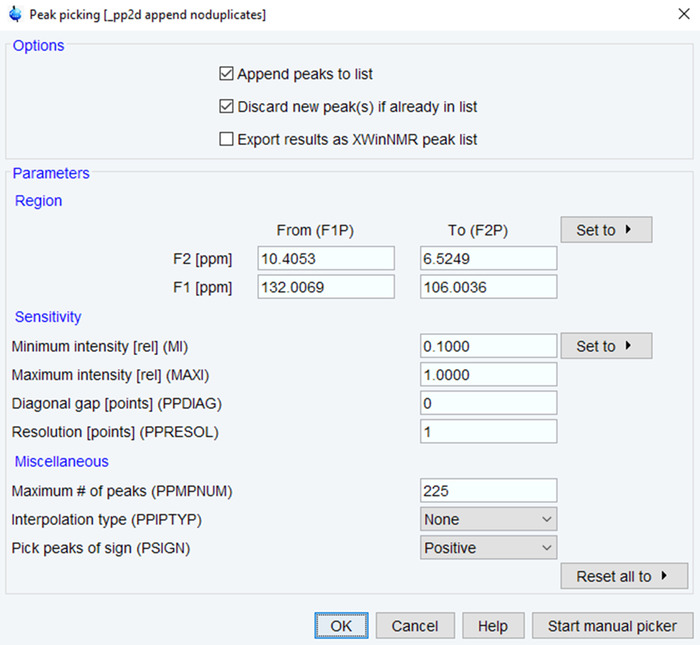
Figure 4: Parameters for NMR Peak Picking. The parameters used for picking NMR peaks in the processed NMR spectrum are shown with typical values. Adjust the ppm range, intensity and number of peaks to optimize the spectra. Please click here to view a larger version of this figure.
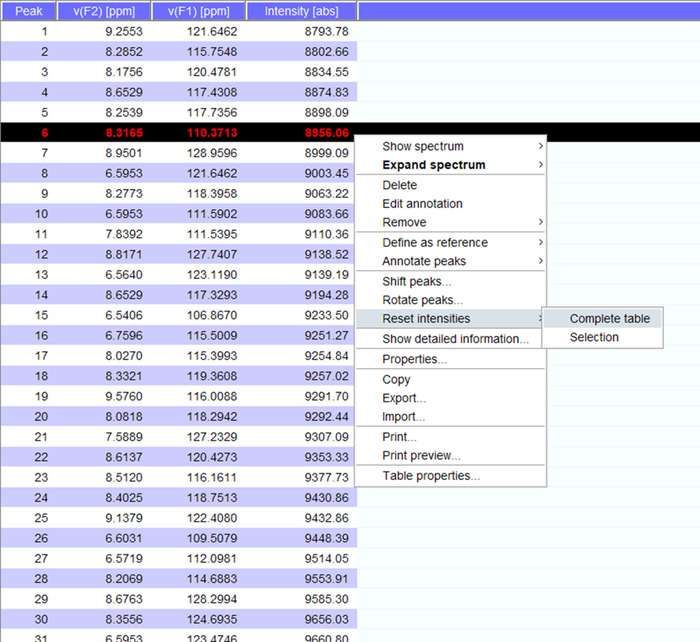
Figure 5: Representative Peaklist with Intensities. Each peak that is picked in the NMR spectrum is given a number, and its 1H and 15N chemical shifts and signal intensity are displayed. This peaklist can then be used to compare spectra obtained in the presence/absence of an interacting partner. Please click here to view a larger version of this figure.
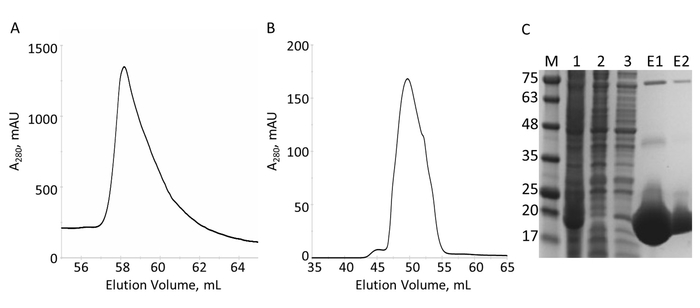
Figure 6: Purification of His6-tagged VimRod by IMAC and S. A. The chromatogram for the elution from the IMAC column shows one major peak of VimRod. B. The chromatogram for the elution from the S column shows one major peak. C. SDS-PAGE of fractions collected over the course of purification: MW standards with the MW indicated in kDa to the left of the gel (M), cell lysate (1), IMAC flow-through (2), wash (3), pooled elution (E1), pooled S elution (E2). Bands visible at higher molecular weights in lanes E1 and E2 are oligomers of pure VimRod as confirmed by western blot (data not shown). Please click here to view a larger version of this figure.
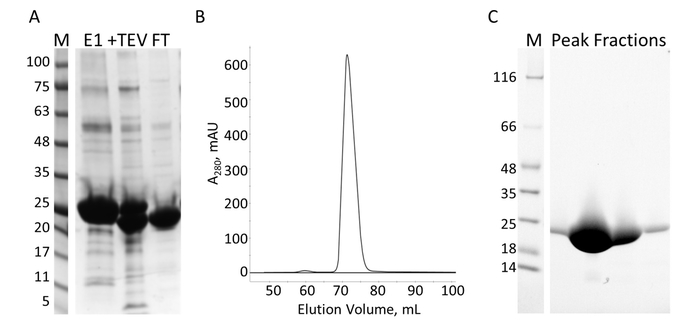
Figure 7: Purification of E-PRD by IMAC and S. A. SDS-PAGE of the IMAC purification showing the molecular weight standards with the MW indicated in kDa to the left of the gel (M) and the eluate from the first IMAC column (E1), the TEV cleavage products (+TEV), and the flow through from the second IMAC column (FT). B. The chromatograph from the S column shows one major peak. C. SDS-PAGE of the molecular weight standards (M) and the fractions from S peak. Please click here to view a larger version of this figure.
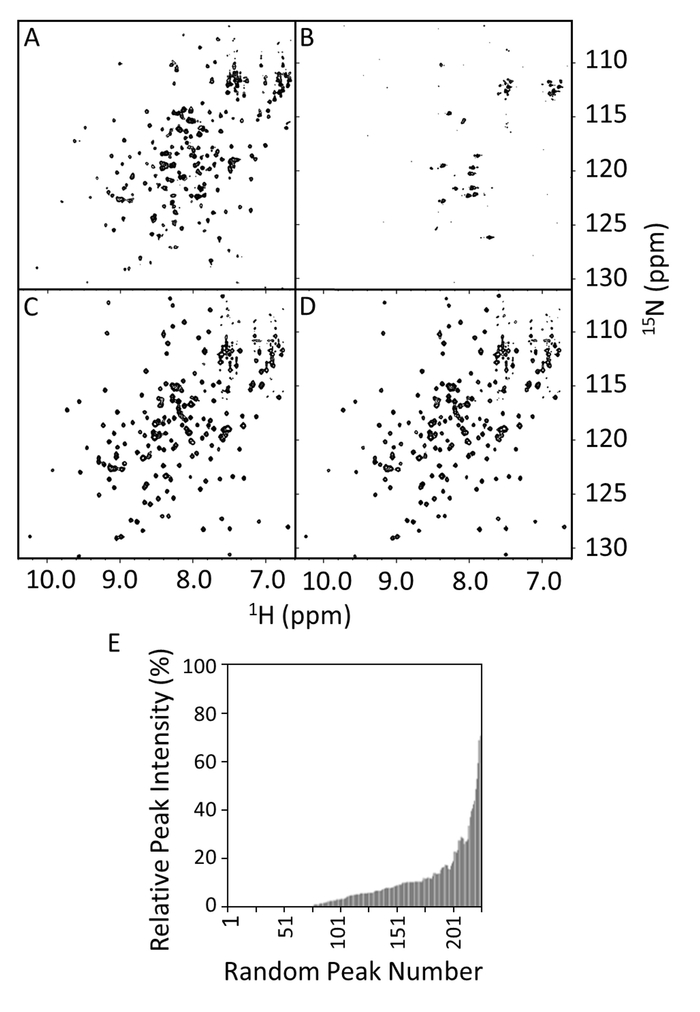
Figure 8: HSQC Spectra of Wild-type and R1914E Mutant of E-PRD in the Presence and Absence of VimRod. The HSQC spectra show wild-type E-PRD (100 µM) in 20 mM Tris-HCl, 150 mM NaCl, 1 mM DTT, pH 7 in the absence (A) or presence of 50 µM VimRod (B). Panels C and D are the HSQC spectra of the R1914E mutant (100µM) in the absence or presence of 50 µM VimRod, respectively. In panel E the relative 1H-15N peak intensities of the E-PRD with or without VimRod binding are shown as a function of the peak number, which is arbitrarily assigned and not based on sequence position. These values can be used to define a significance cutoff for peak intensity reduction upon addition of a ligand. If assignments are available, the significant values can often be seen to map to a binding area. Please click here to view a larger version of this figure.
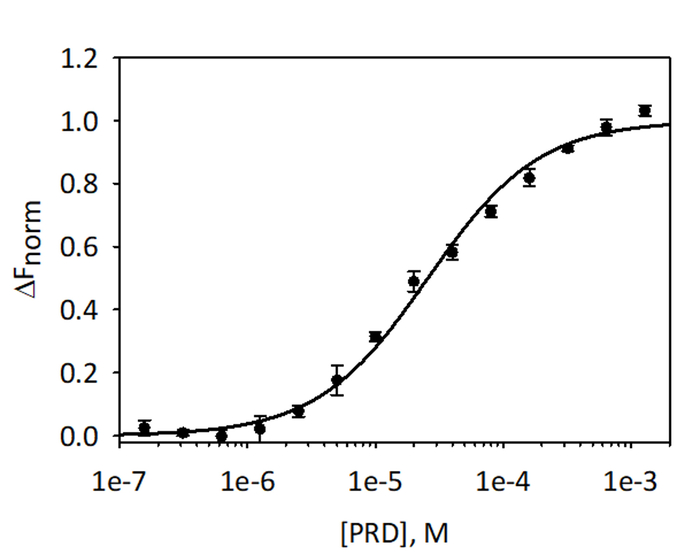
Figure 9: Binding of E-PRD to VimRod. E-PRD was diluted in a series of two-fold dilutions from 1.28 mM to 39.1 nM and incubated with labeled VimRod before performing MST analysis. Data from three independent assays were combined. The data were fit to a KD model giving a KD of 25.7 μM with a KD confidence of ± 2.1 μM. Please click here to view a larger version of this figure.
| Reagent | Quantity |
| Sodium phosphate, dibasic (anhydrous) | 6.0 g |
| Potassium phosphate, monobasic (anhydrous) | 3.0 g |
| Sodium Chloride | 0.5 g |
| H2O | Up to 950 mL |
Table 1. M9 media for Isotopic Labeling.
| Reagent | Quantity |
| 15NH4Cl | 1.0 g |
| Glucose (or 13C-glucose) | 2.0 g |
| 1 M MgSO4 | 2 mL |
| 50 mM CaCl2 | 4 mL |
| 20 mg/mL Thiamine | 1.0 mL |
| 3 mM FeCl3 | 400 µL |
| Metal Mix (Table 3) | 500 µL |
| H2O | Up to 50 mL |
Table 2. Nutrient Mix for Supplementation of M9 media.
| Reagent | Quantity |
| 4 mM ZnSO4 | 323 mg |
| 1 mM MnSO4 | 75.5 mg |
| 4.7 mM H3BO3 | 145 mg |
| 0.7 mM CuSO4 | 55.9 mg |
| H2O | Up to 500 mL |
Table 3. Metal Mix Supplement for Enriching the MT Nutrient Mix.
| Sample | 1 mM E-PRD in buffer A1 (µL) | 1mM VimRod in buffer A (µL) | Buffer A (µL) | 200 µM DSS in D2O (µL) | Buffer B2 (µL) | Total Volume (µL) |
| E-PRD alone | 50 | 0 | 50 | 50 | 350 | 500 |
| E-PRD + VimRod | 50 | 50 | 0 | 50 | 350 | 500 |
| 1Buffer A: 20 mM Tris-HCl, 1 mM DTT, pH 7 | ||||||
| 2Buffer B: 23 mM Tris-HCl, 1.14 mM DTT, pH 7 | ||||||
Table 4. NMR Sample Preparation.