Animal studies were performed in accordance with institutional guidelines and protocols approved by the Vanderbilt University Institutional Animal Care and Use Committee.
1. Preparation of mice and cell acquisition (adapted from Nguyen-Ngoc et al.11)
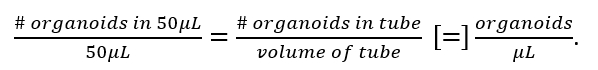
- Sacrifice athymic Nu/Nu mice (8-10 weeks old) using CO2 asphyxiation followed by cervical dislocation. Clean the skin using 70% ethanol.
- Resect abdominal and inguinal mammary glands from mice using pre-sterilized scissors and forceps. Remove lymph nodes before resection. Rinse in sterile 1x phosphate buffered saline (PBS) (Figure 1A).
- Place it in 15 mL tubes with 10 mL of Dulbecco’s Modified Eagle Media/Nutrient Mixture F12 (DMEM/F12) for transport. Samples can be kept overnight at 4 °C or processed immediately. Keep on ice.
- Irradiate samples at 20 Gy using a cesium source (Figure 1B).
- 45 min after irradiation, place mammary glands in a 35 mm sterile cell plate and mince with scalpels (Figure 1C,D). Mince with approximately 40 strokes until the tissue relaxes and pieces are obtained that are no larger than approximately 1 mm2 in area.
- Transfer to the collagenase solution in a 50 mL centrifuge tube. Collagenase solution consists of 2 mg/mL collagenase (see Table of Materials), 2 mg/mL trypsin, 5% v/v fetal bovine serum (FBS), 5 μg/mL insulin, and 50 μg/mL gentamicin in DMEM/F12 media. Use 10 mL collagenase solution per mouse.
- Place in a water bath at 37 °C, vortexing every 10 min for 30-60 min. Digestion is complete when the collagenase solution is cloudy (Figure 1E,F).
- Spin down the digested solution at 450 x g for 10 min at room temperature (RT). Three layers will be observed. The supernatant is composed of fat, the middle layer is an aqueous solution, and the bottom is a pellet. The pellet will appear red as it is a mixture of epithelial cells, individual stromal cells, and red blood cells (Figure 1G).
- Precoat all pipettes, pipette tips, and centrifuge tubes with bovine serum albumin (BSA) solution prior to contact. BSA solution consists of 2.5 w/v % BSA in Dulbecco’s Phosphate Buffered Saline (DPBS). For pre-coating, simply add then remove BSA solution to the inside of the pipette tip and tubes. BSA solution can be reused, although it should be sterile filtered before each experiment.
- For additional recovery, transfer the supernatant to a fresh BSA coated 15 mL tube. Pipette up and down vigorously to disperse fat layer. Centrifuge at 450 x g for 10 min at RT. Aspirate the supernatant, leaving a small amount of media in the tube to avoid aspirating the cell pellet.
- Aspirate the aqueous layer from the tube with the original pellet.
- Add 10 mL of DMEM/F12 to the tube with the original pellet and transfer to the second tube. Pipette vigorously to combine and resuspend the two pellets.
- Centrifuge at 450 x g for 10 min at RT. Aspirate the supernatant and add 4 mL of DMEM/F12 to the tube.
- Add 40 μL of deoxyribonuclease (DNase) to the suspension and gently shake by hand for 2-5 min at RT. DNase solution consists of 4 U/mL DNase in DMEM/F12.
- Add 6 mL of DMEM/F12 and pipette thoroughly. Centrifuge the tube at 450 x g for 10 min at RT.
- Aspirate supernatant to the 0.5 mL mark. Resuspend in 10 mL of DMEM/F12 and pipette thoroughly.
- Pulse to 450 x g and stop 4 s after reaching that speed.
- Repeat steps 1.16-1.17 three more times to purify organoids via centrifugal differentiation. The pellet should now be an off-white color consisting of only epithelial organoids (Figure 1H).
NOTE: Organoids can also be filtered using sterile mesh 40 μm filters. After step 1.16, pipette media containing organoids through a filter into a centrifuge tube, and then rinse with 5 to 10 mL of DMEM/F12 media. Flip the filter over a new 50 mL centrifuge tube. Pass 10 mL of DMEM/F12 media through, going the opposite way to rinse off any retentate. The retentate should consist of organoids, and the filtrate should consist mainly of stromal cells, which can be discarded or kept if desired.
2. Determining density and plating organoids
- Resuspend pellet in 10 mL of DMEM/F12. Pipette thoroughly to create a homogenous solution.
- Transfer 50 µL to a 30 mm Petri dish, and view under a phase contrast microscope at 20x. Count the number of organoids with a tally counter.
NOTE: Here pipette tips have been consistently used with a minimal diameter of 457 μm, which is 5-10 times the diameter of the organoids that are seeded. For transferring volumes of 2 mL or larger (e.g., steps 1.16 and 2.1), use serological pipettes with tip diameters excess of 1,500 μm. - Calculate the organoid density using the following equation:
The desired density is 1,000 organoids/mL to simplify further dilution. If the density is too low, centrifuge at 450 x g for 5 min and aspirate media. Add media necessary to reach 1,000 organoids/mL, and pipette thoroughly to create a homogenous mixture.- To grow organoids in a protein matrix, seed organoids at a concentration of 1 organoid/μL in collagen type 1 diluted to 87% or in basement membrane extracted from Engelbreth-Holm-Swarm mouse sarcoma. While working with samples, keep on ice.
- To freeze organoids, transfer the desired volume to a separate centrifuge tube. Spin down at 450 x g for 5 min. Aspirate media, and then add the same volume of 90% FBS/10% DMSO. Resuspend the organoids, and then aliquot into cryotubes. Transfer to -80 ˚C, and then to liquid nitrogen within one week.
- To thaw, warm in a 37 ˚C water bath for one min. Centrifuge at 450 x g for 5 min, and then aspirate freezing media. Rinse with sterile DPBS, and then centrifuge again. Aspirate DPBS and add organoid media.
- Pipette 50 µL (50 organoids) into each well of the low adhesion plate (Figure 1I).
- Add 150 µL of organoid media to bring the total working volume to 200 µL. Organoid media consists of 1% penicillin-streptomycin and 1% insulin-transferrin-selenium (ITS) in DMEM/F12 media.
- Every 2 days replace media carefully.
NOTE: Low adhesion plates are not tissue culture treated; therefore, the cells can be easily detached. Aspirate media slowly by tilting the plate and inserting the pipette tip at the edge of each well. Leave a small amount of media in the bottom of the well. Add new media slowly to avoid applying unnecessary shear forces to organoids.
3. Co-culturing with macrophages
- Maintain GFP or dTomato-labelled RAW 264.7 macrophages in DMEM media supplemented with 10% FBS and 1% penicillin-streptomycin. Seed 1 x 10⁴, 5 x 10⁴, or 1 x 10⁵ cells/mL into organoid media.
- Use live cell phase contrast and fluorescent imaging to monitor macrophage infiltration over time.
4. Immunofluorescence staining of organoids
NOTE: Organoids can be stained in low adhesion wells or can be transferred to chamber slides. To transfer, gently pipette up and down until organoids have detached from plates. Transfer to chamber slides and incubate for 4-8 h to allow organoids to adhere to the plate surface.
- Remove organoid medium from the wells by carefully aspirating. Fix samples with 10% neutral buffered formalin for 15 min at RT.
- Wash 3x 5 min in 1x PBS. If desired, fixed samples can be stored at 4 °C for one week for further staining.
- Permeabilize with 0.1% 4-(1,1,3,3-Tetramethylbutyl) phenyl-polyethylene glycol for 5 min.
NOTE: To stain for F-actin, incubate samples with phalloidin diluted 1:1,000 and 1.67 nM bisbenzimide nuclear dye in 1% PBS/BSA for 1 h at RT. Then, proceed to step 4.8. - Bermeabilize with 0.5PBS. Samples can be stored at 4opy images and immunofluorescent images. mechanisms that contribute to CTC rlock with 5% normal goat serum in 0.1% PBS/Polyethylene glycol sorbitan monolaurate (PBST) for 1 h at RT. Wash 3x 5 min with PBS.
- Incubate with Anti-Cytokeratin 14 diluted 1:1,000, E-Cadherin diluted 1:200, or Tight Junction Protein One diluted 1:100 in 1% NGS in PBST for 1 h at RT. Wash 3x 5 min in PBST.
- Incubate with Goat Anti-Rabbit secondary diluted 1:200 with 1% NGS/PBST for 1 h at RT. Cover with foil to avoid light exposure.
- Wash 3x 5 min in PBS. Use the nuclear dye (see Table of Materials) to stain nuclei.
- Wash 3x 5 min in PBS. If using chamber slide, mount with a coverslip. Store wrapped in foil at 4 °C for up to 2 weeks.
Irradiated epithelial mammary organoids were successfully obtained from mouse mammary glands, processed, and cultured on low-adhesion plates (Figure 1). Organoid yield was tested by seeding in different growth environments (Figure 2A-G). Seeding cells directly onto tissue culture treated 10 cm cell plates yielded an overgrowth of fibroblast cells. Fibroblasts were identified under phase contrast microscopy in or near the same plane of focus as organoids, and they quickly grew out from plated organoids within a few days. An outgrowth of fibroblasts was also observed when organoids were seeded in basement membrane and collagen protein matrices (Figure 2E,F).
A variety of conditions were tested in optimizing irradiated organoid growth (Figure 2H). Collagenase types I and VIII from clostridium histolyticum were used as the enzyme in the organoid digestion step12,16,17. Organoid yields were significantly higher after digestion with collagenase VIII. This may be due to the purification processes used in producing the enzyme: collagenase type I is partially purified and may cause unnecessary damage to membrane proteins and receptors, leading to poor organoid formation, cell lysis, or over-digestion16,17,18. No significant differences in yield between irradiated and control organoids were observed.
Irradiated organoids could be cultured in low adhesion plates (Figure 3A-C) or within basement membrane (Figure 3D-G), but the most rapid growth occurred in low adhesion plates (Figure 3H). Organoids recapitulated mammary gland characteristics. White arrowheads indicate constructs morphologically similar to ducts and lobes19,20,21 (Figure 3C), which are critical for the production and transport of milk in the mammary gland21. However, further characterization is required to confirm this observation. Growth trends indicated that non-irradiated organoids grew faster than irradiated organoids (Figure 3H), most likely due to cell growth arrest resulting from mechanisms of DNA damage repair; however, the trend was not statistically significant22. Occasional clumping of low adhesion organoids was observed, and organoids could be cultured up to two weeks before dissociating.
Organoids expressed epithelial characteristics, which were evaluated through immunofluorescence staining of Cytokeratin 14 (K14), E-Cadherin (E-cad), and Tight Junction Protein 1 (ZO-1)23,24,25 (Figure 4). Irradiated organoids expressed epithelial markers. K14, a marker of myoepithelium23, was expressed strongly on the surface of irradiated organoids (Figure 4A). Additionally, E-cad and ZO-1 were expressed within cellular junctions of organoids (Figure 4B, C). These proteins are essential for proper cell adhesion24. After irradiation, organoids continued to retain their epithelial characteristics.
Fluorescent staining of organoids could be visualized within low adhesion plates using fluorescence microscopy (Figure 5A-D); however, the clearest visualization was obtained via confocal microscopy (Figure 5E-F). Corrected total fluorescence intensity was calculated by subtracting the background and normalizing by organoid area (Figure 5G). Growing organoids in the 96-well low adhesion plates also simplified co-culture experiments. When seeded at concentrations typical in the mammary gland, macrophages co-localized with control and irradiated organoids (Figure 6)24,26.
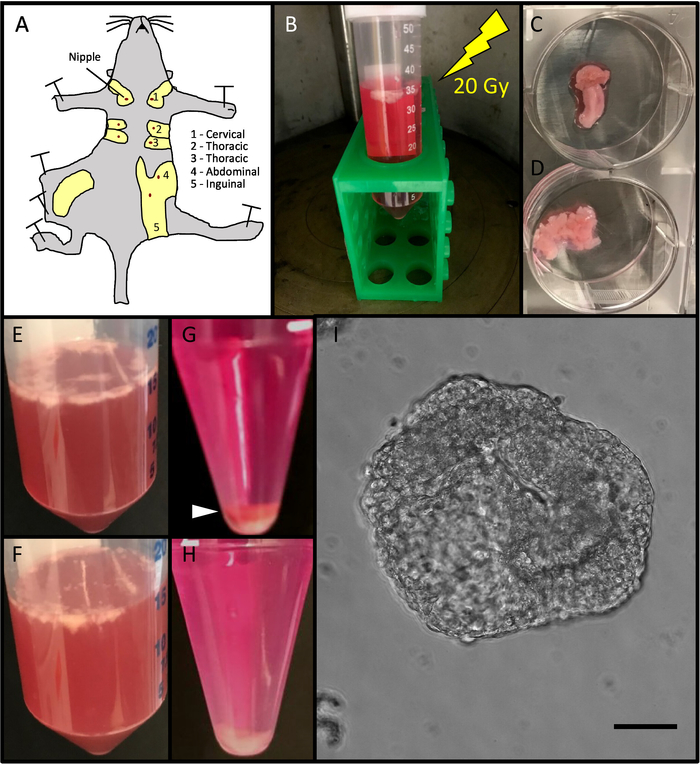
Figure 1. Method Workflow. (A) Mammary glands were resected from mice. The abdominal and inguinal mammary glands were used. (B) Mammary glands were irradiated in 50 mL centrifuge tubes containing DMEM/F12 media. (C) Mammary glands were transferred to sterile six-well plates and cut with surgical scalpels until minced (D). (E) Mammary glands were transferred into 50 mL centrifuge tubes containing 5 mL of sterile DMEM/F12 media per gland and digested in a collagenase VIII solution (F). (G) After being transferred to a 15 mL tube, centrifugal differentiation was utilized to remove stromal cells, single cells, and red blood cells, observed in a red pellet (white arrow-head) until only white epithelial organoids were obtained (H). (I). 50 organoids were plated in 200 µL of media in 96-well low adhesion plates and imaged using phase contrast microscopy Scale bar represents 50 µm. Please click here to view a larger version of this figure.
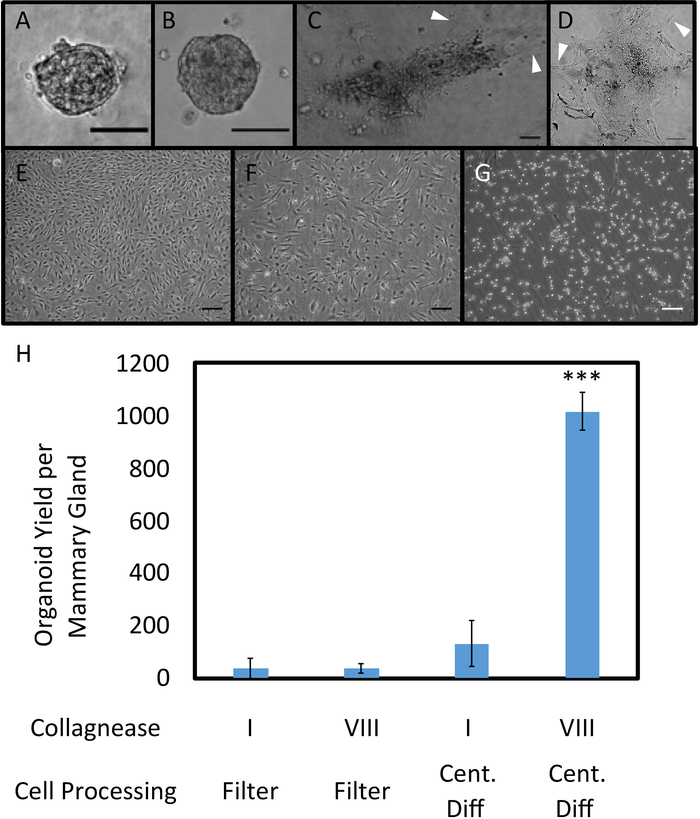
Figure 2. Organoid Plating in 3D Protein Matrices and on Tissue Culture Treated Plastic. Organoids seeded in collagen (A) and basement membrane (B), imaged after 84 hours of growth. Outgrowth of fibroblasts occurred in matrix plated organoids (C, D). Phase contrast images of organoids sorted through filtration were obtained 192 hours after seeding. No major differences between the filtrate (E) and retentate (F) were observed, with both resulting in confluent fibroblast growth. Cells in E and F were seeded on tissue culture treated plastic. After trypsinizing for 5 min at RT, fibroblasts were removed via aspiration; however, remaining epithelial cells formed a monolayer culture instead of three-dimensional organoids (G). Scale bars for A-G represent 100 µm. (H) Different collagenase types (I (CI) and VIII (CVIII)) and cell processing methods (filtration and centrifugal differentiation (Cent Diff)) were tested, and organoid yield per mammary gland was quantified (n = 2 glands for CI, Filter; 2 glands for CVIII, Filter; 4 glands for CI, Cent Diff, and 12 glands for CVIII, Cent Diff). Statistical significance was determined using a two-tailed, unpaired t-test, ***p<0.0001. Error bars represent standard error. Please click here to view a larger version of this figure.
Figure 3. Representative Organoid Growth. Phase contrast images of irradiated organoid growth in low adhesion plates obtained 20 (A), 44 (B), and 106 (C) hours after seeding. White arrowheads indicate structures that have similar morphology to ducts and lobes. Phase contrast images of irradiated organoid growth in basement membrane obtained 42 (D), 66 (E), 60 (F), and 114 (G) hours after seeding. Scale bars represent 50 µm. H. Area measurements were obtained in different growth conditions: organoids immediately seeded after digestion and sorting (Irradiated (●), Control (▪)), and organoids seeded in basement membrane (Irradiated (○), Control (□)) (n = 3 glands each). Area calculations were made using ImageJ software. Error bars represent standard error. Please click here to view a larger version of this figure.
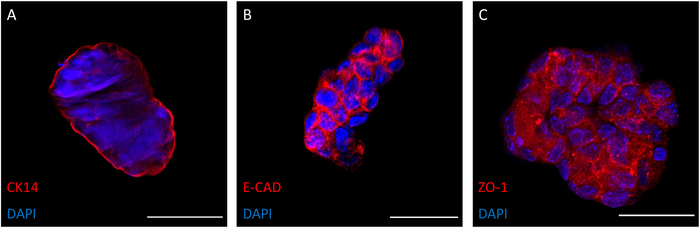
Figure 4. Epithelial Marker Expression on Irradiated Organoids. Cytokeratin 14 (K14, green), a marker for the basal layer of squamous and non-squamous epithelia, was expressed on irradiated organoids (A). E-cadherin (E-Cad), a protein essential for adhesion, was expressed within the junctions between cells in irradiated organoids (B). Tight junction protein one (ZO-1) was also expressed within cell junctions of irradiated organoids (C). Images were obtained in chamber slides via confocal microscopy. A nucleic acid stain was used to visualize nuclei (blue). All organoids were fixed and imaged after one week of growth. Scale bars are 50 µm. Please click here to view a larger version of this figure.
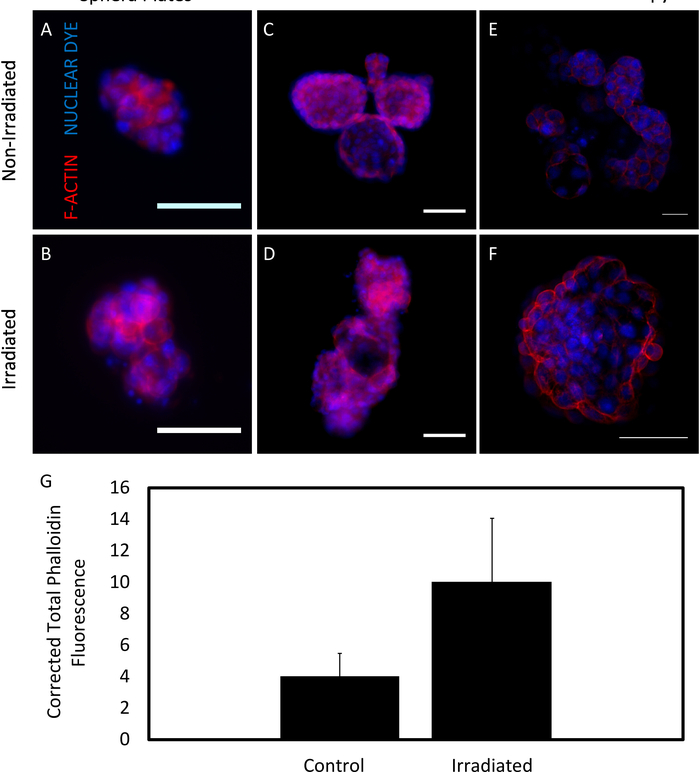
Figure 5. F-actin expression in organoids. F-actin (red), a microfilament in epithelial cells, was expressed with lower intensity in non-irradiated organoids (A, C, E) than in irradiated (B, D, F) organoids. A nucleic acid stain was used to visualize nuclei (blue). Images were taken on low adhesion 96-well plates (A, B) and 16-well chamber slides (C, D). Images were also taken using confocal microscopy (E, F). All organoids were fixed and imaged after one week of growth. Scale bars are 50 µm. G. Phalloidin fluorescence data from low adhesion plate images were quantified in ImageJ (n = 3 glands). Error bars indicate standard error. Please click here to view a larger version of this figure.
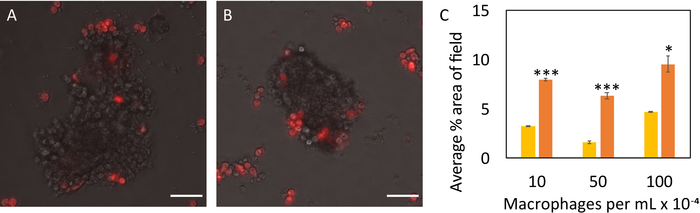
Figure 6. Evaluating cell-cell interactions through macrophage-organoid co-culture. Macrophages (red) infiltrated control (A) and irradiated (B) organoids. Scale bars represent 50 μm. Average percent area of macrophages in the image field (C) was reported at 24 hours of co-culture for control (yellow) and irradiated (orange) organoids (n=3 glands for each sample). Macrophages were seeded at concentrations of 10,000 cells/mL, 50,000 cells/mL, and 100,000 cells/mL, and their infiltration was captured every 30 minutes via live cell fluorescence imaging. All co-culture experiments commenced 7 days after initial organoid seeding. Statistical significance was determined using a two-tailed, unpaired t-test, *p<0.05, ***p<0.0001. Please click here to view a larger version of this figure.