1. Oligonucleotide library design and preparation
- Library design
- Based on the following criteria design a library of quenched fluorescent oligonucleotide probes between 8 and 12-mer long to avoid secondary structure formation, with equal length for all probes.
- Include at least one DNA and one RNA random sequence containing a combination of adenine (A), guanine (G), cytosine (C) and thymine (T)/uracil (U) (DNA and RNA probes in Table 1).
NOTE: The DNA and RNA sequences described in Table 1 have been useful as the initial substrates for classifying an unknown type of nuclease activity, either DNase or RNase. These two sequences are recommended as the starting point for any screening, as they have shown a wide capability to detect nuclease activity profiles in bacteria and tissue samples. If nuclease activity is not observed with these DNA and RNA sequences, the design of additional oligonucleotides is required. - Include polynucleotide sequences consisting of a single type of nucleotide to determine sequence dependence for a given nuclease activity (DNA-Poly A, DNA-Poly T, DNA-Poly C, DNA-Poly G, RNA-Poly A, RNA-Poly U, RNA-Poly C and RNA-Poly G in Table 1).
- Using the same sequence of nucleotide residues as the initial DNA and RNA sequences, include sequences that contain nucleoside analogs harboring chemical modifications at the 2'-position of the ribose sugar, such as 2'-Fluoro and 2'-O-Methyl, as a stringent step for increasing the selectivity of the nucleases.
- Include fully modified sequences consisting entirely of 2'-Fluoro nucleoside analogs or 2'-O-Methyl nucleoside analogs (All 2'-F and All 2'-OMe, Table 1)
- Include chimeric sequences consisting of unmodified natural purines and 2'-Fluoro pyrimidine nucleoside analogs (RNA Pyr-2'F, Table 1).
- Include chimeric sequences consisting of unmodified natural purines and 2'-O-Methyl pyrimidine nucleoside analogs (RNA Pyr-2'OMe, Table 1).
- Include chimeric sequences consisting of unmodified natural pyrimidines and 2'-Fluoro purine nucleoside analogs (RNA Pur-2'F, Table 1).
- Include chimeric sequences consisting of unmodified natural pyrimidines and 2'-O-Methyl purine nucleoside analogs (RNA Pur-2'OMe, Table 1).
- Include at least one DNA and one RNA random sequence containing a combination of adenine (A), guanine (G), cytosine (C) and thymine (T)/uracil (U) (DNA and RNA probes in Table 1).
- Based on the following criteria design a library of quenched fluorescent oligonucleotide probes between 8 and 12-mer long to avoid secondary structure formation, with equal length for all probes.
- Oligonucleotide probe preparation and storage
NOTE: Oligonucleotides are synthesized by the phosphoramidite method. After synthesis, the oligonucleotides are purified using high performance liquid chromatography (HPLC) and the mass is measured by mass spectrometry.- Spin down the lyophilized oligonucleotide probes using a centrifuge and dilute them in Tris-EDTA (TE) buffer to prevent nuclease degradation. Determine the dilution volume according to the yield of each probe to render a stock solution with a concentration of 500 pmol/μL.
- Store lyophilized oligonucleotides at 4 °C or room temperature for a short term. For long term storage (months to years), store lyophilized oligonucleotides at -20 °C. Upon resuspension of lyophilized oligonucleotides in TE, store the stock solutions at -20 °C or, preferably, at -80 °C.
2. Bacterial culture
- Take one porous glass bead from the cryogenic storage vial under sterile conditions.
- To isolate individual bacterial colonies (Salmonella and E. coli), use the quadrant method24 by streaking/rolling the bead directly onto a Petri dish containing Tryptic Soy Agar (TSA) medium supplemented with defibrinated sheep blood.
- Incubate the culture at 37 °C for 24 h.
3. Supernatant preparation
- Transfer a single colony from solid media to 50 mL Tryptic Soy Broth (TSB) and incubate at 37 °C for 24 h at 200 rpm.
- Dilute the culture (1:500) in TSB (sub-culture) and incubate at 37 °C for 24 h at 200 rpm in a shaking incubator.
NOTE: It is expected that after 24 h of incubation the bacterial cultures are in stationary phase reaching values higher than 109 CFU/mL. - After the incubation period, transfer the cultures to capped sterile tubes and centrifuge at 4,500 x g for 30 min.
- Collect the supernatant and use it immediately. Alternatively, store the supernatants at 4 °C or -20 °C.
4. Nuclease Activity Assay
- Preparation of working solutions
- Prepare a 20 μL working solution for each probe in 1.5 mL nuclease free microcentrifuge tubes by diluting (1:10 ratio) the stock solution (500 pmol/μL) for a final working concentration of 50 pmol/ μL. For that purpose, mix 18 μL of Phosphate Buffer Saline (PBS) containing MgCl2 and CaCl2 with 2 μL of probe stock solution.
NOTE: Be aware that in the working solution, the oligonucleotides are more vulnerable to nuclease degradation, therefore, it is recommended to prepare the working solutions just before setting up the reaction. - Avoid direct light contact during the preparation and keep in the dark (wrapped in foil), when dealing with fluorophores.
- Prepare a 20 μL working solution for each probe in 1.5 mL nuclease free microcentrifuge tubes by diluting (1:10 ratio) the stock solution (500 pmol/μL) for a final working concentration of 50 pmol/ μL. For that purpose, mix 18 μL of Phosphate Buffer Saline (PBS) containing MgCl2 and CaCl2 with 2 μL of probe stock solution.
- Reaction set up
- Pre-warm the fluorometer (e.g. Cytation 1) to 37 °C.
- Prepare a set (one tube/probe) of 1.5 mL nuclease free microcentrifuge tubes for each sample (TSB, E. coli and Salmonella) and label accordingly.
- Carefully add 96 μL of TSB sterile culture media, Salmonella supernatant or E. coli supernatant (from the step 3.4.). Subsequently, add 4 μL/tube of probe working solution accordingly. Perform this step at room temperature.
NOTE: 10 probes were used for the first round of the screening and 6 probes for the second round. - Mix thoroughly by pipetting up and down to obtain a homogenous solution. Avoid introducing air bubbles into the samples while mixing.
- Load 95 μL of each solution (probe + supernatant or culture media) into a separate well of a black bottom, non-treated 96 well plate. Minimize the formation of bubbles in the wells upon loading by dispensing carefully with the tip close to the wall of the well.
- Cover the plate with its lid. Visually inspect the lid and check for pen markings or dust particle accumulation that may introduce measurement artifacts. Replace the lid for a new one if that is the case.
- Measurement set up
- Open the acquisition software (Gen5 3.05) by clicking the software shortcut icon (Figure S1A).
- Select Read Now from the task manager window and choose New… to create the kinetic measurement protocol (Figure S1B).
- Click on Set Temperature in the dialog window titled Procedure and select 37 ˚C. Confirm and save the settings by pressing OK (Figure S1C).
- Click on Start Kinetics in the dialog window titled Procedure. Then in the pop-up dialog window, titled Kinetic Step, select 2 h in the Run Time input box and 2 min in the Interval input box. Confirm and save the settings by pressing OK (Figure S1D).
- Click on Read in the dialog window titled Procedure. Then in the pop-up dialog window, titled Read Method, select Fluorescence Intensity as a detection method, Endpoint/Kinetic as a read type and Filters as optics type. Confirm and save the settings by pressing OK (Figure S1E).
- In the pop-up dialog window titled Read Step (Kinetic), select Green from the Filter Set. Confirm and save the settings by pressing OK (Figure S2A).
- In the dialog window titled Procedure, select use lid and click on validate to ensure that the created protocol is valid. This is confirmed by a pop-up dialog window (Figure S2B).
- Select protocol in the menu bar and choose procedure (Figure S2C).
- In the dialog window titled Procedure, define the wells to be measured (Figure S2D).
- Enter the name of the experiment in the file name input box (Figure S2E).
- Load the plate with its lid into the plate reader. Ensure the plate is in the right orientation.
- Start the acquisition by clicking read new button in the toolbar (Figure S2F).
- Data Analysis
- Click on one of the measured wells in the dialog window titled Plate 1 (Figure S3A).
- Click select wells and include all the measured wells in the well selection dialog window. Confirm and save the settings by pressing OK. (Figure S3B).
- Select data in the dialog window titled Plate 1 to visualize the tabulated results (Figure S3C).
- Export the data to a spread sheet by selecting quick export from the context menu (Figure S3C).
- In the spread sheet, label the data columns accordingly for each sample and probe.
- Generate kinetic graphs, using line with markers style, by plotting relative fluorescence units (RFU) versus time (x-axis: timeline of the reaction and y-axis: RFUs).
NOTE: The description of generating a graph is applicable when using spreadsheet programs (e.g., Excel). However, any other programs can be used to generate graphs from the raw data obtained, by plotting RFU versus time. - Calculate the rate of the enzymatic reaction for each measured interval according to the following formula25: rate=
 , where If is RFU at the maximal interval time point and Ii is RFU at the minimal interval time point, and Tf and Ti are the maximal and minimal interval time points, respectively.
 - Select the rate with the highest value (Rmax) for each curve. If there is more than one Rmax per sample, select the one that occurs at the earliest measurement time point.
- Calculate the ratio between Rmax and the average value of the time interval at which Rmax occurs: rate coefficient =

- Calculate the fold difference (FD) between the rate coefficient of Salmonella and E. coli for each probe.
- Consider a fold difference value higher than 3 as significant.
- Consider the significant probes with the highest fold difference values (FD) as candidate probes and as the basis for the library design in the next screening round.
5. Screening Rounds’ Selection Criteria (Figure 1)
- First Round of Screening
- Perform the nuclease activity assay (as described in section 4) using DNA, RNA and polynucleotide probes.
- Evaluate the preference for DNA chemistry or RNA chemistry by comparing the number and performance (FD value) of DNA and RNA candidate probes.
- Select the type of nucleic acid chemistry rendering the greatest number of candidate probes, as illustrated in Figure 1.
- Second Round of Screening
- Perform the nuclease activity assay (as described in section 4) using fully modified probes and chimeric probes designed based on the nucleic acid substrate selected in the first screening round.
- Evaluate the preference towards sequences containing 2'-Fluoro and 2'-O-Methyl nucleoside analogs by comparing the results obtained for 2'-Fluoro and 2'-O-Methyl modified candidate probes.
- Select the type of nucleoside analog modification rendering the greatest number of candidate probes, as illustrated in Figure 1.
Figure 1 shows the work flow of this methodology, which is divided into two screening rounds. In the first round of screening, we used 5 DNA probes (DNA, DNA Poly A, DNA Poly T, DNA Poly C and DNA Poly G) and also 5 RNA probes (RNA, RNA Poly A, RNA Poly U RNA Poly C and RNA Poly G). The raw data of this screening round can be found in Supplementary Table 1. In the second round, chemically modified probes were synthesized by replacing the RNA sequence with chemically modified nucleosides (All 2'-Fluoro and All 2'-OMethyl) or by the combination of RNA and purines or pyrimidines chemically modified (RNA Pyr-2'F, RNA Pyr-2'OMe, RNA Pur-2'F and RNA Pur-2'OMe). The raw data of this screening round can be found in Supplementary Table 2. A detailed description of the sequences can be found in Table 1. The results obtained from the first screening round are shown in Figure 2, where Salmonella culture supernatants report a clear preference for RNA probes over DNA probes. In contrast, E. coli and culture media controls show very limited capability to degrade RNA probes. In addition, we have calculated the fold difference (FD) between the rate coefficients of Salmonella and E.coli (Supplementary Table 3 and Supplementary Table 4) in order to identify the best performing probes. The calculations were performed as described in the protocol section.
These results suggest the presence of an RNase type of activity derived from Salmonella. Based on the identification of RNA as the preferred nucleic acid type for Salmonella nucleases, we have designed a new library using chemically modified nucleotides to be used in the second round of screening aimed at increasing the specificity of the probes. Figure 3 shows the kinetic profiles of the probes containing chemically modified nucleotides. Interestingly, RNA Pyr-2'OMe and RNA Pur-2'OMe show the best performing kinetic behavior when compared with RNA Pyr-2'F and RNA Pur-2'F, respectively.
These results suggest that Salmonella has an important RNase activity that can be used for selecting probes capable of specifically recognizing this bacteria. Moreover, we observed that 2'-OMe chemically modified nucleosides are more suitable for the type of RNAses secreted by Salmonella. With this in mind, the protocol described in this contribution offers the possibility of exploring the use of nuclease activity as a biomarker.
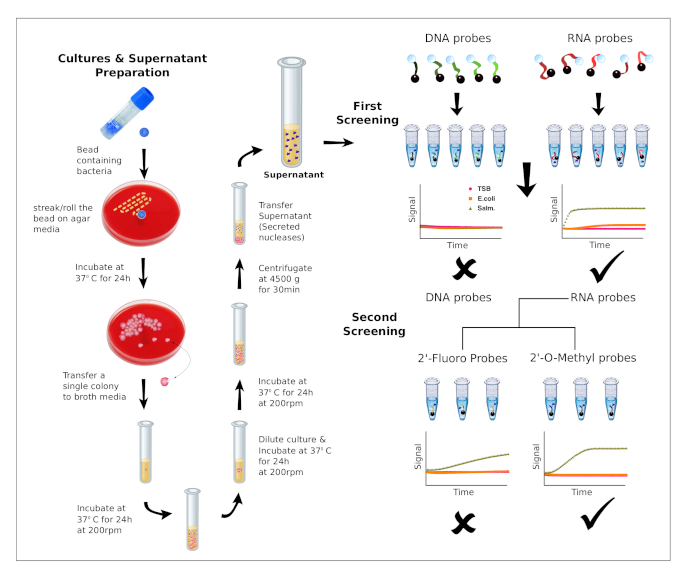
Figure 1: Bacteria cultures and workflow of the screening process. Preparation of bacteria cultures and supernatants (left). Description of the workflow for the two screening rounds. First screening: The preference for DNA or RNA is evaluated using 10 probes. Second screening: Based on nucleic acid preference, additional probes containing chemically modified nucleotides are evaluated to identify the best performing substrates for a given nuclease activity. Please click here to view a larger version of this figure.
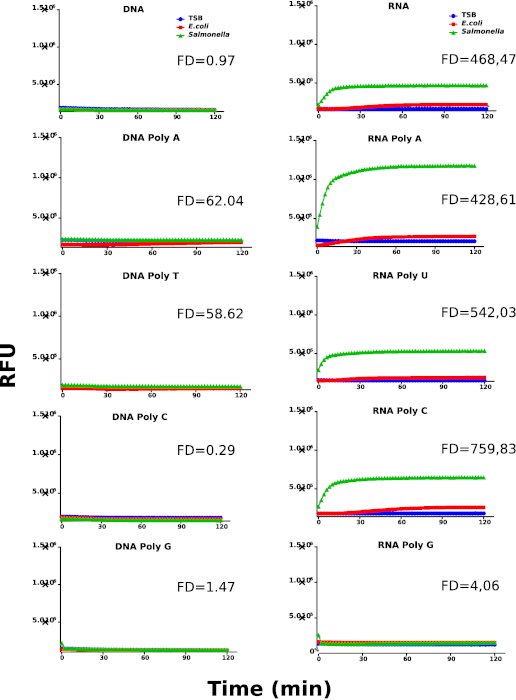
Figure 2: First kinetic screening round. Kinetic profiles of Salmonella, E. coli and culture media (TSB) using DNA and RNA probes. Nuclease activity is represented by relative fluorescence units (RFU). The graphs are representative for at least 3 individually performed experiments. The different samples are labeled as indicated in the graph's legend. Fold difference (FD) values were calculated using the rate coefficients of Salmonella and E. coli for each probe. Please click here to view a larger version of this figure.
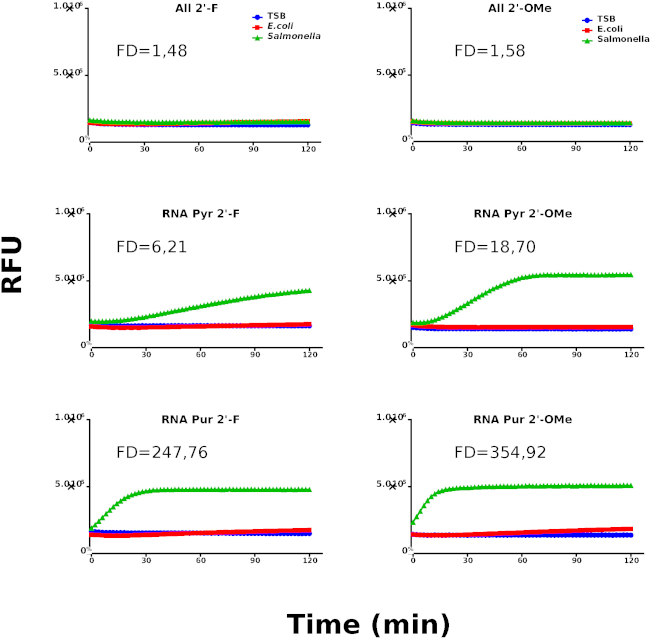
Figure 3: Second kinetic screening round. Kinetic profiles of Salmonella, E. coli and culture media (TSB) using chemically modified probes. Nuclease activity is represented by relative fluorescence units (RFU). The graphs are representative for at least 3 individually performed experiments. The different samples are labeled as indicated in the graph's legend. Fold difference (FD) values were calculated using the rate coefficients of Salmonella and E.coli for each probe. Please click here to view a larger version of this figure.
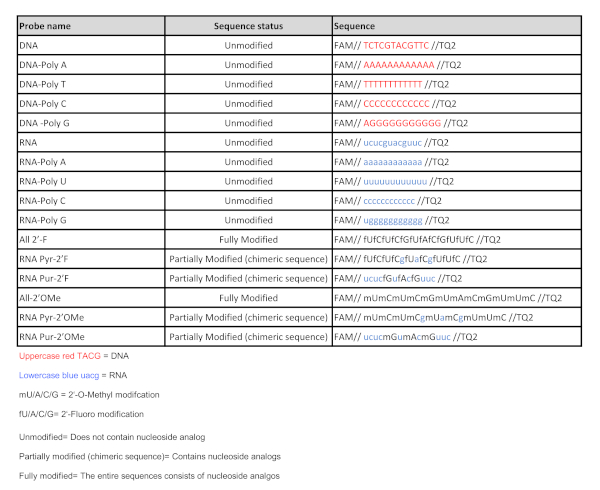
Table 1: Nucleic acid probe sequences. List of all the nucleic acid probes used in this study. Please click here to view a larger version of this figure.
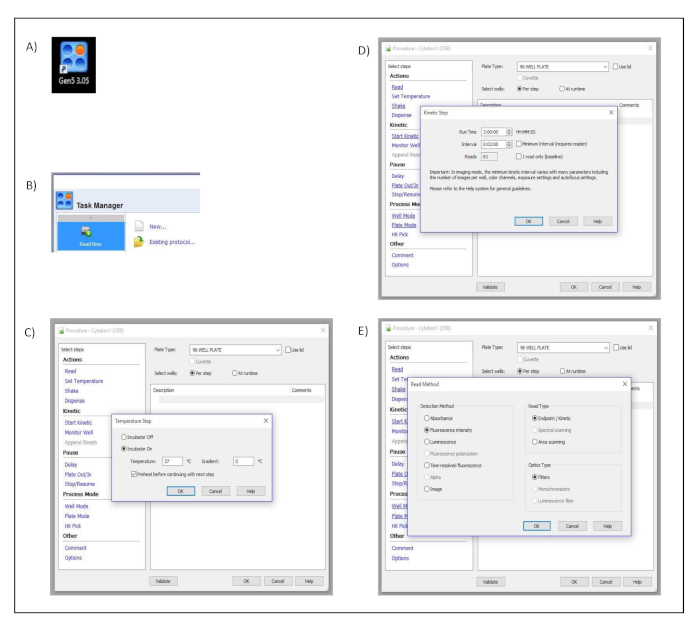
Supplementary Figure 1: Measurement set up. Button clicks and dialog windows describing the stepwise process performed in the acquisition software to set up the different measurement parameters. (A) Desktop icon. (B) Task manager dialog window. (C) Procedure and Temperature Set up dialog windows. (D) Procedure and Kinetic Step dialog windows. (E) Procedure and Read Method dialog windows. Please click here to view a larger version of this figure.
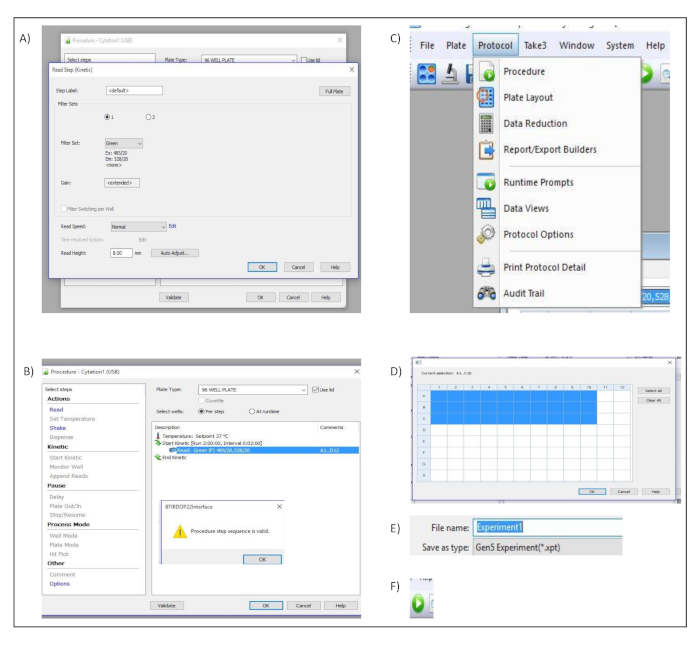
Supplementary Figure 2: Measurement set up. Button clicks and dialog windows describing the stepwise process performed in the acquisition software to set up the different measurement parameters. (A) Procedure and Read Step (Kinetic) Dialog windows. (B) Procedure dialog window (C) "Protocol" menu bar. (D) Well selection dialog window. (E) File name input box. (F) Run New icon used to start the acquisition within the software. Please click here to view a larger version of this figure.
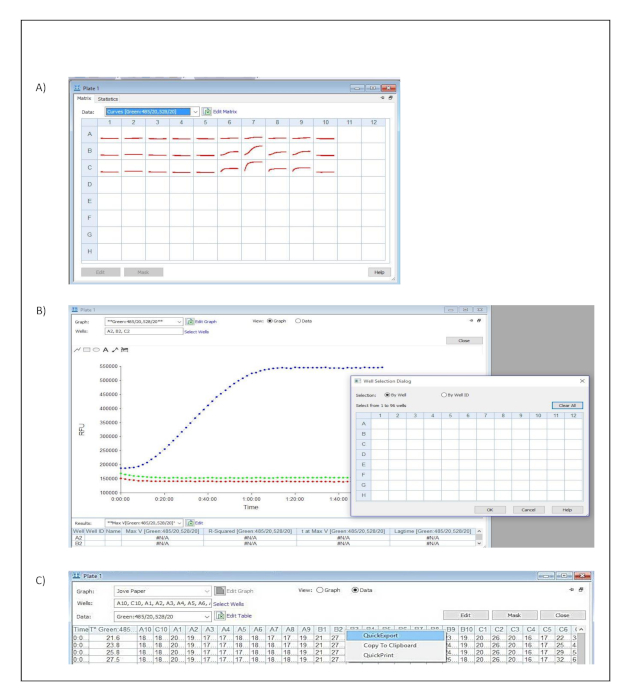
Supplementary Figure 3: Data analysis. Button clicks and dialog windows describing the stepwise process performed in the acquisition software to export acquired data into a spread sheet for further analysis. (A) Plate Matrix dialog window. (B) Plate and Well Selection dialog windows. (C) Plate dialog window and Quick Export context menu. Please click here to view a larger version of this figure.
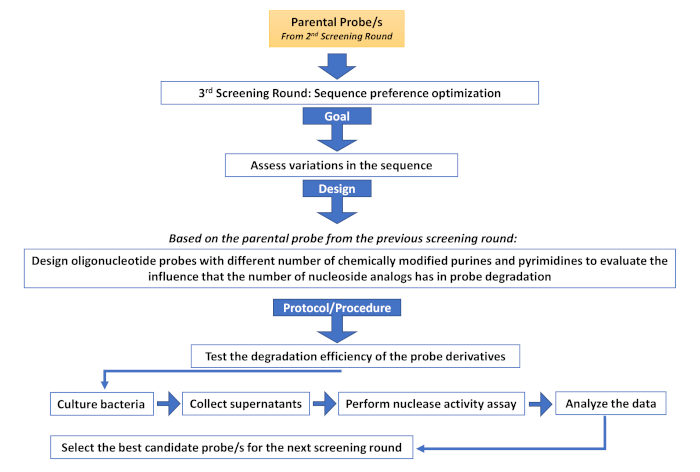
Supplementary Figure 4: Third screening round (Sequence preference optimization). Description of the different steps involved in an additional screening round aimed at assessing sequence variations. Please click here to view a larger version of this figure.
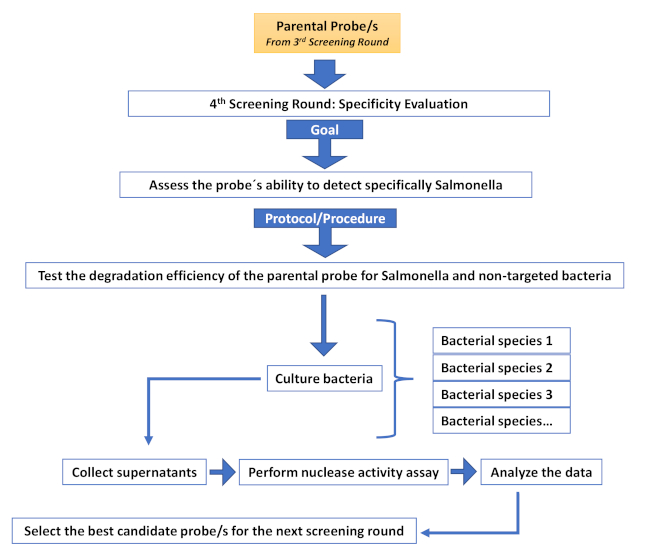
Supplementary Figure 5: Fourth screening round (Specificity evaluation round). Description of the different steps involved in an additional screening round aimed at increasing specificity. Please click here to view a larger version of this figure.
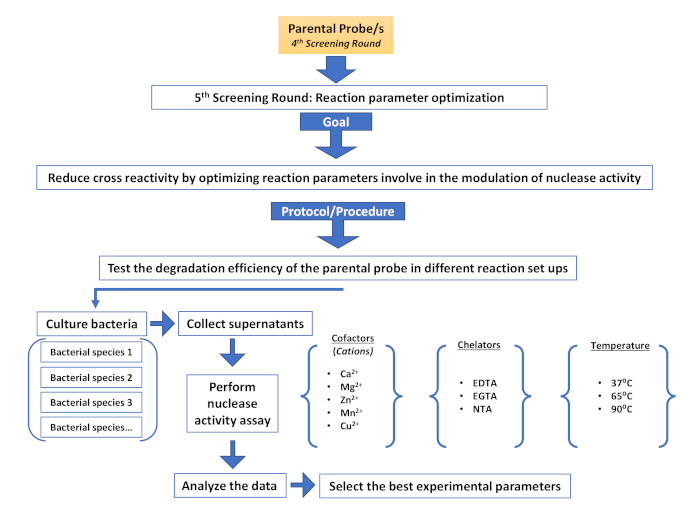
Supplementary Figure 6: Fifth screening round (Reaction parameter optimization). Description of the different steps involved in an additional screening round aimed at reducing non-target cross reactivity by modulating nuclease activity. Please click here to view a larger version of this figure.
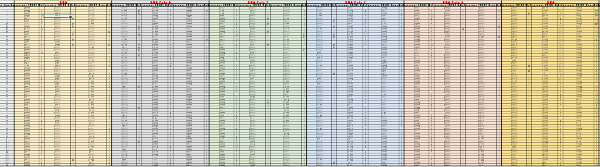
Supplementary Table 1: Raw data from the first screening round. For each probe (labeled in red, on top), the acquisition time and the raw fluorescence values were reported for TSB, E. coli and Salmonella, along with the calculated rate value for each interval. The calculations were carried out as described in the methods section. Please click here to download this file.
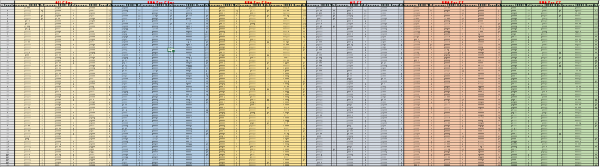
Supplementary Table 2: Raw data from the second screening round. For each probe (labeled in red, on top), the acquisition time and the raw fluorescence values were reported for TSB, E. coli and Salmonella, along with the calculated rate value for each interval. The calculations were carried out as described in the methods section. Please click here to download this file.

Supplementary Table 3: Data analysis for the first screening round. For each probe (labeled in red, on top), the following values were obtained for TSB, E. coli and Salmonella: maximum rate values, minimal and maximal interval time points, rate coefficient, fold difference values between Salmonella and E. coli over TSB and fold difference values between Salmonella and E. coli (highlighted in yellow). The calculations were carried out as described in the methods section and the calculation formulas and the step by step calculations are shown in the spreadsheet. Please click here to download this file.
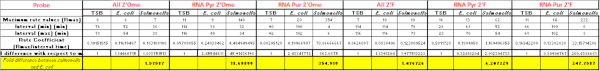
Supplementary Table 4: Data analysis for the second screening round. For each probe (labeled in red, on top), the following values were obtained for TSB, E. coli and Salmonella: maximum rate values, minimal and maximal interval time points, rate coefficient, fold difference values between Salmonella and E. coli over TSB and fold difference values between Salmonella and E. coli (highlighted in yellow). The calculations were carried out as described in the methods section and the calculation formulas and the step by step calculations are shown in the spreadsheet. Please click here to download this file.