Science Education
>

Improving the Accuracy of Flow Cytometric Assessment of Mitochondrial Membrane Potential in Hematopoietic Stem and Progenitor Cells Through the Inhibition of Efflux Pumps

Instructor Prep
concepts
Student Protocol
JoVE Journal
Biology
A subscription to JoVE is required to view this content.  Sign in or start your free trial.
JoVE Journal Biology
Improving the Accuracy of Flow Cytometric Assessment of Mitochondrial Membrane Potential in Hematopoietic Stem and Progenitor Cells Through the Inhibition of Efflux Pumps

All methods described here have been approved by the Institutional Animal Care and Use Committee (IACUC) of the Albert Einstein College of Medicine.

1. Preparation of Solutions

  1. Staining Buffer (phosphate-buffered saline (PBS) + 2% fetal bovine serum (FBS)): Add 10 mL of FBS in 500 mL of a sterile PBS solution.
    NOTE: This solution can be stored at 4 °C for at least one month in sterile condition. Before starting the following procedures, put an aliquot of this solution (50 mL) on ice.
  2. ACK (ammonium-chloride-potassium) lysing buffer: Place an aliquot of ACK lysing buffer (1 mL) on ice before starting the procedure.
    NOTE: To prepare the same non-commercial buffer, dissolve 8.02 g of NH4Cl, 1 g of KHCO3 and 37.2 mg of Na2EDTA in 1 L of H2O. Adjust the pH to 7.2-7.4. Store for up to 6 months at room temperature.
  3. Culture medium: Add 50 ng/mL stem cell factor (SCF) and 50 ng/mL thrombopoietin (TPO) to serum-free medium for culture and expansion of hematopoietic cells (see Table of Material for commercial medium recommended).
  4. TMRM stock solution: Prepare TMRM (1 μM) solution by dissolving 5 μg of TMRM powder in 10 mL of ethanol. Store this solution at -20 °C protected from the light.
  5. Verapamil stock solution: Prepare Verapamil (50 mM) solution by diluting 24 mg of Verapamil in 1 mL of ethanol. Store this solution at -20 °C.
  6. FCCP stock solution: Prepare carbonilcyanide p-triflouromethoxyphenylhydrazone (FCCP) (1 M) solution by dissolving 254 mg in 1 mL of ethanol. Store this solution at -20 °C protected from the light.

2. Bone Marrow Isolation

  1. Euthanize the mouse by CO2 inhalation following institutional guidelines and spray the mice with 70% ethanol.
    NOTE: This step prevents contamination of the cells of interest without compromising experimental results.
  2. Using a pair of forceps and sharp scissors, make a small snip in the ventral skin of the mouse and stretch the skin.
  3. Extract the femur and tibia while taking care not to dislodge the heads of the femur as they contain a large amount of bone marrow cells. Place the removed bones in a 6-well plate filled with 1.5 mL of staining buffer.
    NOTE: This procedure does not require sterile area.
  4. Remove the muscles from the bones and cut the ends of the bones allowing the exit of the bone marrow (Figure 1A). Place the cleaned bones in new wells with 1.5 mL of staining buffer.
    NOTE: Muscles and other tissues must be carefully removed to avoid syringe clogging in the next step.
  5. Flush out the bone marrow using a 3 mL syringe with a 25 G needle.
    NOTE: Continue to flush the bone marrow until the bone becomes white (Figure 1B).
  6. Collect all cells in a 1.5 mL tube, centrifuge for 5 min at 180 x g then discard the supernatant (Figure 1C).
  7. Resuspend the pellet in 300 μL of ice cold ACK lysing buffer very carefully, put on ice for 1 min and immediately inactive lysis by adding 1 mL of staining buffer. Centrifuge for 5 min at 180 x g.
    NOTE: The cells pellet appears white (Figure 1D). The total number of cells isolated is about 2-4 x 10⁷.
  8. Resuspend the pellets in 1 mL of staining buffer and filter using a cell-strainer cap (12 x 75 mm2, 5 mL of capacity) with a 35 μm nylon mesh incorporated to obtain mononuclear cells. After blocking, keep the sample on ice.

3. Immunostaining for Detection of HSC

  1. Prepare Lineage (Lin) cocktail. In 400 μL of staining buffer, add 4 μL of the following biotinilated antibodies against CD3e, CD4, CD8, B220, CD11b, Gr1, Ter119, CD19, Nk1.1, IgM and Il7Ra to obtain a final dilution 1:100.
  2. Prepare fluorophores conjugated-antibodies (Abs). In 400 μL of staining buffer, add 4 μL of the following Abs to obtain a final dilution 1:100. Streptavidin-Pacific Blue, Sca1-PE/Cy7, c-kit-APC/Cy7, CD48-APC, CD150-PerCP/Cy5.5 and CD34-FITC. Keep in ice, protected from light.
  3. Centrifuge the sample for 5 min at 180 x g, then discard the supernatant.
  4. Add 400 μL of Lin cocktail solution to the cells pellet. Add 4 μL of CD135-biotinilated Ab. Vortex quickly to mix and incubate for 30 min in ice.
  5. Wash the sample adding 3 mL of staining buffer, spin down for 5 min at 180 x g and discard the supernatant.
  6. Add 400 μL of Abs solution. Vortex quickly to mix and incubate for 30 min on ice.
  7. Wash the samples with 3 mL of staining buffer, spin down for 5 min at 180 x g and discard the supernatant.

4. TMRM Staining

  1. Prepare TMRM staining solution. Add 2.2 μL of TMRM stock solution and 1.1 μL of Verapamil (2 nM and 50 μM as final concentration, respectively) in 1.1 mL of serum-free medium for culture and expansion of hematopoietic cells (see Table of Material for commercial medium recommended) with TPO and SCF.
    NOTE: This is the most important step of the protocol. Verapamil addition is necessary to block the efflux pumps which are highly expressed in the HSCs and can extrude TMRM.
  2. Resuspend the bone marrow in 1 mL of TMRM staining solution, vortex quickly and incubate for 1 h at 37 °C.
    NOTE: TMRM staining must not be washed out. PE-dedicated compensation control is also resuspended in 100 μL of TMRM staining solution, and subjected to incubation for 1 h at 37 °C after quick vortex.
  3. Filter the sample using a cell-strainer cap (12 x 75 mm2, 5 mL of capacity) with a 35 μm nylon mesh incorporated to avoid clogging of the flow cytometer.
    NOTE: TMRM staining increases the possibility of clog formation in the sample. Filtration of the sample just before flow assays is recommended.
  4. Add 1 μL of 4’,6-diamidino-2-phenylindole (DAPI) to exclude dead cells by flow cytometry.

5. Acquisition by Flow Cytometer

  1. Run bone marrow sample and acquire at least 1 x 10⁶ events.
  2. Set up the gating strategy to identify the different hematopoietic populations (Figure 2).
    1. Display live bone marrow mono-nuclear cells (BM-MNCs), DAPIfraction, in plot for Pacific Blue to identify CD135Lin (Lin) and Lin+ fractions.
    2. Plot Linfraction for APC/Cy7 (c-kit) versus PE/Cy7 (Sca-1) to identify multipotent progenitors (MPP) fraction, as c-kit+ and Sca-1+.
    3. Plot MPP fraction for APC (CD48) versus PerCP/Cy5.5 (CD150) to identify HSC fraction, as CD150+ and CD48.
    4. Display HSC fraction for FITC (CD34) to divide CD34-HSC and CD34+-HSC.
  3. Acquire the TMRM intensity (PE channel) in each population.
  4. After acquisition, add to the sample 1 μL of FCCP to obtain the final concentration of 1 mM and incubate at 37 °C for 5 min, then acquire 1 x 10⁶ events.
    NOTE: FCCP is a mitochondrial uncoupler which is used to dissipate the ΔΨm. It is used as experimental control to confirm that TMRM staining works correctly. After the administration of FCCP, the TMRM intensity should drastically be decreased (Figure 3A).
  5. Analyze data normalizing the average intensity of PE of each population by the intensity of PE of all BM-MNCs.

Improving the Accuracy of Flow Cytometric Assessment of Mitochondrial Membrane Potential in Hematopoietic Stem and Progenitor Cells Through the Inhibition of Efflux Pumps

Learning Objectives

The protocol described above enables the easy isolation of BM-MNCs from a mouse model. Figure 1 summarizes the main steps of the protocol: bone isolation, flushing out of the bone marrow, red blood cell lysis, and antibody staining followed by TMRM staining to measure mitochondrial membrane potential in a specific hematopoietic population.

BM-MNCs contain several cell populations, including HSCs. The antibody cocktails used in this protocol are well-established in the purification of HSCs (CD34 and CD34+), multipotent progenitor cells (MPPs), Lin as well as Lin+ cells, respectively 21. The gating strategy for isolating these fractions is shown in Figure 2.

After the identification of populations of interest, TMRM intensity, which should appear as a bright signal, was assessed. TMRM staining in serum-free expansion medium (SFEM) is highly recommended, as TMRM profiles in HSPCs can undergo alteration when staining is performed in PBS +2% FBS (Figure 3A).

Figure 3C shows the average intensity of each population, which is normalized by the intensity of BM-MNCs. HSCs express high activity levels of xenobiotic efflux pumps capable of extruding TMRM dye20, and indeed, we found TMRM profiles in HSPCs were changed in the presence of Verapamil (Figure 3B,C). Similar results were obtained by other inhibitors such as Cyclosporin H (Figure 3C). Thus, the accurate amount of TMRM loaded in the mitochondria by ΔΨm can be measured after inhibition of the efflux pumps by Verapamil or Cyclosporin H (Figure 3C).

Finally, FCCP can be used to verify the accuracy of TMRM staining. FCCP depolarizes mitochondria, resulting in a reduction in TMRM intensity (Figure 3D). This approach can also be used to determine the background intensity of the staining and/or as a negative control.

Figure 1
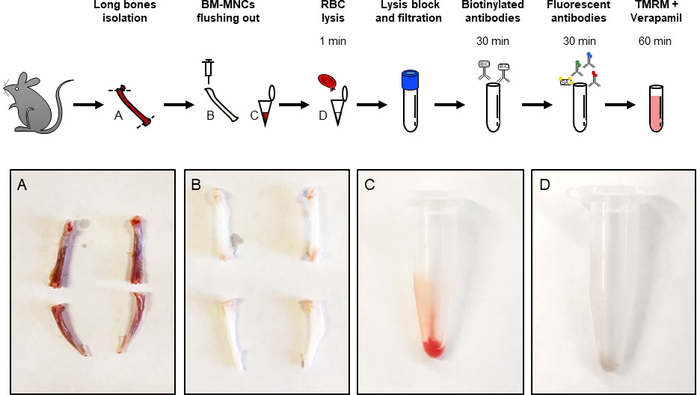
Figure 1: Protocol flowchart. Graphical summary of the procedure to isolate and stain BM-MNCs to determine ΔΨm. Critical steps are highlighted by picture inserts (A-D). Femurs and tibias from adult C57BL/6 mice were isolated and their ends are removed (A). Long bones as in A after flush out (B). Isolated BM-MNCs before (C) and after (D) ACK lysis. Please click here to view a larger version of this figure.

Figure 2
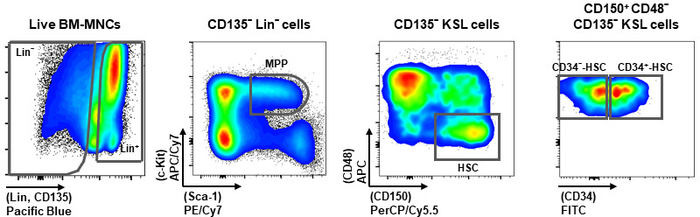
Figure 2: Gating setup. Schematic representation of gating strategy to identify the different hematopoietic populations, including CD34-HSC and CD34+-HSC, MPP, Lin and Lin+ cells. The panels were modified from Bonora, M. et al.11. Please click here to view a larger version of this figure.

Figure 3
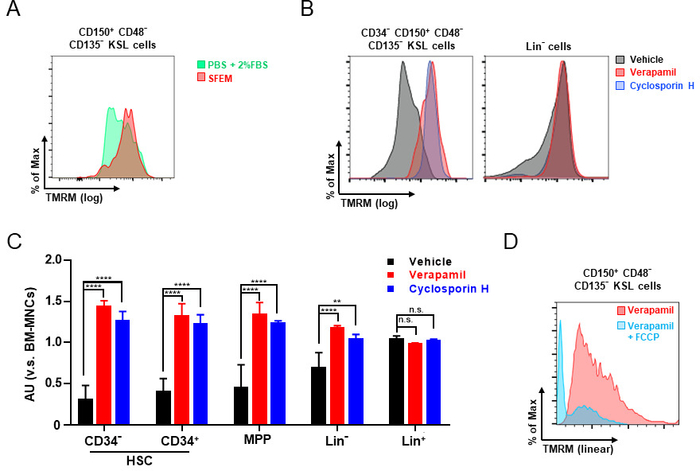
Figure 3: Flow cytometry analysis of mitochondrial membrane potential. (A) Representative distribution of ΔΨm in HSCs stained with TMRM in PBS+2%FBS (green) or in serum-free expansion medium (SFEM) (red). (B, C) Representative distribution of ΔΨm in CD34-HSC and Lin cells (B) and quantification of ΔΨm in CD34-HSC, CD34+-HSC, MPP, Lin and Lin+ cells (C) stained with TMRM in presence or absence of efflux pump inhibitors. TMRM intensity of each population was normalized by the TMRM intensity of own BM-MNCs (modified from Bonora, M. et al.11). (D) Representative histogram of TMRM intensity distribution in HSCs before (pink) and after (light blue) FCCP addition. Please click here to view a larger version of this figure.

List of Materials

ACK lysing buffer Life Technologies A1049201
B220-biotin BD Bioscience 553086
CD3e-biotin Life Technologies 13-0031-85
CD4-biotin Fischer Scientific BDB553782
CD8-biotin Life Technologies 13-0081-85
CD11b-biotin BD Bioscience 553309
CD19-biotin BD Bioscience 553784
CD34-FITC eBioscience 11-0341-85
CD48-APC eBioscience 17-0481-82
CD135-biotin eBioscience 13-1351-82
CD150-PerCP/Cy5.5  Biolegend 115922
c-kit-APC/Cy7 Biolegend 105826
Cyclosporin H Millipore Sigma SML1575-1MG
DAPI solution (1mg/mL) Life Technologies 62248
Fetal Bovine Serum (FBS) Denville FB5001-H
FCCP Millipore Sigma C2920-10MG
Gr1-biotin Biolegend 108404
IgM-biotin Life Technologies 13-5790-85
Il7Rα-biotin eBioscience 13-1271-85
Nk1.1-biotin Fischer Scientific BDB553163
Phosphate buffered saline (PBS) Life Technologies 10010023
Sca-1-PE/Cy7 eBioscience 25-5981-81
SCF murine PEPROTECH 250-03-10UG
StemSpan SFEM medium STEMCELL technologies 9605
Streptavidin-Pacific Blue eBioscience 48-4317-82
Ter119-biotin Fischer Scientific BDB553672
TMRM Millipore Sigma T5428-25MG
TPO PEPROTECH 315-14-10UG
Verapamil hydrochloride Millipore Sigma V4629-1G

Lab Prep

As cellular metabolism is a key regulator of hematopoietic stem cell (HSC) self-renewal, the various roles played by the mitochondria in hematopoietic homeostasis have been extensively studied by HSC researchers. Mitochondrial activity levels are reflected in their membrane potentials (ΔΨm), which can be measured by cell-permeant cationic dyes such as TMRM (tetramethylrhodamine, methyl ester). The ability of efflux pumps to extrude these dyes from cells can limit their usefulness, however. The resulting measurement bias is particularly critical when assessing HSCs, as xenobiotic transporters exhibit higher levels of expression and activity in HSCs than in differentiated cells. Here, we describe a protocol utilizing Verapamil, an efflux pump inhibitor, to accurately measure ΔΨm across multiple bone marrow populations. The resulting inhibition of pump activity is shown to increase TMRM intensity in hematopoietic stem and progenitor cells (HSPCs), while leaving it relatively unchanged in mature fractions. This highlights the close attention to dye-efflux activity that is required when ΔΨm-dependent dyes are used, and as written and visualized, this protocol can be used to accurately compare either different populations within the bone marrow, or the same population across different experimental models.

As cellular metabolism is a key regulator of hematopoietic stem cell (HSC) self-renewal, the various roles played by the mitochondria in hematopoietic homeostasis have been extensively studied by HSC researchers. Mitochondrial activity levels are reflected in their membrane potentials (ΔΨm), which can be measured by cell-permeant cationic dyes such as TMRM (tetramethylrhodamine, methyl ester). The ability of efflux pumps to extrude these dyes from cells can limit their usefulness, however. The resulting measurement bias is particularly critical when assessing HSCs, as xenobiotic transporters exhibit higher levels of expression and activity in HSCs than in differentiated cells. Here, we describe a protocol utilizing Verapamil, an efflux pump inhibitor, to accurately measure ΔΨm across multiple bone marrow populations. The resulting inhibition of pump activity is shown to increase TMRM intensity in hematopoietic stem and progenitor cells (HSPCs), while leaving it relatively unchanged in mature fractions. This highlights the close attention to dye-efflux activity that is required when ΔΨm-dependent dyes are used, and as written and visualized, this protocol can be used to accurately compare either different populations within the bone marrow, or the same population across different experimental models.

Procedure

As cellular metabolism is a key regulator of hematopoietic stem cell (HSC) self-renewal, the various roles played by the mitochondria in hematopoietic homeostasis have been extensively studied by HSC researchers. Mitochondrial activity levels are reflected in their membrane potentials (ΔΨm), which can be measured by cell-permeant cationic dyes such as TMRM (tetramethylrhodamine, methyl ester). The ability of efflux pumps to extrude these dyes from cells can limit their usefulness, however. The resulting measurement bias is particularly critical when assessing HSCs, as xenobiotic transporters exhibit higher levels of expression and activity in HSCs than in differentiated cells. Here, we describe a protocol utilizing Verapamil, an efflux pump inhibitor, to accurately measure ΔΨm across multiple bone marrow populations. The resulting inhibition of pump activity is shown to increase TMRM intensity in hematopoietic stem and progenitor cells (HSPCs), while leaving it relatively unchanged in mature fractions. This highlights the close attention to dye-efflux activity that is required when ΔΨm-dependent dyes are used, and as written and visualized, this protocol can be used to accurately compare either different populations within the bone marrow, or the same population across different experimental models.

Tags