The equipment described in the protocol is ethically approved by the hospital authorities and is used for clinical purposes. The Regional Committee for Medical Research Ethics approved the projects described.
1. Hardware and software for ERPs recording
- Use amplifiers (e.g., Mitsar 201) for EEG amplification according to manufacturer's protocol. WinEEG software and two interconnected computers are needed: the main computer for EEG and button pressing recording, and the slave computer, controlled by the main computer, for stimulus presentation.
- Use caps with nineteen electrodes placed on the head in accordance with the international 10-20 system.
NOTE: The equipment needed, caps, electrodes, gel etc. can be obtained from several manufacturers. - Place patients/subjects in a comfortable chair in a sound-proof room with no backlight.
- Use referential montage (Ref) which is default. For later comparisons with the HBi database; change montage to common average (Av).
2. Competence and education
- Ensure that everyone involved in registration of EEG, interpretation of data, clinical use and research must have the necessary professional background and specific training in the use of WinEEG.
3. Informing patients/participants
- Inform the patients/subjects that the procedure is not dangerous, and it does not hurt.
NOTE: The syringe needed to fill the 19 holes with gel is not sharp. - Inform the children that the researchers cannot read their minds. Tell them that in every brain some electrical activity takes place. To read it, the researchers need this equipment. There is nothing with the brain, but the researchers want to see how it works when it relaxes, and when it must attend to a task.
- Leave the equipment in place for 10 min.
NOTE: During this time period, the youngest children can watch a cartoon if they want. Sometimes a parent is silently present in the back of the room until the child feels safe. - Inform the subject that the test takes about one hour. When the equipment is properly placed, tell the subject to relax with closed eyes for 3 min, followed by 3 min relaxed with open eyes.
4. Creating the EEG data files
NOTE: WinEEG has its own build-in databases separately for storing raw EEG files (extension – .eeg), EEG spectra (extension – .spec), and ERP files (extension – .erp). The databases are created automatically and initially stored in WinEEG/data, WinEEG/spec and WinEEG/erp folders.
- To start a session with a patient, create a corresponding EEG data file by clicking on menu File | New. The patient's card appears on the screen.
NOTE: The following format is used: Put in the name or the code of the person to be tested. Put in the date of birth (DD.MM.YYYY), and M or F for sex. Use the other open fields on the patient card as needed.
5. Preparation of the equipment
- Use the small color-coded band to measure the circumference of the head to find the right size of the cap. Use a small patch to wipe off oil from earlobes and forehead. Measure the nasion-inion distance (ex. 35 cm). The center of the frontal pole electrodes should fall on a horizontal line 10% of this distance above the nasion (ex. 3.5 cm).
NOTE: The patient's hair must be clean (without hair products, etc.) and dry. - Put some skin prep gel (e.g., Neuprep) on the earlobes. Fill the ear electrode cups with conductive electro-gel (e.g., Ten20) and put on the ear-electrodes. Make sure that the other ends of these cables are connected to the amplifier.
- Tell the subject that the earlobe electrodes capture the "noise-electricity" in the room, and that this is subtracted from the electricity from the head to see what comes from the head without noise.
- Place the cap symmetrically on the head with the frontal pole electrodes placed as described above. Pull the cap down as far as possible to secure that it is close to the head.
- Put the waistband around the chest and fasten the push buttons connected to the cap to this band. This will prevent movements of the cap and electrodes during testing.
- Connect the cap-cable and the ear cables to the amplifier. Do not mix the left and right ear.
- Click on the WinEEG menu control of impedance icon. A simplified head with all electrodes appears. Second, fill the syringe with gel and use it to fill all electrode holes. Impedance is OK when the black circles are yellow.
NOTE: Fill all the holes before starting work with each electrode to secure proper impedance. Use a thin wooden stick to help the gel reach the skin of the head, which is a prerequisite for capturing electrical brain activity. - Start registration when all 20 holes have a yellow color on the screen, and the color difference between individual holes is small.
- Start monitoring the EEG record. Click on the green arrow (EEG monitoring).
NOTE: When the raw EEG signals from all 19 electrodes are seen, ask them to blink their eyes and point out the large changes at frontal sites. These artefacts can be automatically removed. The quality of the registration depends on relaxed jaws, eyes and forehead, and that all kind of head and body movements must be avoided as much as possible.
6. Registrations of "eyes closed" and "eyes opened"
- Tell the subject to relax in the comfortable chair with eyes closed for 3 min. Before starting "eyes opened" tell them to sit quiet for 3 min with their eyes opened resting on the screen in front of them.
- Push the red circle (acquire EEG) on the menu line, next to the "control of impedance" button.
- Choose "eyes closed" or "eyes opened" by pushing the next icon drop-down menu. This will start the registration. The elapsed time in seconds can be seen above the EEG curves.
- Push the pause-button (not "save" as this will make further registrations in the same file impossible) after 180 s. Ask them to open their eyes (or close them if eyes opened was the first part). Continue the registration. After 3 min, stop and save.
NOTE: If not saved, data will be lost when creating a new file.
7. Preparations for EEG recordings in the cued GO/NOGO task
- Insert a special USB dongle in the proper port before starting an EEG recording. A small light on the dongle indicates that the system is working.
- Give the subject a special button-switch in his/her right hand. It is needed to complete a test that takes about 20 min.
- Open the task menu and choose VCPT on the slave computer in front of the patient/participant.
NOTE: An instruction window showing all four combinations of pictures appears on the slave computer screen: (animal-animal (a-a), animal-plant (a-p), plant-plant (p-p) and plant-human (p-h). (Figure 1). The stimuli are presented on a 17-inch computer screen, 1.5 meter in front of the subjects. The sound measured at the subject's head must be 70 dB. - Instruct the subject that the pictures come in pairs, the first picture is followed by the second one in 1 s. After 3 s a new pair will start.
- Tell the subject that the left mouse button must be pressed every time the a-a combination appears. In a-a combinations, the two animals are always identical.
- Inform the subject to be as precise as possible, but also fast. The subject should not push the mouse button on a-p, p-p or a-h combinations.
- Tell the subject to ignore the random sounds in p-h combinations.
- Press enter on the slave computer and run the task for about 2-5 min to train the subject until he/she understands properly.
- On the slave computer choose the switch to slave mode option.
NOTE: The task presentation is now managed by the WinEEG program on the main computer.
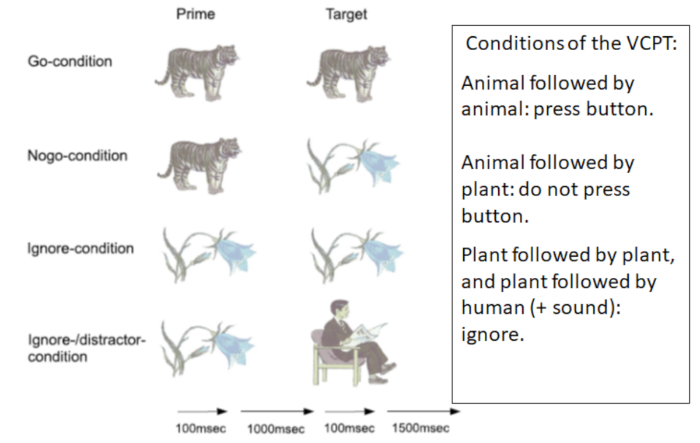
Figure 1: VCPT: Visual Continuous Performance Test. Figure 1 shows the four conditions of the VCPT. One hundred trials of each condition are presented randomly. The total test time is 20 min. Please click here to view a larger version of this figure.
8. EEG and button press recordings in task condition
- Start the EEG Monitoring option on the main computer from recording menu to check that the system works properly.
- Start EEG acquisition option from recording menu on the main computer menu box. Stimuli presentation program option is highlighted. Choose VCPT and start the stimuli presentations on the slave computer.
NOTE: Every time the left mouse button is pressed, a red mark is seen beneath the EEG curves. There are two lines, one for the left and one for the right mouse button. - Check that the red marks do not appear on the lowest line, as this indicates they used the right button. Use the pause button and tell the subject to use the left mouse button.
- Monitor the EEG registration and note incidents of potential interest. If too many artifacts, related to muscles or movements, are observed; pause the registration and remind the subject to relax and sit still. Continue registration.
NOTE: The EEG registration during the task takes 20 min and consists of 400 pairs of pictures; 100 of each pair; a-a, a-p, p-p and p-h. The pairs are presented in random order. (See Figure 1). - Take a short break after every 100 pairs. Push the pause button. When sitting in the chair encourage them to stretch their arms and legs and loosen their face muscles. Offer something to drink. Continue the registration after a minute or two.
9. Ending the registration
- Stop the registration when all 400 trials are completed by pressing Recording | Stop.
NOTE: By pressing the File Save option, the file with the recorded raw EEG and button pressing channel will be stored in the built-in database. - Tell the subject to remain seated until the researcher removes the cap, waist band, and ear electrodes.
NOTE: Usually there is no gel in the hair when this is completed. Remove gel with a paper cloth. Most patient/participant prefer to wash their hair when they are back home, but there should be an option to wash their hair right after the registration. - Thank the subject for completing the task. Ask them to rate the VCPT (1-10 scale), How boring? How exhausting? Depending on the agreement, tell them what happens next regarding the test results.
10. Cleaning
- Clean the ear electrodes (dip in hot water), and cap as soon as possible. Water, soap and a soft brush are needed. Check all holes to see that gel leftovers are removed before the caps are hung somewhere to dry.
11. Preprocessing the EEG record
NOTE: Three different electrode montages are provided in the HBIdb software. They are: linked ears reference (labeled as Ref), common average reference (labeled as Av), and local average reference (labeled as Aw). Select montage from Montage list in SETUP menu. EEG is recorded in Ref. Change to Av before starting artifact correction.
- Remove eye movement artifacts by applying a procedure of spatial filtration.
NOTE: The spatial filters are obtained by application of Independent Component Analysis (ICA) to a selected EEG fragment. The fragment must contain at least 90 s of raw data. - Select the EEG fragment by clicking the left button of the mouse on the time bar at the beginning of the fragment and by clicking the right button on the time bar at the end of the fragment. The whole fragment after the selection is highlighted by yellow color.
NOTE: The artifact correction procedure is implemented by choosing the Artifact correction option from Analysis menu. The window named Spatial filter parameters estimation appears on the screen. - Select the ICA method to be able to compare the individual spectra and ERPs with the HBI reference database.
NOTE: The Spatial filters parameters estimation window appears. From the left to the right: 1) a fragment of raw (uncorrected) multi-channel EEG, 2) a fragment of corrected EEG, 3) waveform of corrected artifacts, 4) time courses of extracted ICA components (from the top to the bottom) and 5) topographies of the independent components. - Select the topographies associated with eye blinks and horizontal eye movements. Accept by clicking OK.
- Implement the procedure named Mark artifacts by clicking the Mark artifacts option from the Analysis menu.
NOTE: This will reject slow and high frequency fragments-outliers: EEG fragments that are contaminated by non-eye movement artifacts (episodes of muscle tension, head movements etc.) are excluded from further analysis. In some complex cases manual artifact rejection can supplement the procedure described.
12. Computing EEG spectra
- Choose EEG spectra and fragment- eyes closed or eyes opened from the Analysis menu. If default settings are as shown in Figure 2 press OK.
NOTE: Spectra are shown in Figure 3 for all 19 sites. The x-axis is frequency in Hertz (Hz) and the y-axis is power in microvolt (µV). - Choose Analysis | Comparison of results to compare the individual spectra with the database. In the left window choose the patient/subject. In the right window choose the database file (or another opened file) and press OK for comparison. An image showing the difference between the subject and the database appears.
NOTE: Spectra show the squared mean power of the frequencies from 0 Hz to 30 Hz. (Frequencies below 1.5-2 Hz should be interpreted with caution as they are often influenced by artifacts). To interpret spectra is beyond the scope of this protocol. Paroxysmals of potential clinical interest may not appear in spectra but can be seen in raw EEG.
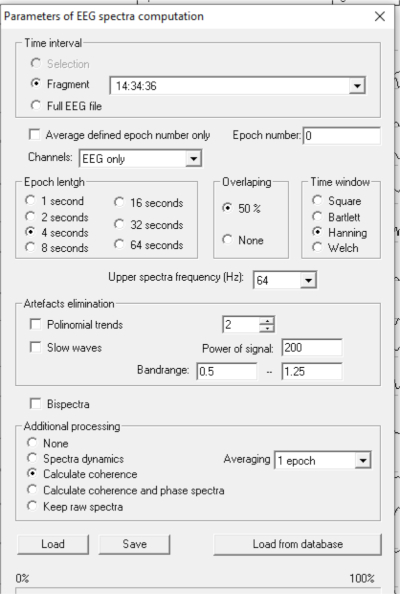
Figure 2: Computing EEG spectra. To compute spectra: Click Analysis | Spectra. If the settings are correct, the picture shown in Figure 2 appears. Please click here to view a larger version of this figure.
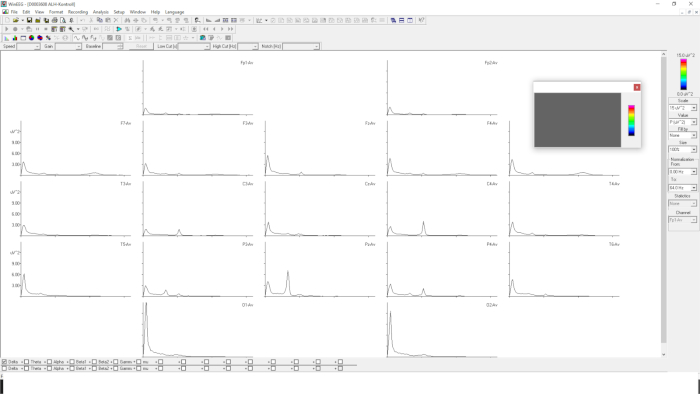
Figure 3: EEG spectra with 19 electrodes. Figure 3 shows EEG spectra in 19 sites. The x-axis is frequency from 0-30 Hz. The y-axis is power in µV2. Please click here to view a larger version of this figure.
13. Computing Event Related Potentials (ERPs)
NOTE: Event Related Potentials (ERPs) are computed by an averaging procedure. Only correct trials are included. ERPs are computed after completion of the preprocessing described above. The gold standard for computing ERPs is to keep the number of the averaged trials above 50.
- Select an EEG VCPT file in common average montage (Av). Click Compute ERP from the Analysis menu.
NOTE: If the HBdb dongle is not connected to the computer or is not activated for some reason, the HBdb allows the user to read the EEG files and to preprocess them but does NOT allow to compute spectra and ERPs with the database. - Click OK. A window depicting parameters of ERP computations occurs (Figure 4).
NOTE: As shown in Figure 4, the parameters are as follow: Trial groups: 1: a-a GO; 2: a-p NOGO; 3: p-p (ignore trials); 4: p-h (novelty trials); as well as 5: + meaning all trials started with presentation of a; and 6: – meaning all trials started with presentation of p. In addition, the ERP difference waves are shown. - Click OK. The ERPs for the analyzed file are computed and presented in graphical form in the ERP window (Figure 4).
NOTE: The ERP window consists of 19 graphs of ERPs for each task condition: a-a GO, a-p NOGO, p-p, p-h. Only a-a GO and a-p NOGO are shown in Figure 4. In each graph: X-axis is time in ms., Y-axis is voltage in µV. Figure 4 presents the results of adjustment of the presentation form. Only categories of trials a-a GO, a-p NOGO are selected (GO is depicted in green color, NOGO is depicted in red color). The scale is selected at 12 µV. The time interval is selected from 1400 ms; the time of presentation of Stimulus 2 is selected with a duration of 700 ms. - To map the wave for Event Related Potentials (ERPs) click the right button of the mouse at the selected time (along X-axis) on any graph, then release it and select Add map option for the opened menu. The corresponding maps appear at the bottom of the page.
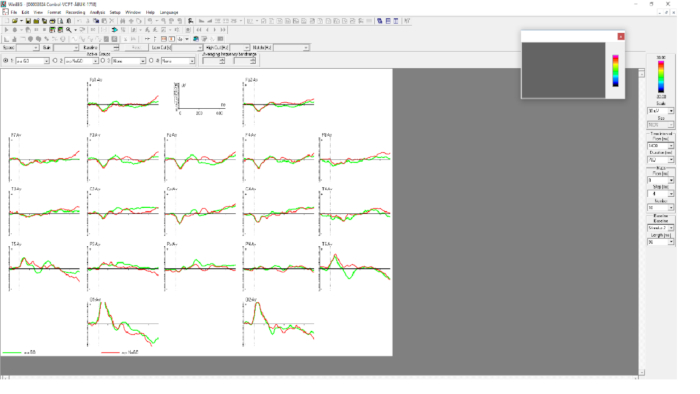
Figure 4: Parameters of ERP computations. Figure 4 shows ERP components a-a GO (green) and a-p NOGO (red) in 19 sites. The time interval is 1400 ms to 2100 ms. A-a GO is most clearly seen at site Pz and a-p NOGO at Cz. Please click here to view a larger version of this figure.
14. Registration and comparison of behavioral data in VCPT
- Click on the right mouse button in the window showing ERPs and choose groups info to see number of omissions (missed button clicks), commissions (impulsive extra clicks, mean reaction time (RT) for a-a-GO, and RT variability.
- Choose Analyses | Comparison of results. Mark the subject's file in the left window and the comparison file in the right window. Click OK.
NOTE: We use age-based paper-tables showing the percentiles for these variables in the norm group.
15. Comparing Event Related Potentials (ERPs) with the reference data base
NOTE: The time interval of interest for comparison is defined by typing the corresponding numbers in the menu: Time interval from (ms), Duration (ms). ERPs can be selectively presented for certain categories of trials (such a-a GO, a-p NOGO, p-p, p-h) by selecting the corresponding graph from the menu Active groups on the top of the ERP window.
- Choose Comparison of results from the Analysis menu. Click on the patient/subject in the left window and click on the HBIdb in the right window.
NOTE: To compare the subject with for example a previous registration, open the old file and choose this instead of HBIdb). The ERP comparison window appears. This window depicts the difference ERP wave in µV. Subject-Mean Reference is computed for each channel. - Press the right button of the mouse at a time point of interest and at a channel of interest in order to obtain the significance level of deviation from the reference. The corresponding values appear at the bottom of the window showing the difference in µV, the time point selected and the p-value.
NOTE: Presenting difference waves with confidence levels is an available option. The blue line under the graphs depicts confidence levels of deviation from the reference computed for each channel and each time point for the Group 3. - Select groups for ERP difference by clicking the arrow at 1 (the individual's ERPs). Select a-a GO [1]. For referential ERPs click 2. Select a-a GO [2]. Click 3 and a-a GO [D] to see the difference (1-2). Active group 4: Select None from this menu.
- Define the time interval of interest by typing (or selecting) the corresponding numbers in the menu: time interval from (ms), duration (ms) (e.g., 1400, 700 to analyze ERPs in response to the second stimulus).
- Put the cursor at a time point and channel of interest and click the right button of the mouse and select Add map from the pop out menu. A map showing the deviance from the reference is shown.
NOTE: Comparing independent components of Event Related Potentials (ERPs) with the reference data base, the software provides an option of decomposing individual ERPs into independent components. The components are associated with distinctive psychological operations.
Prediction of medication response in pediatric ADHD
ADHD is a common neuropsychiatric childhood disorder36. It is characterized by symptoms of inattention accompanied by symptoms of hyperactivity and impulsivity. Impairment in school, home, and leisure settings are common. In school aged children, the estimated prevalence is 5% to 7%. Comorbidities are common. Medical treatment, using stimulants based on methylphenidate (MPH) or dextroamphetamine (DEX), are widely used. Positive effects of stimulant medication (reductions in restlessness, hyperactivity and impulsivity and improved attention) are reported in 70% of the patients. Shifting from medication based on MPH to DEX can increase positive effects to 80%37,38. Frontal-striatal circuits seem to be activated by stimulants39.
There is no generally accepted definition of a medication response that is clinically meaningful. Applying rating scales, comparing baseline scores with scores on medication, is the most commonly used method. In some studies, a 25% or 50% reduction of scores is used as definition of response. In other studies, scores not exceeding 1 SD above population mean are used40,41. Clinically, an overall decision based on all relevant available data is used. To evaluate side effects, such as loss of appetite, insomnia, increased irritability, or anxiety, is important37,42.
The use of rating scales can be criticized for several reasons. Small correlations (0.30-0.50) between teacher and parent scores are reported in several studies48. The search for clinically useful predictors of response is motivated by a large number of non-responders, informants that do not agree, and the fact that everyone can have some modest effects of improved attention when small doses of stimulants are used. Published research on predictors of response include ADHD subtype, demographics, comorbid disorders, gene variables, scores on rating scales, neuropsychological test results, and EEG/ERP variables43,44,45,46. Our 2016 publication47 summarizes studies that have applied ERPs to predict medication response.
In previous studies, we analyze d data from the cued visual GO/NOGO task (i.e., attention test data, EEG spectra, and ERPs). In one study, we found 3 variables contributing significantly to the prediction of side-effects. These variables were combined to an index that was considered clinically meaningful42. In a study on clinical effects, applying the same methods, the prediction index was also considered clinically useful48. The effects of a single dose of stimulant medication on medication responders (REs) and non-responders (non-REs) was investigated in a third study47. The test procedure was completed twice, the first test with no medication, and the second test an hour after having received a trial dose. Based on rating scales and interviews after a 4-week medication trial, the patients were classified as REs or non-REs. Our focus was on changes in cognitive ERPs and attention test scores. We found that the effects on the P3 NOGO component was significantly different in the two groups, with a large effect size (d = 1.76). A significant increase of the component amplitude was seen in REs but not in non-REs. Predictions of response based on two tests was improved compared with predictions based only on test 1.
In our latest study, we developed two global indexes, one for prediction of clinical gains and one for prediction of side-effects. As described above we combined variables that discriminated significantly between compared groups with a modest or large effect size. Each variable was weighted in accordance with the effect size. We examined variables from all three WinEEG domains: EEG spectra, ERPs and behavior. The following variables were combined: Test 1: P3NOGO amplitude and theta/alpha ratio; differences between Test 2 and Test 1: Omission errors, reaction time variability, contingent negative variation (CNV) and P3NOGO amplitude. The effect size of the global scale was d = 1.86. Accuracy was 0.92. Prediction of side-effects was based on 4 variables: Test 1: RT, Test 2: novelty component, alpha peak frequency, and reaction time changes (Test 2 – Test 1). The global scale d was 1.08 and accuracy was 0.7849.
Some preliminary results
In an ongoing study, we compare a group of 61 ADHD patients age 9-12 years and a group of 67 age-matched healthy controls (HC). The final statistical analyses have so far not been completed. Below we are presenting the preliminary results obtained from WinEEG assessment.
Behaviorally, the ADHD group showed an inattention pattern with statistically (at p<0.001) more omission errors in comparison to the healthy controls (HC) group (13.7% vs. 4.8%) accompanied by an attention lapses pattern expressed in statistically higher (p<0.001) variability of reaction time (151 ms vs. 125 ms).
The main results of comparing ERP waveforms between the two groups are shown in Figure 5 and Figure 6. Figure 5 demonstrates the ERP correlates of dysfunction of proactive cognitive control in ADHD group. Two indexes of proactive cognitive control (P3 cue wave and CNV wave) are reduced in the ADHD group in comparison to the HC group. Figure 6 demonstrates the ERP correlates of dysfunction of reactive cognitive control in the ADHD group. Two indexes of reactive cognitive control (N2 NOGO and P3 NOGO) are reduced in the ADHD group in comparison to the HC group.
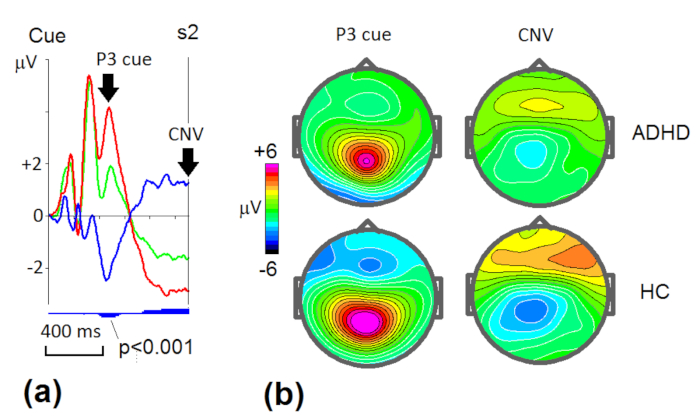
Figure 5: Grand average ERP wave patterns (a) and the corresponding maps (b) in proactive cognitive control in ADHD and healthy control (HC) groups. (a) ERPs measured at P3 in ADHD group (green line) and HC group (red line) and their difference (ADHD-HC) wave (blue line). Blue vertical bars below the curves indicate level of statistical significance of the difference (small bars – p<0.05, middle bars – p<0.01, large bars – p<0.001). Arrows indicate the classical waves – P3 cue and CNV (contingent negative variation). (b) Maps at the maximums of amplitudes of P3 and CNV waves for the two groups. Please click here to view a larger version of this figure.
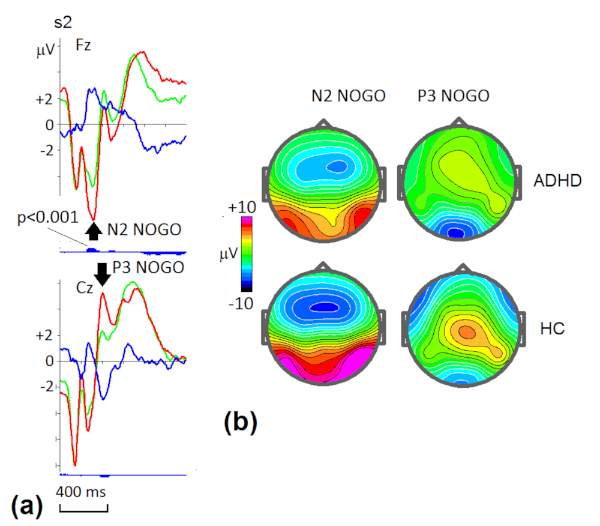
Figure 6: Grand average ERP wave patterns (a) and the corresponding maps (b) in reactive cognitive control in ADHD and healthy control (HC) groups. (a) ERPs measured at Fz and Cz ADHD group (green line) and HC group (red line) and their difference (ADHD-HC) wave (blue line). Blue vertical bars below the curves indicate the level of statistical significance of the difference (small bars – p<0.05, middle bars – p<0.01, large bars – p<0.001). Arrows indicate the classical waves – N2 NOGO and P3 NOGO. (b) Maps at the maximums of amplitudes of N2 NOGO and P3 NOGO waves for the two groups. Please click here to view a larger version of this figure.
As one can see the ADHD group shows hypo-functioning of multiple operations of cognitive control. These operations occur in different time windows and in different spatial locations. A particular patient might have only one hypo-functioning indicating the source of the individual disorder and the ways of its correction.
Clinical significance
To compute a clinically useful biomarker for a heterogenous diagnosis such as ADHD, several variables that differ significantly between ADHD and controls need to be combined. The effect size (d) of an index should be above d = .8. An important next step will be applying this index when ADHD is compared with clinical controls.