Science Education
>

Brain Morphology of Cannabis Users With or Without Psychosis: A Pilot MRI Study

Instructor Prep
concepts
Student Protocol
JoVE Journal
Neuroscience
This content is Free Access.
JoVE Journal Neuroscience
Brain Morphology of Cannabis Users With or Without Psychosis: A Pilot MRI Study

10 CIP patients and 12 NPCU were recruited for this study. All patients were recruited at the psychiatric inward of the University Policlinico Hospital of Milan, Italy, whereas the cannabis users were enrolled in the Milan catchment area. All patients were in stable pharmacological treatment. Either left- or right- handed participants were included. All participants had a habitual cannabis consumption and the type of drug, the frequency and the duration, as well socio-demographic, clinical and psychosocial parameters of dependency were measured. The study was approved by the local ethical committee.

1. Participants

  1. Use the following inclusion criteria: For patients: age 18-45 years old, DSM-IV diagnosis of Cannabis-induced Psychotic Disorder, heavy cannabis consumption at the time of the study and in the previous 6 months. For NPCU: age 18-45 years old, no DSM-IV diagnosis, heavy cannabis consumption at the time of the study and in the previous 6 months.
  2. Use the following exclusion criteria: a diagnosis of mental retardation, any current major medical or neurological illness, a history of traumatic head injury with loss of consciousness, and any other Axis I, including alcohol abuse, or Axis II disorders and pregnancy. Verify that psychotic symptoms do not precede the onset of the cannabis use and do not persist for a substantial period of time after the cessation of acute withdrawal or severe intoxication. Verify that there is no history of recurrent nonsubstance-related episodes.
  3. To obtain informed consent read the consent form to the participants. Have both the participant and the investigator sign the consent form in duplicate. Store the consent form for records.
  4. To evaluate the diagnosis of CIP patients, use the Structured Clinical Interview for Diagnosis (SCID-I) of the Diagnostic and Statistical Manual of Mental Disorders, 4th edition, text revision (DSM-IV-TR)27.
  5. To establish the frequency and the duration of dependency, use the manual for the semistructured clinical interview for children and adolescents SCICA28.

2. Clinical and psychosocial evaluation

NOTE: Several clinical and psychosocial scales were administered to all the participants.

  1. To evaluate psychiatric symptoms, use the Brief Psychiatric Rating Scale (BPRS)29, the Young Mania Rating Scale (YMRS)30, the Montgomery-Åsberg Depression Rating Scale (MADRS)31, the Hamilton Depression Rating Scale (HAM-D)32 and the Hamilton Anxiety Rating Scale (HAM-A)33.
  2. To explore the presence of trauma or infection during or immediately after the partum, use the Murray-Lewis Obstetric Complications Scale (MLOCS)34.
  3. To assess experiences of neglect or abuse, use the Childhood Experience of Care and Abuse Questionnaire (CECA-Q)35.
  4. To estimate the Socio-economic status (SES), use the Socio Economic Status Scale of MacArthur36.
  5. Use the Neighbourhood Scale (NS)37 to assess the specific characteristics of the neighbourhood, in terms of neighbourhood satisfaction (NS-A), sense of security (NS-B), level of degradation (NS-C), willingness on the part of fellow citizens to intervene in adverse situations (NS-D), and degree of acceptance of substances (NS-E).
  6. Employ the Temperament and Character Inventory (TCI-125) for exploring personality traits38,39.
  7. To assess the quality of life and the global functioning use the Manchester Short Assessment of Quality of Life (MANSA)40 and the Quality of Life Index (QL-index)41 and the Global Assessment of Functioning (GAF)27 scales, respectively.
    NOTE: All socio-demographic and clinical data are summarized in Table 1.

3. Magnetic resonance imaging

  1. Insert the participant in a supine position on the bed of the 3 Tesla MRI scanner.
  2. Place a radio frequency (RF) coil over the participant’s head.
  3. Provide earplugs and headphones to block background noise.
  4. Attach foam pads to immobilize the head.
  5. Instruct the subject to remain still.
  6. Run MRI session from the workstation in the control room.
    1. Run a 3-plane gradient echo scan for alignment and localization and perform a shim procedure to generate a homogeneous, constant magnetic field.
    2. Start an echo-planar-imaging protocol for MRI. The acquisition parameters for the acquisition of high-resolution T1-weighted three-dimensional brain scan are already set in the imaging program and should not be changed. The parameters are: repetition time [TR] = 9.8, echo time [TE] = 4.6 ms, in plane voxel size= 0.9375 × 0.9375, matrix= 256 × 256, flip angle = 8°.
  7. Remove the participant from the MR scanner room. Transfer the MR data to disk and close the session.
    NOTE: A total of 185 contiguous 1 mm sagittal slices extending superiorly from the inferior aspect of the cerebellum to encompass most of the brain were selected from a sagittal localizer scan.

4. Pre-processing steps

NOTE: A voxel-based morphometry analysis should be performed using Statistical Parametric Mapping (SPM12) implemented in MATLAB.

  1. Perform the following pre-processing steps, shown in the Script_pre-processing script file, before carrying out group analyses.
    1. Segmentation: Process the structural image to distinguish and separate the white matter tissues, the grey matter tissues and the cerebrospinal fluid into different images. This separation is obtained thanks to the combination of probability maps, elaborated from the general knowledge of tissue distribution combined with model cluster analyses that identifies voxel distributions of specific tissues in the original image. Run the segment.mat batch file.
    2. DARTEL (Diffeomorphic Anatomical Registration Through Exponentiated Lie algebra) tools: determine the nonlinear deformations for registering the GM and white matter images of all participants. Run the create_template.mat batch file.
    3. Normalization: during the spatial normalization phase, adapt MRI images to an anatomical standard template. This is because every subject has little differences in the form and organization of the brain such as the size and morphologic differences in structures. Run the normalize_to_MNI.mat batch file.
    4. Spatial Smoothing: after motion correction, perform an isotropic Gaussian kernel of 6 mm full width at half maximum Gaussian kernel to increase the signal-to-noise ratio and to account for subtle variations in anatomic structures. Run the normalize_to_MNI.mat batch file.
    5. Extract the total intracranial volume (ICV) using SPM12: it can be obtained by adding up the density values in GM, white matter, and CSF class images and multiplying by the voxel volumes.
      NOTE: Once the pre-processing is completed, it is possible to elaborate the data.
      NOTE: Please refer to the SPM manual (https://www.fil.ion.ucl.ac.uk/spm/doc/spm12_manual.pdf) that provides a detailed description of the pre-processing steps employed in this study and the SPM commands to use. Please also refer to the script and Matlab batches included in the supplementary materials with the exact pre-processing steps used for this study.

5. Statistical analyses

  1. Perform chi-square tests (categorical variables) and two sample t tests (quantitative variables) for exploring differences between the two groups on demographic, clinical and psychosocial scale.
  2. Perform a one-way Analysis of Variance (ANOVA), in the context of a General Linear Model (GLM) design to compare GM volumes between CIP patients and NPCU. Gender and age were used as controlling variables in all the analyses. Run the one-way ANOVA batch file.
  3. Carry out whole-brain regression analyses, only for the CIP group, to explore whether the scores in all the clinical and psychosocial scales employed in this study were significantly correlated with GM volumes changes. Do not use any brain mask but consider all voxels. Run the Regression analysis batch file with the clinical scale of interest.
  4. Convert stereotactic coordinates of the peak maxima of the suprathreshold clusters from the MNI spatial array (www.mni.mcgill.ca) to that of Talairach and Tournoux42.
    NOTE: In all the neuroanatomical analyses, the volumetric differences among subjects were considered by proportional scaling for the total intracranial volume (ICV).
    1. For the ANOVA, set the significance threshold to p < 0.001 uncorrected, with a minimum cluster size of k=30, whereas for the multiple regression analyses, a p < 0.05 peak Family-Wise Error (pFWE) corrected was considered significant and a minimum cluster size of k=10 was employed. The former threshold was considered due to the small sample size employed in this study and therefore the results emerged from this analysis must be considered as preliminary. The latter threshold is more stringent since the p-value is corrected for multiple comparisons.
      NOTE: Please refer to the VBM8 Manual for more details about post-processing steps (http://dbm.neuro.uni-jena.de/vbm8/VBM8-Manual.pdf). Please also refer to the Matlab batches named “one-way ANOVA” and “Regression analysis” included in the supplementary materials with the exact model used for this study. Due to the exploratory nature of this study, a formal sample size calculation would have been of little value and therefore it was not performed.

Brain Morphology of Cannabis Users With or Without Psychosis: A Pilot MRI Study

Learning Objectives

Socio-demographic, clinical and psychosocial results
There were no differences in terms of gender (χ2 =0.6, p=0.4), age (t=-0.21; p=0.83), age of onset of dependency (t=-0.79; p=0.44) and educational level (t=1.21; p=0.24) between CIP patients and NPCU. However, some differences between the two groups were observed in one temperament dimension (Harm Avoidance, t=3.71; p=0.001) and one-character dimension (Self-Transcendence, t=2.94; p=0.008) of the TCI where CIP patients showed higher scores compared to NPCU. Finally, NPCU also showed higher scores compared to CIP patients in one sub-dimension of the Neighborhood Scale (NS-E) (t=-3.55; p=0.002), in the SES total (t=-2.13; p=0.046), in the Quality of Life-Index (t=-8.1; p=0.0001), in the GAF (t=-4.71; p=0.0001) and in one character dimension of the TCI (Self Directedness, t=-3.97; p=0.001).

Specifically, for CIP, the frequency of cannabis dependency was daily for 9 subjects (90%) and several times a week for 1 subject (10%). Instead, the frequency of cannabis dependency in the NPCU group was daily for 7 subjects (60%), several times a week for 4 subjects (30%), and multiple times a month for 1 subject (10%). The mean age of onset of dependency was at 18 years old for CIP patients and at 16 years old for the NPCU group. Although all participants were taking cannabis, some CIP patients (N=6) and NPCU (N=3) also reported previous use of other drugs, including cocaine, LSD and heroin/methadone, but with lower frequency than cannabis. The frequency of cannabis use did not differ between the two groups (χ2=1.69, p=0.42). Moreover, no statistical difference in type and frequency of cocaine, heroin/methadone and LSD use was observed between the two groups (cocaine: χ2=0.06, p=0.79 and χ2=4.1, p=0.39; heroin/methadone: χ2=1.2, p=0.26 and χ2=1.2, p=0.26; LSD: χ2=0.01, p=0.89 and χ2=2.0, p=0.36). Although we are aware that the presence of poly-consumption in the sample might have negatively affected the generalizability of the findings, it is important to highlight that the use of other drugs was very limited compared to cannabis use. Indeed, in contrast to cannabis use, the consumption of other drugs was lifetime and not occurring during the time of the study. Nonetheless, our results should be taken cautiously and need to be replicated in a more homogeneous sample.

VBM results
VBM analysis showed that CIP patients had extensive GM decreases compared to NPCU in right superior frontal gyrus ((Brodmann area [BA] 10), right precentral (BA 4) , right superior temporal gyrus (BA 22), insula bilaterally (BA13), right precuneus (BA7), right medial occipital gyrus (BA 19), right fusiform gyrus (BA 37) and left hippocampus (p < 0.001 uncorrected; Table 2 and Figure 1). No GM differences were observed in NPCU compared to CIP patients.

Correlations between GM regions and clinical scales
In CIP patients, the results showed a negative correlation between a domain of the BPRS, BPRS-Activity, and selective GM volumes within left superior temporal cortex (BA 38, x=-40 y=17 z=-35, z=5.9, cluster size=19) and left cerebellum (x=-12 y=-36 z=-20, z=6.1, cluster size=18). Moreover, the same scale was positively correlated with cuneus bilaterally (BA 18; left: x=-9 y=-90 z=9, z=7.0, cluster size=24; right: x=15 y=-85 z=24, z=7.3, cluster size=13), left inferior occipital gyrus (BA 17; x=-9 y=-88 z=-6, z=7.4, cluster size=34), right inferior parietal lobule (BA 40; x=58 y=-35 z=22, z=6.7, cluster size=33), right superior prefrontal cortex (BA 9; x=3 y=51 z=29, z=6.2, cluster size=23) (all p<0.05 pFWE corrected). No significant correlations in any of the other clinical scales were observed in CIP patients.

Figure 1
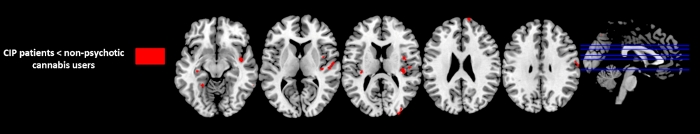
Figure 1: Regions with significant GM difference between Substance-induced psychosis (CIP) patients and non-psychotic cannabis users (p<0.001, uncorrected, k=30). Please click here to view a larger version of this figure.

CIP patients Non-psychotic cannabis users Statistics p-value
n=10 n=12
Age, mean (SD) 27 (9.21) 26 (0.89) t= -0.213 p=0.833
Sex, male/female 8/2 11/1 χ2=0.630 p=0.427
Age of onset of cannabis use, mean (SD) 18 (9.69) 16 (1.83) t= -0.786 p=0.441
Type (N); frequency of other drug use Cannabis (N=10); Daily (N=9), multiple times a week (N=1). Cannabis (N=12); Daily (N=7), multiple times a week (N=4), multiple times a month (N=1). Frequency: χ2=1.69, p=0.42
Cocaine (N=4); multiple times a week (N=2), multiple times a month (N=2). Cocaine (N=3); multiple times a week (N=1), multiple times a month (N=1), less than one a month (N=1). Type: χ2=0.06 Type: p=0.79
Frequency: χ2=4.1 Frequency: p=0.39
Heroin/Methadone (N=1); multiple times a week. No Heroin/Methadone users. Type: χ2=1.2 Type: p=0.26
Frequency: χ2=1.2 Frequency: p=0.26
LSD (N=1); less than one a month. LSD (N=1); multiple times a month. Type: χ2=0.01 Type: p=0.89
Frequency: χ2=2.0 Frequency: p=0.36
Age of onset, mean (SD) 25 (8.46)
BPRS TOT, mean (SD) 43 (9) 20 (3) t=8.860 p=0.0001
Anxiety-Depression 10 (5) 6 (2) t=2.629 p=0.016
Anergia 8 (3) 4 (1) t=3.284 p=0.004
Thought Disorders 12 (3) 4 (0) t=9.754 p=0.0001
Activity 6 (2) 3 (0) t=4.557 p=0.0001
Hostility- Suspiciousness 8 (4) 3 (0) t=4.053 p=0.001
HAM-D, mean (SD) 11 (6.42) 4 (4.96) t=3.258 p=0.004
HAM-A, mean (SD) 11 (6.62) 3 (3.93) t=3.487 p=0.002
MADRS, mean (SD) 14 (7.76) 6 (6.35) t=2.635 p=0.016
YMRS, mean (SD) 13 (7.92) 0 (1.44) t=5.378 p=0.0001
CECA-Q, mean (SD)
CECA-QMA 13 (5.20) 13 (3.89) t=-0.069 p=0.946
CECA-QMN 19 (5.83) 19 (4.64) t=-0.284 p=0.779
CECA-QPA 14 (6.44) 14 (5.56) t=-0.130 p=0.990
CECA-QPN 24 (11.69) 24 (7.12) t=0.070 p=0.945
Neighbourhood scale*, mean (SD)
NS- A 9 (1.78) 8 (2.23) t=0.782 p=0.443
NS- B 6 (2.50) 7 (1.56) t=-1.070 p=0.298
NS- C 9 (5.87) 10 (7.66) t=-0.265 p=0.794
NS-D 6 (2.31) 5 (1.53) t=1.378 p=0.183
NS-E 3 (1.35) 4 (0.29) t=-3.546 p=0.002
SES** total, mean (SD) 33.6 (12.60) 45.3 (13.05) t=-2.132 p=0.046
Study 11.3 (4.22) 15.3 (5.93) t=-1.800 p=0.087
Occupation 22.3 (10.39) 30.0 (8.79) t=-1.885 p=0.074
QL – Index, mean (SD) 6 (1.65) 10 (0.62) t=-8.098 p=0.0001
GAF, mean (SD) 58 (15.21) 83 (9.68) t=-4.715 p=0.0001
MANSA, mean (SD) 54 (14.16) 61 (6.01) t=-1.250 p=0.226
TCI, mean (SD)
TCI Ns 59.92 (10.75) 55.95 (12.86) t=0.173 p=0.864
TCI Ha 55.67 (7.71) 45.61 (5.68) t=3.708 p=0.001
TCI Rd 48.67 (10.41) 50.49 (9.02) t=-0.668 p=0.512
TCI P 49.82 (11.49) 39.32 (8.83) t=2.033 p=0.056
TCI Sd 28.64 (11.85) 49.89 (7.42) t=-3.969 p=0.001
TCI Co 42.15 (12.21) 49.07 (5.60) t=-1.430 p=0.168
TCI St 65.56 (12.34) 50.82 (8.16) t=2.940 p=0.008

Table 1: Socio-demographic, clinical and psychosocial variables of the whole sample. BPRS (Brief Psychiatric Rating Scale); CECA-Q (Childhood Experience of Care and Abuse Questionnaire); CIP (Cannabis-Induced Psychosis); GAF (Global Assessment of Functioning); HAM-A (Hamilton Anxiety Rating Scale); MADRS (Montgomery-Asberg Depression Rating Scale); HAM-D (Hamilton Depression Rating Scale); MANSA (Manchester Short Assessment of Quality of Life); NS-A (Neighbourhood satisfaction); NS-B (Feelings of safety); NS-C (Neighbourhood incivilities); NS-D (Collective efficacy); NS-E (Cannabis acceptance); SD (Standard Deviation); SES (Socio Economic Status); QL-Index (Quality of Life-Index); ); TCI (Temperament and Character Inventory); TCI Ns (Novelty Seeking); TCI Ha (Harm Avoidance); TCI Rd (Reward Dependence); TCI P (Persistence); TCI Sd (Self Directedness); TCI Co (Cooperativeness); TCI St (Self Transcendence); YMRS (Young Mania Rating Scale). * NS-A ranges from 0 to 16, where 16 represented extreme satisfaction with the area of residence; NS-B ranges from 0 to 8, where 8 represented a strong feeling of safety; NS-C ranges from 0 to 32, where 32 indicated a high level of incivilities; NS-D ranges from 0 to 12, where 8 represented a high level of collective efficacy amongst neighbours; NS-E ranges from ‘agree strongly’ (score of 4) to ‘disagree strongly’ (score of 0). ** Lower levels of schooling are associated to lower scores while higher levels of schooling are associated to higher scores (ie. Less than 7th grade = 3; Graduate degree= 21). Similarly, Occupations with lower cognitive engagement are associated to lower scores, while occupations requiring more cognitive resources are associated to higher scores (Farm worker= 5; Physician= 45).

Gyrus BA Laterality MNI coordinates Cluster size z-values Cohen’s d effect size
x y z
CIP patients < non-psychotic cannabis users
Superior Frontal 10 Right 13 65 22 38 3.4 -1,26
Precentral 4 Right 59 -5 26 61 3.8 -0,83
Superior Temporal 22 Right 62 -7 3 146 4.2 -0,60
Insula 13 Right 36 -21 13 142 4.1 -0,43
Insula 13 Left -33 -23 14 32 3.8 -0,46
Precuneus 7 Right 6 -66 50 41 3.7 -0,51
Medial Occipital 19 Right 33 -86 21 80 4 -0,84
Fusiform 37 Left -25 -47 -8 32 3.7 -0,29
Hippocampus Left -33 -22 -5 36 3.8 -0,68
Non-psychotic cannabis users < CIP patients
No suprathreshold clusters

Table 2: VBM results. Brain regions showing significant reduced grey matter volumes between the CIP patients and non-psychotic cannabis users (P< 0.001 uncorrected). BA (Brodmann area); CIP (Cannabis-Induced Psychosis); MNI (Montreal Neurological Institute)

List of Materials

Not applicable Not applicable Not applicable Not applicable

Lab Prep

Cannabis is the illicit drug most commonly used worldwide, and its consumption can both induce psychiatric symptoms in otherwise healthy subjects and unmask a florid psychotic picture in patients with a prior psychotic risk. Previous studies suggest that chronic and long-term cannabis exposure may exert significant negative effects in brain areas enriched with cannabinoid receptors. However, whether brain alterations determined by cannabis dependency will lead to a clinically significant phenotype or to a psychotic outbreak at some point of an abuser’s life remains unclear. The aim of this study was to investigate morphological brain differences between chronic cannabis users with cannabis-induced psychosis (CIP) and non-psychotic cannabis users (NPCU) without any psychiatric conditions and correlate brain deficits with selective socio-demographic, clinical and psychosocial variables.

3T magnetic resonance imaging (MRI) scans of 10 CIP patients and 12 NPCU were acquired. The type of drug, the frequency, and the duration, as well socio-demographic, clinical and psychosocial parameters of dependency were measured. CIP patients had extensive grey matter (GM) decreases in right superior frontal gyrus, right precentral, right superior temporal gyrus, insula bilaterally, right precuneus, right medial occipital gyrus, right fusiform gyrus, and left hippocampus in comparison to chronic cannabis users without psychosis. Finally, in CIP patients, the results showed a negative correlation between a domain of the Brief Psychiatric Rating Scale (BPRS), BPRS-Activity, and selective GM volumes. Overall, the results suggest that cannabis-induced psychosis is characterized by selective brain reductions that are not present in NPCU. Therefore, neuroimaging studies may provide a potential ground for identifying putative biomarkers associated with the risk of developing psychosis in cannabis users.

Procedure

Cannabis is the illicit drug most commonly used worldwide, and its consumption can both induce psychiatric symptoms in otherwise healthy subjects and unmask a florid psychotic picture in patients with a prior psychotic risk. Previous studies suggest that chronic and long-term cannabis exposure may exert significant negative effects in brain areas enriched with cannabinoid receptors. However, whether brain alterations determined by cannabis dependency will lead to a clinically significant phenotype or to a psychotic outbreak at some point of an abuser’s life remains unclear. The aim of this study was to investigate morphological brain differences between chronic cannabis users with cannabis-induced psychosis (CIP) and non-psychotic cannabis users (NPCU) without any psychiatric conditions and correlate brain deficits with selective socio-demographic, clinical and psychosocial variables.

3T magnetic resonance imaging (MRI) scans of 10 CIP patients and 12 NPCU were acquired. The type of drug, the frequency, and the duration, as well socio-demographic, clinical and psychosocial parameters of dependency were measured. CIP patients had extensive grey matter (GM) decreases in right superior frontal gyrus, right precentral, right superior temporal gyrus, insula bilaterally, right precuneus, right medial occipital gyrus, right fusiform gyrus, and left hippocampus in comparison to chronic cannabis users without psychosis. Finally, in CIP patients, the results showed a negative correlation between a domain of the Brief Psychiatric Rating Scale (BPRS), BPRS-Activity, and selective GM volumes. Overall, the results suggest that cannabis-induced psychosis is characterized by selective brain reductions that are not present in NPCU. Therefore, neuroimaging studies may provide a potential ground for identifying putative biomarkers associated with the risk of developing psychosis in cannabis users.

Tags